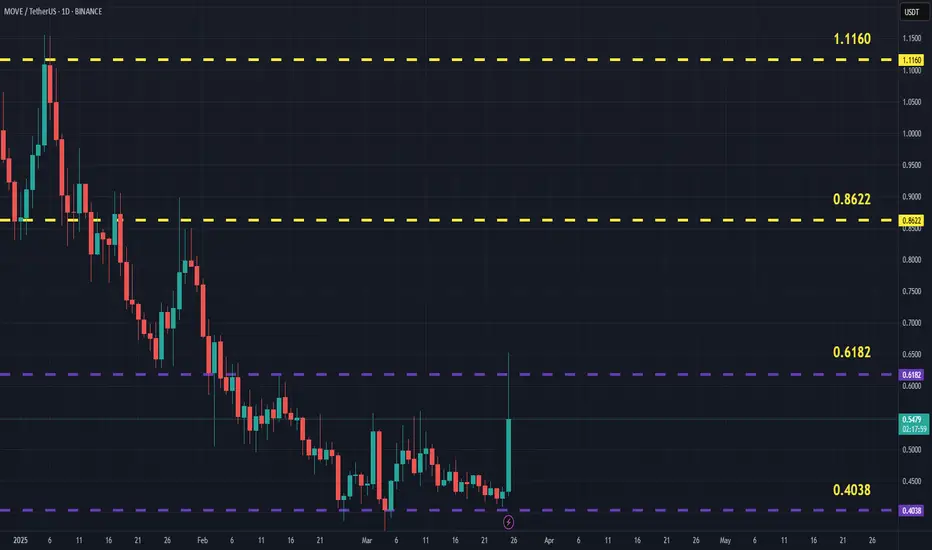
MOVEUSDT(Movement) Updated till 25-03-25MOVEUSDT(Movement) Daily timeframe range. fairly new PA here. as of that it got good opportunity for right setups. for now recent resistance at 0.6182 breaking that can push it toward 0.8622. local support at 0.4038.
Signalservice
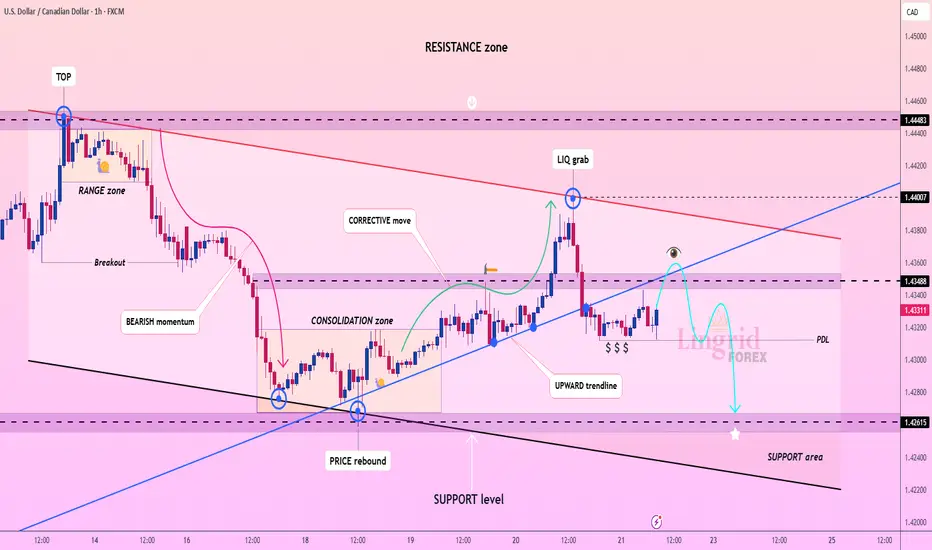
Lingrid | USDCAD potential Selling OPPORTUNITY Post-Sell-OffThe price perfectly fulfilled my last idea . It hit the target level. Following the bearish movement, FX:USDCAD made a pullback, and on the daily timeframe, it formed a long-tailed bar that suggests a potential retest of the zone above the 1.4200 level. After the recent drop, the market is now moving sideways, just above the previous day low. If the market breaks and closes below this low, it may retest the support zone below. However, considering that the price action remains within the weekly range, it could continue to oscillate between the upper and lower boundaries. I expect a downward move if the price holds below the upward trendline. My goal is support zone around 1.42615.
Traders, If you liked this educational post🎓, give it a boost 🚀 and drop a comment 📣
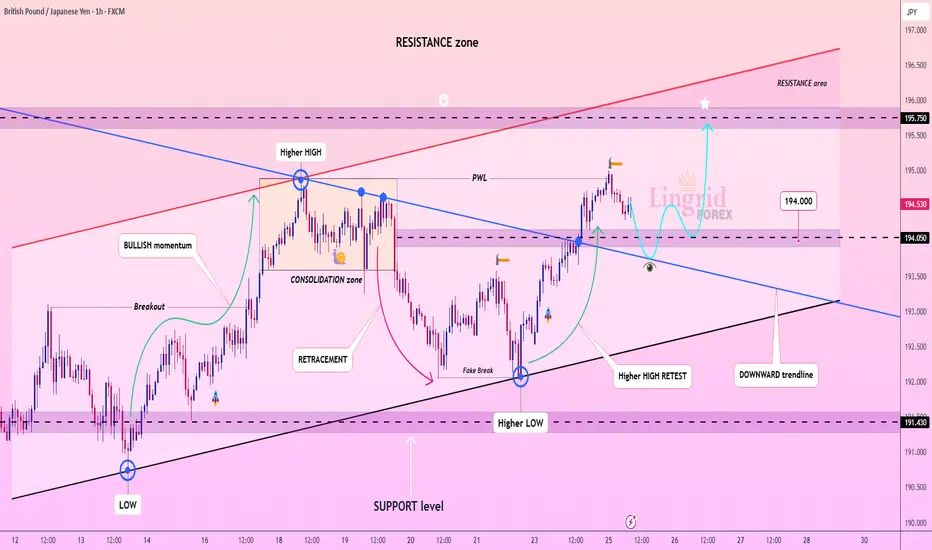
Lingrid | GBPJPY trend CONTINUATION Following a BreakoutThe price perfectly fulfilled my last idea . It hit the TP level. The overall FX:GBPJPY price action is forming an ABC move, with the C point completing around the 196.000 level. Recently, the price broke and closed above both the downward trendline and the support level at 194.000. Currently, it is testing last week's high, which coincides with the psychological level of 195.000. On the daily timeframe, a big bullish candle has formed, indicating bullish dominance. I believe the price may create a range zone at this level before continuing higher and potentially breaking out of the PWH. My goal is resistance zone at 195.750
Traders, If you liked this educational post🎓, give it a boost 🚀 and drop a comment 📣
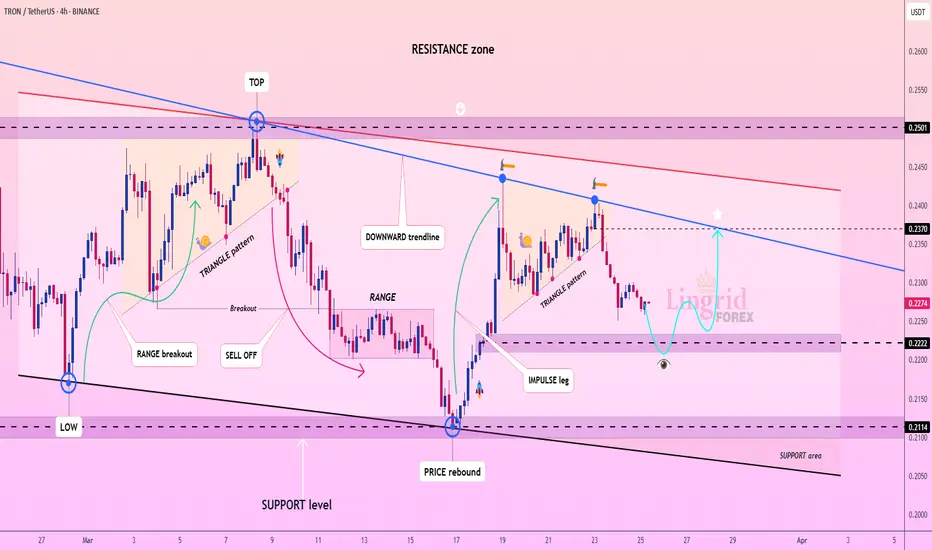
Lingrid | TRXUSDT sideways MARKET Movement. Long OpportunityThe price perfectly fulfilled my last idea . It reached the target level. BINANCE:TRXUSDT market recently made a fake break of the previous support level before bouncing back and reaching the upper boundary of the channel. When we zoom out, it's clear that the price has been consolidating for two months. Notably, the market has created a range zone at support level around 0.2200, with the price rebounding from this level multiple times, indicating its importance to the market. I think the price may move upward from this support, retest the trendline, and potentially approach the channel's upper boundary. My goal is resistance zone at 0.2370
Traders, If you liked this educational post🎓, give it a boost 🚀 and drop a comment 📣
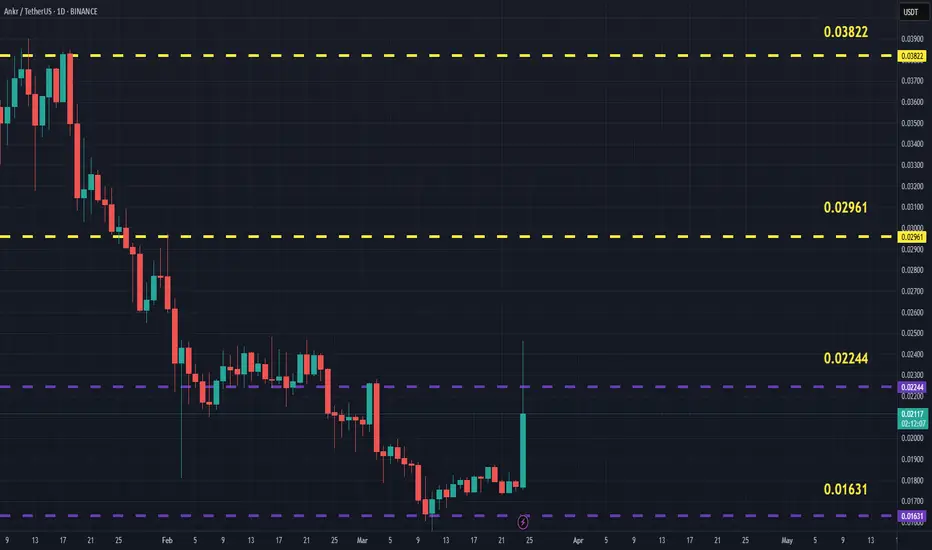
ANKRUSDT(Ankr) Updated till 24-03-25ANKRUSDT(Ankr) Daily timeframe range. many alts got similar pattern. pushing back from its new low. if those alts can defend their new low they got long way to go. now recent resistance at 0.02244 it will be optimal if it can get over it.
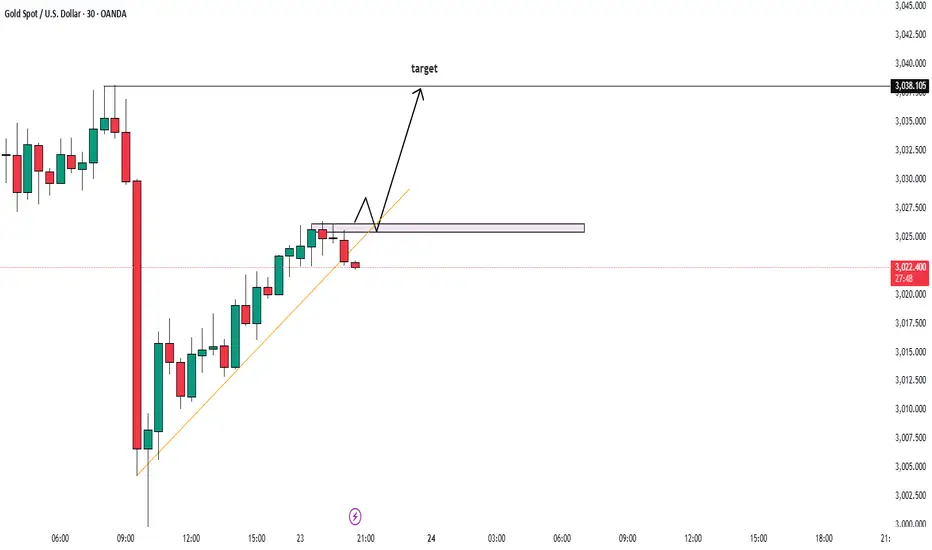
BULLISH MOVEMENT AFTER 3000 LEVEL RETEST ALERT!Hello trader
today market is higher high mark and continue bull pattern and also make a trend line in m30
so we wait to break and test for change the trend wanna gold see 4 Time tap and go for BUY
and trend also bullish so going with bull bias
key level for target 3045 and 3060
Lingrid | GOLD Weekly Price Action ForecastWe had another bullish week, marking the third consecutive week of gains. OANDA:XAUUSD market dropped and tested Tuesday's low, with the weekly candle closing near the 50% weekly range. Despite this, we still have a bullish candle and a higher close above the previous week's high level, demonstrating market dominance. This week, the market cleared above the 3000 level, and the chance of further upward movement seems quite high next week, especially if the market gaps up at the opening.
On the daily timeframe, Friday's candle is bearish; however, it recovered by rebounding and closed near the 50% mark of Friday's range as well. Looking at the price action, the recent pullback is similar to what we saw at the beginning of this month, where price made a 1.70% pullback before continuing to push higher. This time we have a 1.90% pullback, suggesting continuation is expected. We have high-impact news that will influence the price, therefore we should stay vigilant. I think gold could be volatile next week; however, every pullback might present an opportunity to go long as well.
Traders, If you liked this educational post🎓, give it a boost 🚀 and drop a comment 📣

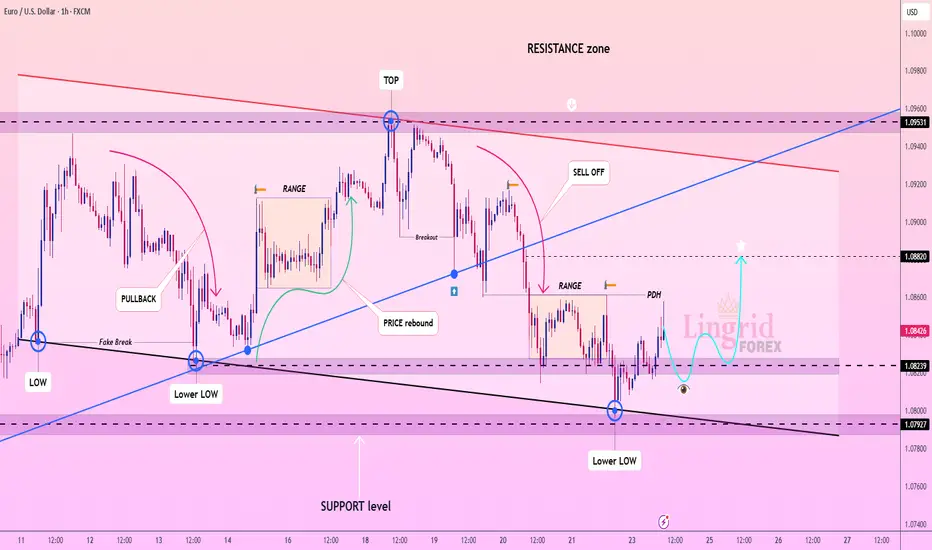
Lingrid | EURUSD trading OPPORTUNITY in Sideways TrendFX:EURUSD market continues to consolidate below the November 2024 low. Recently, the price made a fake breakout of both the recent support level and last week's low. Following a strong bullish move, the price action is likely to move sideways for an extended period. Currently, the price is testing the previous day's high, and if upcoming news doesn't negatively impact the market, we may see a push to higher levels after multiple fake breakouts of the support levels. I expect the market to continue moving sideways until it breaks above or below last week's range. My goal is resistance zone around 1.08820
Traders, If you liked this educational post🎓, give it a boost 🚀 and drop a comment 📣
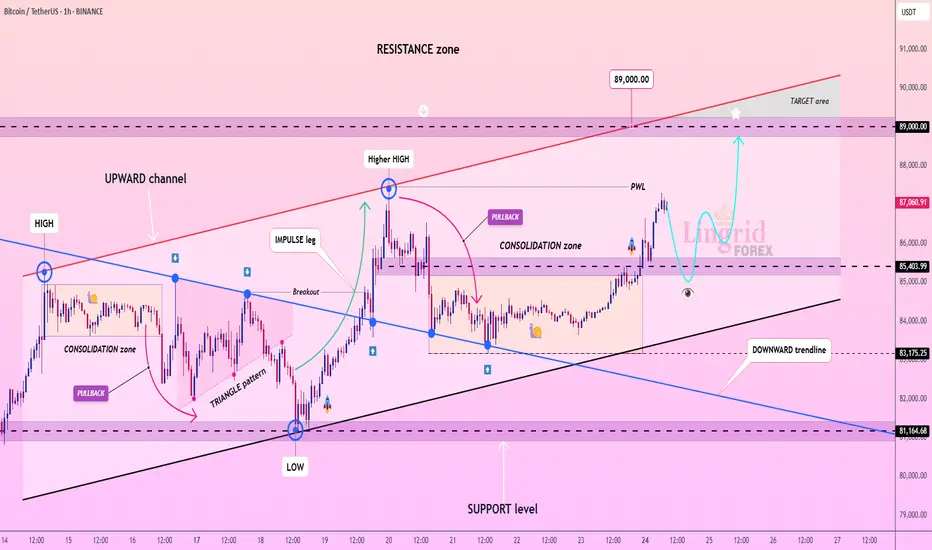
Lingrid | BTCUSDT buy POTENTIAL on Short-Term ChartThe price perfectly fulfilled my last idea . BINANCE:BTCUSDT market is showing an upward trend on the 1H timeframe with higher highs and higher lows. Recently, it broke through the downward trendline and extended upwards, currently testing last week's high, where a potential pullback may form. However, when we zoom out, we can see that the price is forming an ABC pattern aimed at the psychological level of 90,000. It is possible that the price could range around this level before moving higher since the markets tend to consolidate around key level before breakout. Unless unexpected events drive the market lower, I think that with the current momentum, the price is likely to retest the area above the 90,000 mark. My goal is resistance zone around 89,000
Traders, If you liked this educational post🎓, give it a boost 🚀 and drop a comment 📣
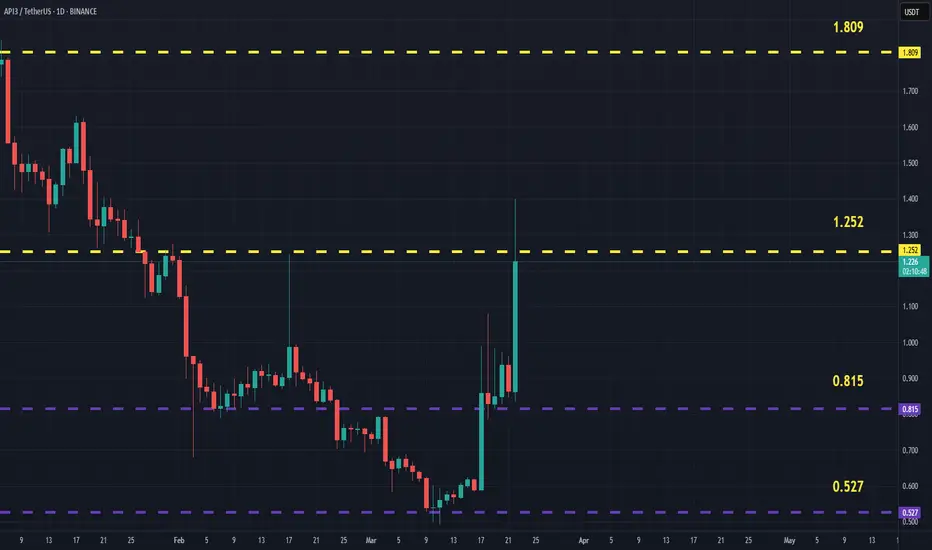
API3USDT(Api3) Updated till 22-03-25API3USDT(Api3) Daily timeframe range. PA having a continuous pullback from its new low. 1.252 is recent resistance if it can get valid close above it, it got long way to go. local support at 0.815 if it dont breaks it will push back.
Lingrid | HBARUSDT consolidation Before the ExtensionBINANCE:HBARUSDT price is currently consolidating below the psychological level at 0.2000. On the daily timeframe, it's evident that the price continues to test the support zone around 0.1700, indicating a potential breakdown of that zone and further downward movement. Additionally, the formation of an ABC corrective move suggests that the C wave may complete around the 0.1000 support level. As a result, I anticipate the market will break below this support and continue moving lower. My goal is support zone around 0.1600
Traders, If you liked this educational post🎓, give it a boost 🚀 and drop a comment 📣
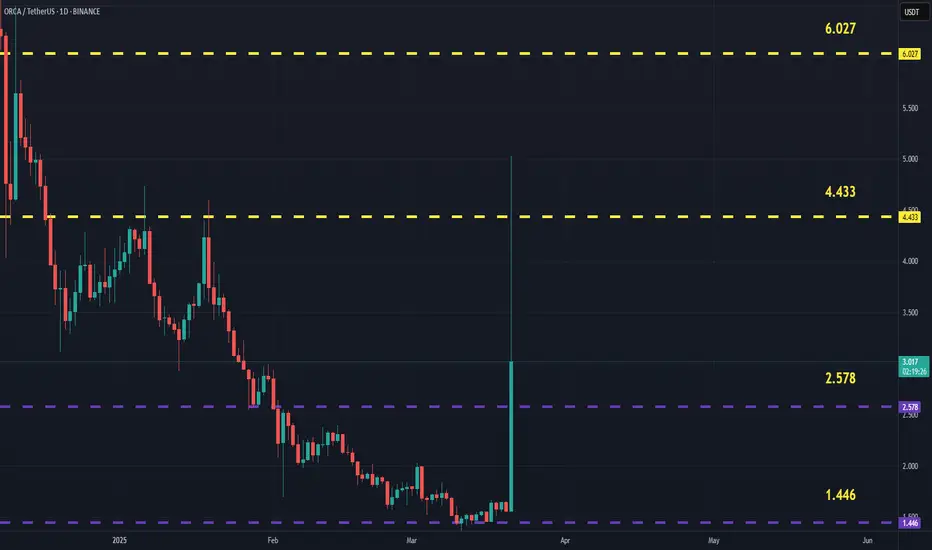
ORCAUSDT(ORCA) Updated till 21-03-25ORCAUSDT(ORCA) Daily timeframe range. we can see a massive pump today, peoples filled their bags. alltho the pump retraced if PA can stay above 2.578 it can pull back to 4.433. local support still at 1.446.
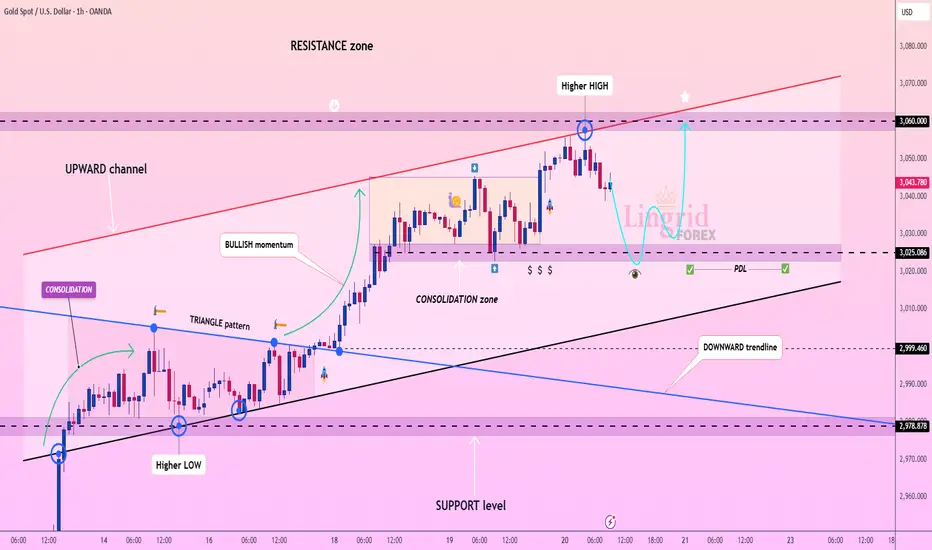
Lingrid | GOLD trend CONTINUATION After a Pullback. LongOANDA:XAUUSD market is continuing to push higher, reaching a potential key level at 3050. Prior to this bullish movement, the price formed a consolidation zone near the previous day low. Today's economic calendar is filled with high-impact news, which may introduce some turbulence in the markets. If the market dips lower, the optimal entry zone could be around the previous day's low, as there is resting liquidity below the consolidation zone and at that level. I expect a pullback toward the support level before the market resumes its bullish trajectory. My goal is resistance zone around 3060
Traders, If you liked this educational post🎓, give it a boost 🚀 and drop a comment 📣
Lingrid | TONUSDT price Deceleration at RESISTANCE ZoneOKX:TONUSDT market surged by 20% following the surprising news that Telegram founder Pavel Durov had regained his passport, allowing him to travel freely. Consequently, the market bounced off the support level and nearly reached the 4.00 resistance zone. However, as it approached this resistance zone, signs indicated a potential pullback; the price has been decelerating and a bearish divergence is evident. Additionally, on the daily timeframe, we observe candles with wicks indicating rejection. Therefore, I expect the market may form a short corrective move toward the support level. My goal is support zone around 3.330
Traders, If you liked this educational post🎓, give it a boost 🚀 and drop a comment 📣

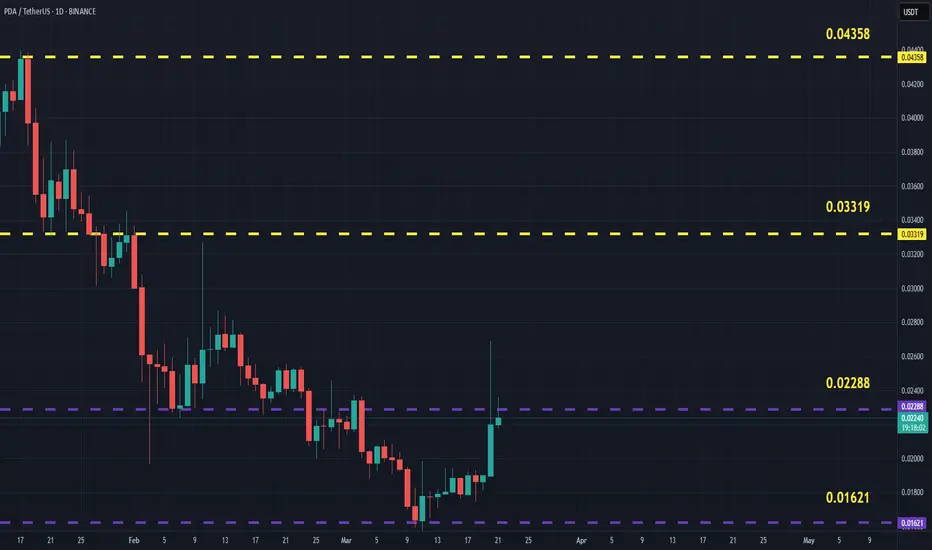
PDAUSDT(PlayDapp) Updated till 21-03-25PDAUSDT(PlayDapp) Daily timeframe range. PA is in its lowest low zone. if PA dont have devs backup it solely depends on market maker thats just sad. thats how it creates new low. recent resistance at 0.02288 if there is a retest it will happen above it.
Lingrid | BTCUSDT price Compression FIRST, Expansion NEXTThe price perfectly fulfilled my last idea . It hit the target level. BINANCE:BTCUSDT market is consolidating above the 80,000 level after breaking below the February low. Recently, a large weekly doji candle has formed, indicating a sideways movement. Currently, the price is trading within this week's range. Looking at the broader picture, we can see that the price action is narrow, and the market is creating a falling wedge pattern. Since the market is consolidating below the downward trendline, I anticipate a breakout above it, which would likely lead to further extension. If the price closes above the last week's high, we could see the formation of a solid inverse head and shoulders pattern in the market. My goal is resistance zone around 88,000
Traders, If you liked this educational post🎓, give it a boost 🚀 and drop a comment 📣

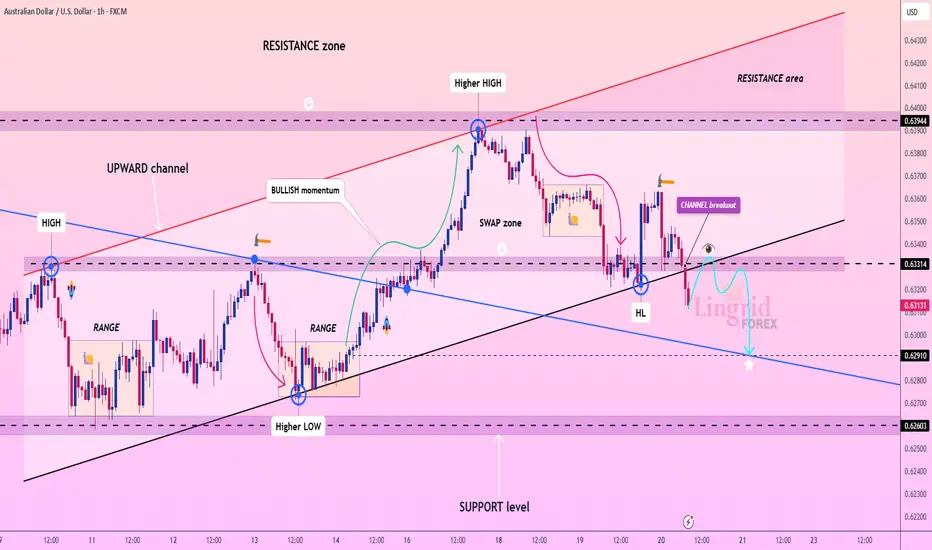
Lingrid | AUDUSD breaks the UPWARD channel. Potential ShortFX:AUDUSD market broke and closed below the upward channel following a bullish momentum, and the price has also fallen below the swap zone where it previously bounced twice. On the daily timeframe, the market appears bearish, indicating potential further declines due to prevailing bearish dominance. A shift in market structure is evident, with price making lower lows and breaking below previous higher low. Unless upcoming news positively influences the market, I think the price will likely continue to move lower. My goal is support zone around 0.62910
Traders, If you liked this educational post🎓, give it a boost 🚀 and drop a comment 📣
Lingrid | AVAXUSDT reached WEEKLY high. ShortThe price perfectly fulfilled my previous idea . It hit the target level. BINANCE:AVAXUSDT has gradually climbed higher after bouncing off a key support level and is currently testing the previous week's high, which has been respected multiple times. Furthermore, it continues to respect the upward trendline. However, on higher timeframes, the market remains heavily bearish, with prices dipping below the August low of 2024. Following such a significant bearish movement, the price will likely consolidate for a period. I expect a rebound from the psychological level at 20, followed by a retest of the support level. My goal is support zonearound 17.05
Traders, If you liked this educational post🎓, give it a boost 🚀 and drop a comment 📣

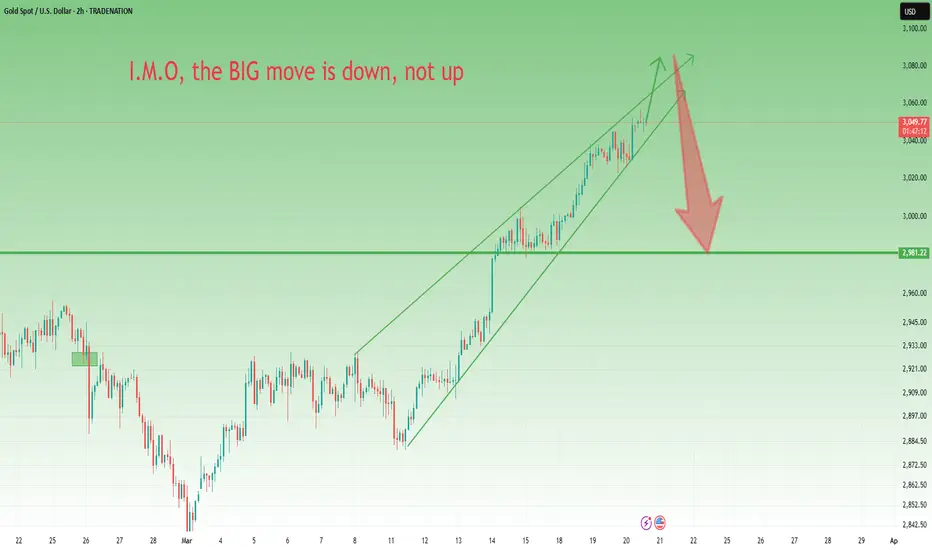
Gold- I'm looking to sell for 500+ pips targetAs I explained before, when I trade TRADENATION:XAUUSD , I aim for targets of 400-500 pips , sometimes even more. That’s why I always try to determine where "the BIG move" is. In Gold’s current situation, I believe this move is down, not up (though, of course, I don’t have a crystal ball).
Let me explain...
Since the beginning of March, Gold has surged by more than 2000 pips. While we need to adjust our pip calculations given Gold’s current price levels , this is still an enormous rise. More importantly, out of these 2000 pips, 1700 were gained just since last Wednesday. This makes a correction highly likely, especially considering that if we look at the chart, we see almost no pullbacks in the past week—only a consolidation in a rectangle.
From a technical standpoint, the trend is undoubtedly up. However, even if Gold drops to 2990, the overall uptrend would still remain intact. Additionally, looking at the chart, we can spot a rising wedge—typically a reversal pattern.
My Take:
Currently, I’m out of the market, but I expect a strong correction of 500+ pips. I’m looking to sell if there’s an upward spike followed by signs of exhaustion.
Conclusion:
In my opinion, "the big move" is down, not up. I expect Gold to drop below 3000 and at least test the 2990 zone.
Disclosure: I am part of Trade Nation's Influencer program and receive a monthly fee for using their TradingView charts in my analyses and educational articles.
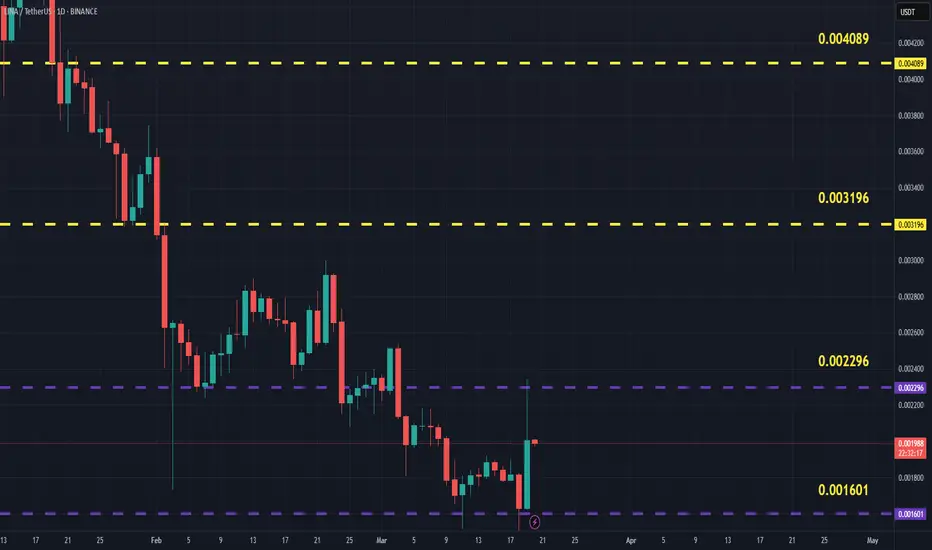
LINAUSDT(LinearFinance) Updated till 20-03-25LINAUSDT(LinearFinance) Daily timeframe range. PA is in trouble zone it did build a recent support at 0.001601. but it needs to stay above 0.002296 to get out of trouble zone and for pullback. above 0.002296 you got safer and rewarding setups.
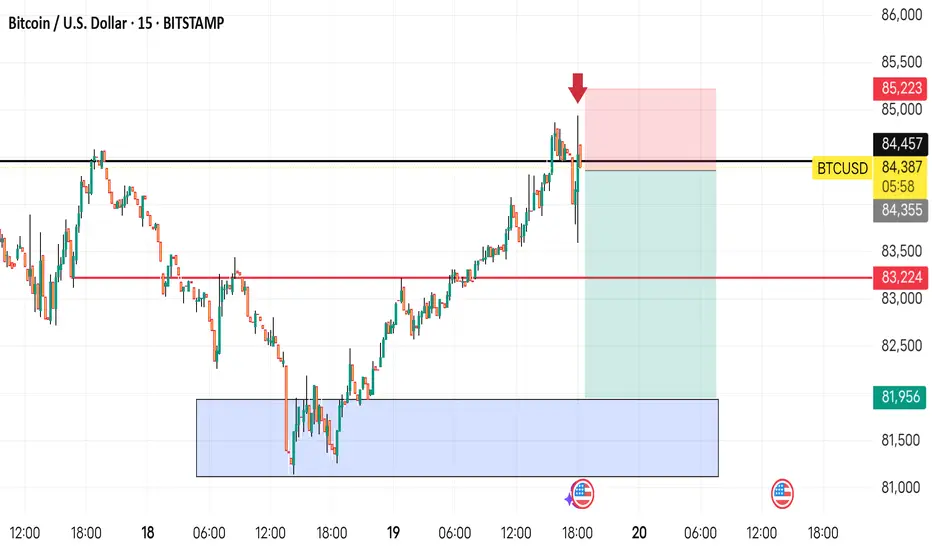
BTCUSD 15MINUTES. SHORT TRADE SETUP, CHECK CAPTAIN..This is a Bitcoin (BTC/USD) 15-minute chart from TradingView, showing a trade setup. Here’s what it means:
1. Resistance Level (Black Line at $84,355-$84,457): Price tested this zone but failed to break above it.
2. Short Trade Setup:
The red arrow indicates a sell entry at the resistance level.
The red box above represents the stop-loss area ($85,223), meaning if the price moves above this, the trade would be invalidated.
The green box below is the take-profit area, with a target around $81,956.
3. Price Rejection: BTC/USD attempted to break resistance but was rejected, suggesting a potential move lower.
4. Liquidity Zone (Blue Box): A previous demand zone where buyers stepped in, indicating a possible support level.
Overall, this chart suggests a bearish trade setup, where the trader expects Bitcoin to decline from the resistance zone.
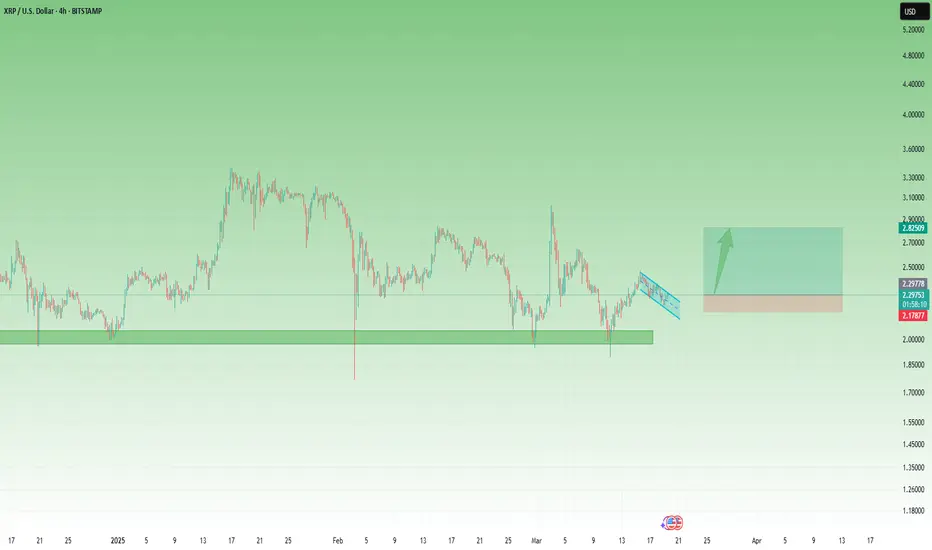
XRP’s Bullish Setup: Why I’m Targeting $3 with a 1:4 Risk-RewardAfter its recent impressive rally to $3, XRP has shown remarkable resilience during the correction, establishing a strong support level around the $2 mark.
Despite the broader downturn in the crypto market, XRP has held up well, demonstrating significant strength.
Last week, XRP tested this $2 support level once again and rebounded, reinforcing its stability. The current price action is shaping a bullish flag pattern, which suggests that a new upward move could be on the horizon.
With this in mind, I am looking to buy XRP, anticipating a potential breakout.
Given my target of around $3, I am aiming for a 1:4 risk-reward ratio for this trade
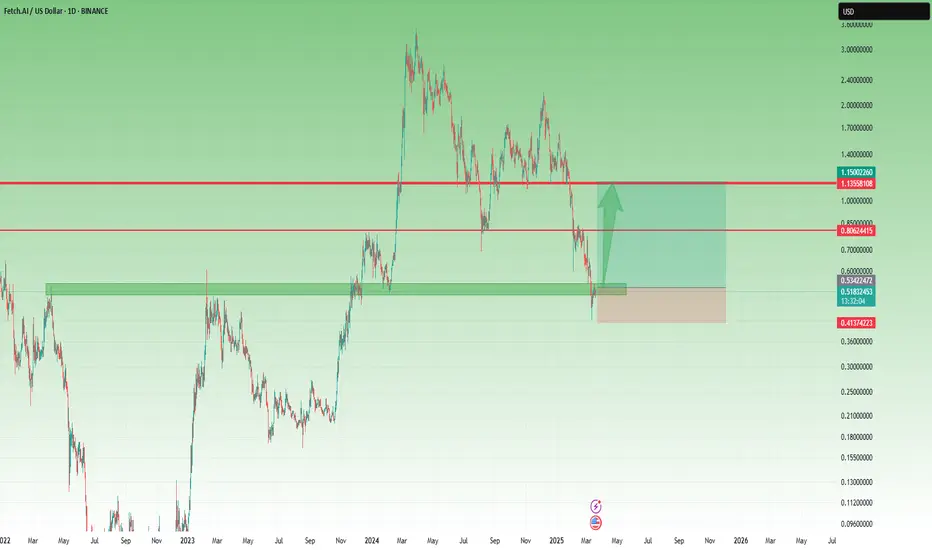
After an 80% Drop, Is FET Finally Ready to Reverse?Exactly one year ago, FET reached its all-time high of $3.5, but since then, it has experienced a steep decline of over 80%.
However, the coin has recently found strong technical support around the $0.45 zone, which, in my view, signals a potential rebound on the horizon.
Currently, FET is trading near $0.52, and from a psychological standpoint, being around a key round number and its Binance listing price, we could see a bounce from these levels.
With this in mind, I anticipate a trend reversal, with an initial target of $1 in the near future. Additionally, $0.80 stands as a significant resistance level and could serve as an interim target before further upside movement.
From a risk-reward perspective, this setup offers an attractive 1:5 ratio