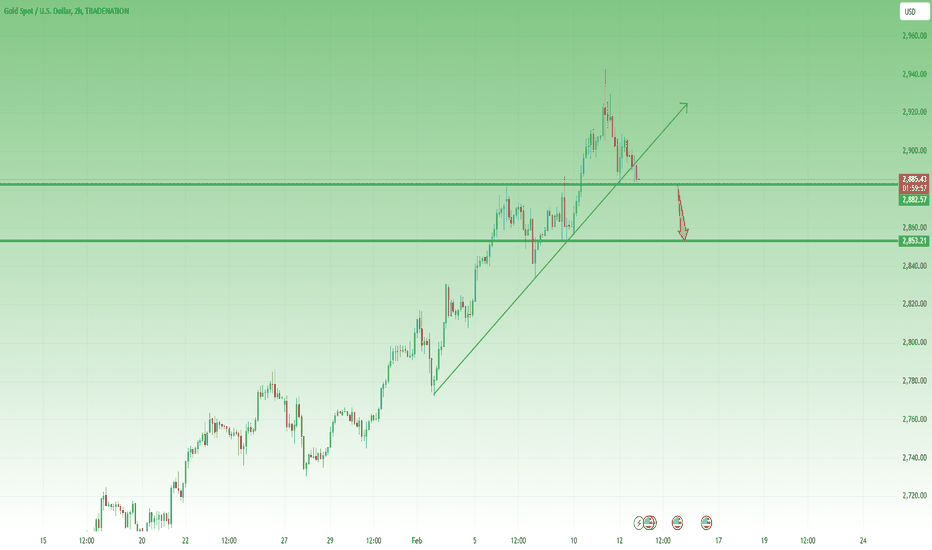
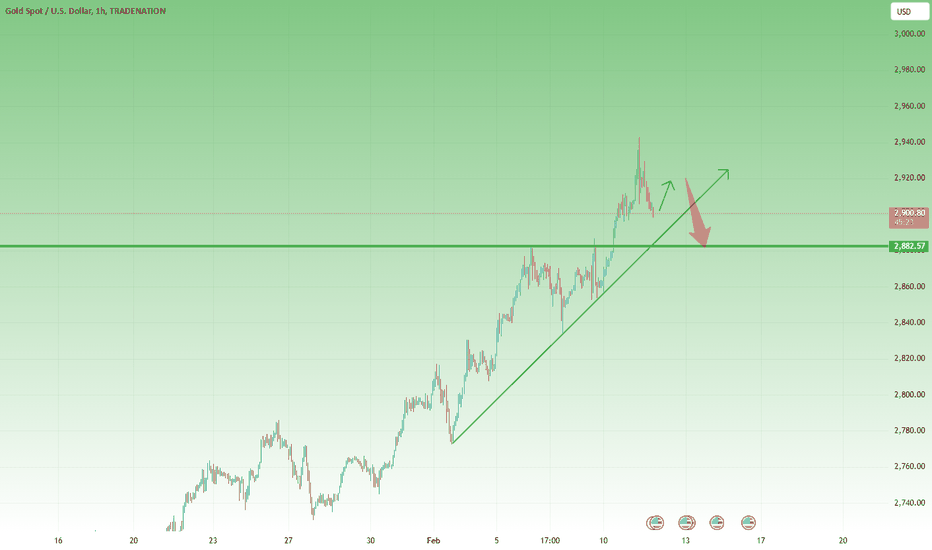
Gold Price Analysis: Is a Deeper Pullback Coming?Since the beginning of the week, I have been writing that although the overall trend remains bullish, Gold is due for a correction.
Indeed, after a blow-off top to a new all-time high of 2943, the price started to decline and reached the confluence support zone at 2885.
At the time of writing, the price has returned to this support level, and there is a high probability of a break below this level, leading to a continuation of the correction.
In such a scenario, traders could anticipate a test of the 2840 support zone.
My strategy is to look for selling opportunities on rallies above 2900.
Disclosure: I am part of Trade Nation's Influencer program and receive a monthly fee for using their TradingView charts in my analysis.
Signalservice
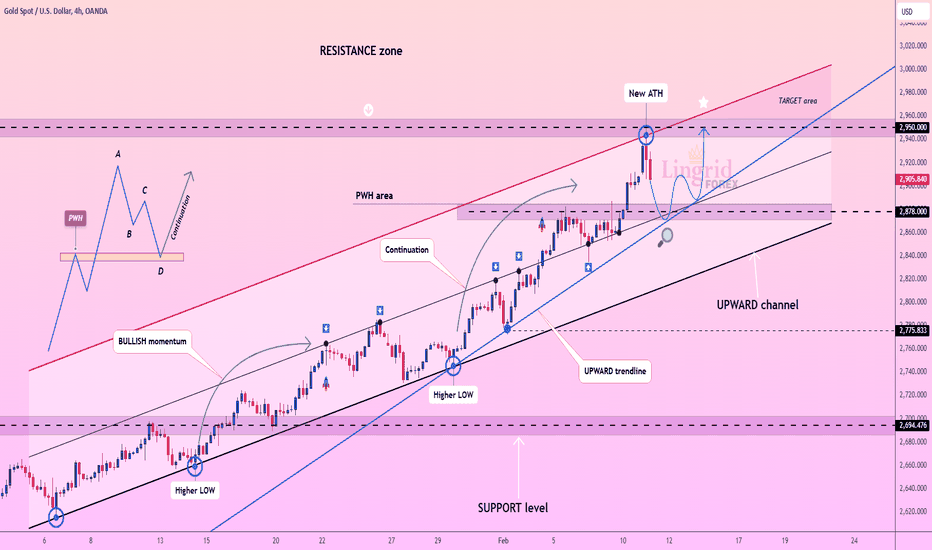
Lingrid | GOLD capitalizing on the PULLBACK. Potential LONG The price has perfectly fulfilled my previous forecast . It quickly reached the target zone, surging and testing the area just below the next key resistance level above. The rapid pullback from the resistance suggests that we might be experiencing a buying climax. Nevertheless, the market is forming an ABCD pullback, with completion point potentially aligning with the previous weekly high. This area could present an opportunity to go long in anticipation of a retest of the recent resistance zone. However, with Fed Chair Powell's testimony coming up, there’s a possibility the price could dip even lower, reaching around 2825. If we see a rejection at the support zone 2870 - 2880, we can expect a continuation of the prevailing trend. My goal is resistace zone around 2950
Traders, if you liked this idea or if you have your own opinion about it, write in the comments. I will be glad 👩💻
Lingrid | GBPAUD pullback - CONTINUATION tradeFX:GBPAUD is currently making lower lows, indicating a bearish trend. The market broke and closed below the range zone, which further reinforces the bearish outlook. Additionally, the price tested the resistance zone twice before breaking through it; creating equal high level. The price is currently above the previous day's high, but there is a chance it could pull back below. This pullback could present a good opportunity to short the market, anticipating further downward pressure. My goal is support zone around 1.97240
Traders, if you liked this idea or if you have your own opinion about it, write in the comments. I will be glad 👩💻
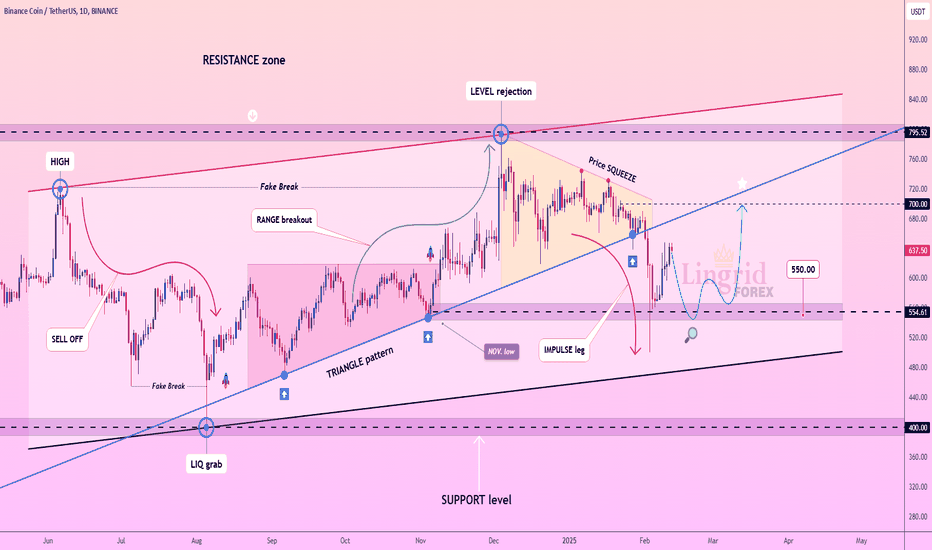
Lingrid | BNBUSDT false Breakout of November Low. LongBINANCE:BNBUSDT market saw a price squeeze and subsequently dropped below the November low. However, the price also made a false breakout by taking liquidity below that level. Additionally, it broke and closed below the upward trendline that has been supporting the price since August. This breakout may indicate a sideways movement. I believe the price could establish a range zone, as we observed similar price action in this area last year, from September to November. I expect that the market will enter an accumulation phase around this zone, potentially followed by a bullish move. My mid-term goal is resistance zone around 700
Traders, if you liked this idea or if you have your own opinion about it, write in the comments. I will be glad 👩💻
Lingrid | GBPUSD buying Opportunity at KEY Support LevelAs the FX:GBPUSD market approaches the support level, it is showing signs of deceleration, with bearish momentum fading. The psychological level below at 1.23000 has previously acted as a strong support, with the price bouncing off it multiple times. On the higher timeframes, we can see the formation of an ABCD pullback, where point D aligns perfectly with the support level. I anticipate that the price will bounce off this support level and subsequently retest the supply zone above. My goal is resistance zone around 1.24180
Traders, if you liked this idea or if you have your own opinion about it, write in the comments. I will be glad 👩💻
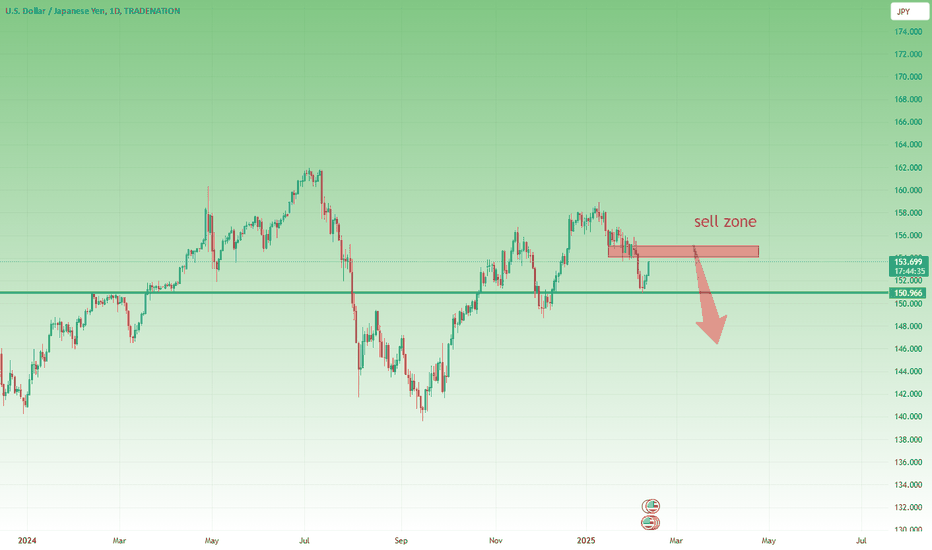
USD/JPY Trading Plan: Resistance in Focus Before the Next DropSince the beginning of the year, USD/JPY has been in a bearish trend, with the price dropping from 159 to 151.
After reaching support around the 151 zone following Friday's NFP, the price started to reverse upward and is currently trading at 153.63.
In my view, this is just a correction of the initial leg down, and once resistance is reached, the price is likely to resume its downward trend.
The sell zone starts above 154 and extends to 155, where I will be looking for selling opportunities.
In the medium term, the price could drop to 146, with the first major support at the recent low of 151.
Disclosure: I am part of Trade Nation's Influencer program and receive a monthly fee for using their TradingView charts in my analysis.
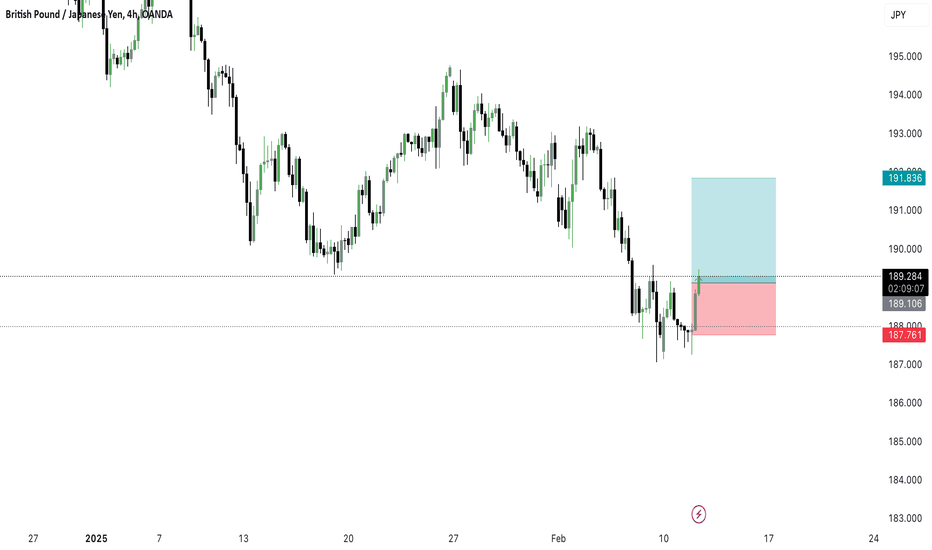
GBPJPY TRADE DON'T MISS THIS OPPORTUNITY 📈 GBP/JPY Buy Setup - 4H Analysis 🚀
I'm currently looking at a potential bullish move on GBP/JPY based on recent price action. The pair has been in a downtrend but has found support around 188.00-188.50, showing signs of reversal.
🔹 Entry: Around 189.10-189.30
🔹 Stop Loss: 187.76 (Below recent lows)
🔹 Target: 191.83 (Previous resistance level)
🔍 Analysis Breakdown:
✅ Price has rejected a key support zone, indicating potential upside.
✅ Bullish momentum is forming with higher lows on lower timeframes.
✅ Risk-to-reward ratio is favorable, aiming for a 2:1+ setup.
I'll be monitoring this trade closely. Let me know your thoughts! 📊📢
#GBPJPY #ForexTrading #PriceAction #TradingView #ForexSignals #FXAnalysis 🚀💹
Blow-Off Top? Why I’m Selling Gold Rallies AgainIn my analysis yesterday, I mentioned that Gold could be due for a correction and suggested selling rallies.
Unfortunately, my sell position from 2905 hit the stop loss, and Gold went on to reach a new all-time high.
However, this appears to be a blow-off top, which could signal the start of a real correction phase.
With this in mind, I will look to sell rallies again, targeting the 2885 confluence support level.
Disclosure: I am part of Trade Nation's Influencer program and receive a monthly fee for using their TradingView charts in my analysis.
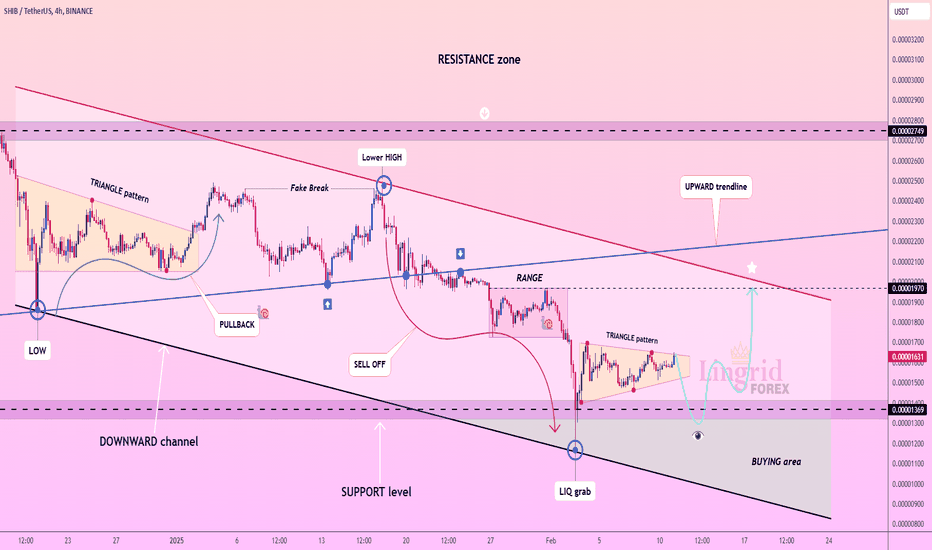
Lingrid | SHIBUSDT potential BULLISH Momentum is BuildingThe price has perfectly fulfilled my previous forecast . BINANCE:SHIBUSDT market has broken through the range zone, initiating an impulse move and subsequently forming a new range zone in the shape of a triangle pattern. This squeeze suggests that an expansion is imminent. Currently, I think the market is in the accumulation phase around the level of 0.000015. We observed a significant long-tailed bar that rejected the support level, which indicates a strong buying zone. I anticipate that the market to pull back towards this support level before moving upward, provided we see a buy confirmation. My goal is resistance zone around 0.00001970
Traders, if you liked this idea or if you have your own opinion about it, write in the comments. I will be glad 👩💻
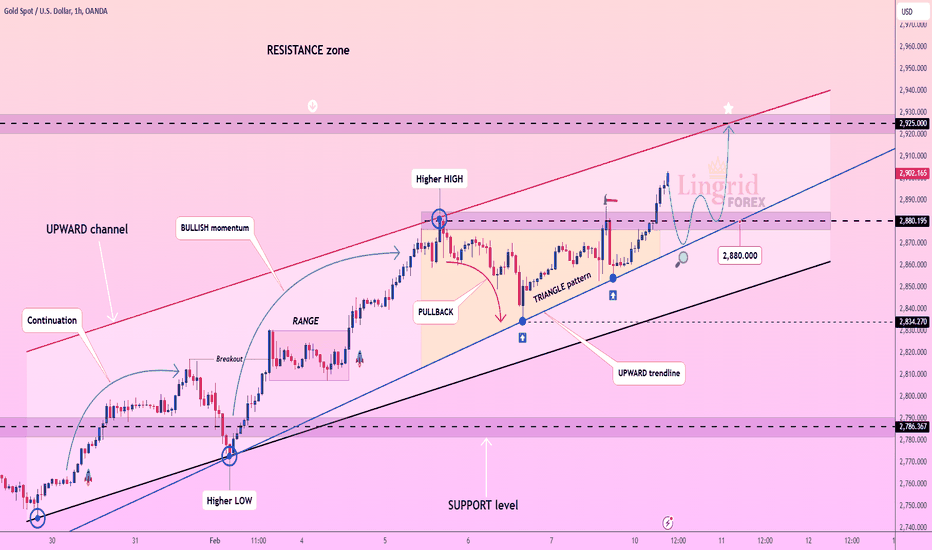
Lingrid | GOLD testing the Crucial 2900 Level. Potential LongThe price has perfectly fulfilled my previous forecast . The market surged straight up and reached the psychological level at 2900 without any pullback. On the 1H timeframe, a trend continuation pattern—a triangle—formed before the market moved higher. Additionally, the price broke and closed above last week's high. As the market tests this key level, we may see increased volatility in this area. If the price makes a pullback toward the support level, there is a strong opportunity to go long, with the potential for the price to continue moving upwards. My goal is resistance zone around 2925
Traders, if you liked this idea or if you have your own opinion about it, write in the comments. I will be glad 👩💻
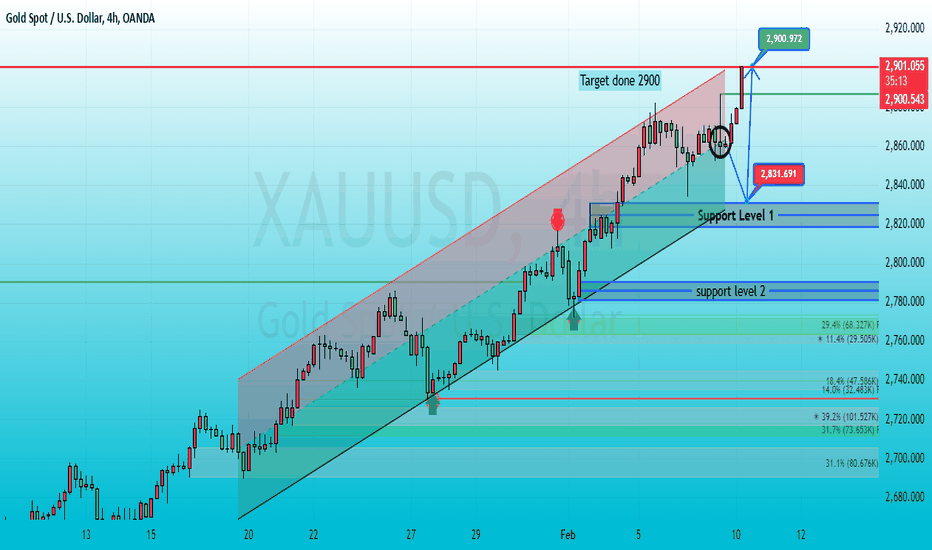
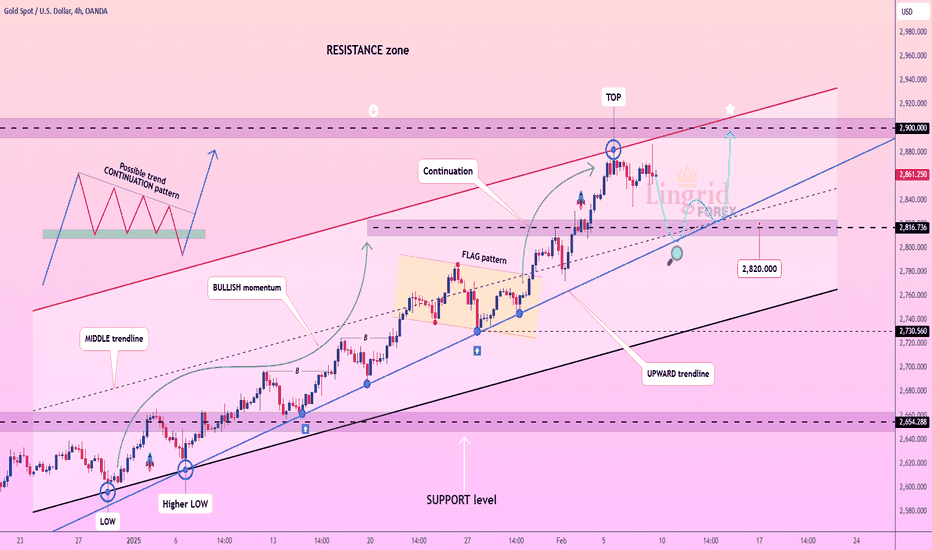
Gold is flying up strong buythe price action of Gold (XAU/USD) on a 4-hour timeframe, with the price hitting the target of 2,900 as indicated. The market is currently in an uptrend within an ascending channel, with potential for further movement towards2,900.972. Key support levels are located at 2,831.691 and lower around2,780. Fibonacci retracement levels highlight areas of interest for possible retracements. The chart suggests that the bullish trend could continue if the price holds above support
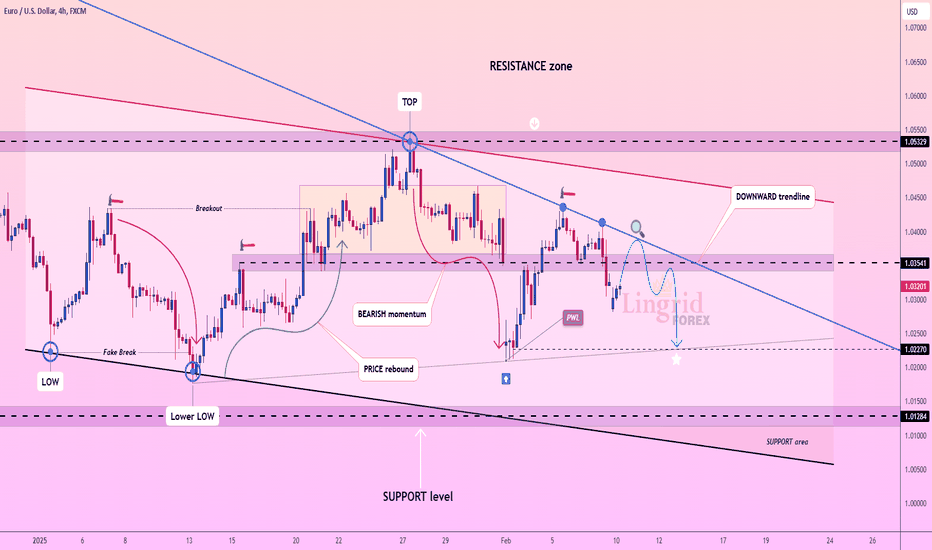
Lingrid | EURUSD forming a Triangle Pattern. ShortFX:EURUSD continues to consolidate around 1.0300 level. Recently, the market gapped down again, but that gap has already been filled. Last week, the price declined following a news release, respecting the downward trendline and breaking below the 1.03500 level. Overall, the price is forming a triangle pattern, forming lower highs and higher lows. Given that the market has bounced off the upper boundary of the pattern, I anticipate it may retest the lower boundary. I expect the market to reject the resistance and subsequently retest last week's low. My goal is support zone around 1.02270
Traders, if you liked this idea or if you have your own opinion about it, write in the comments. I will be glad 👩💻
High Risk Sell Gold OutlookGold started the week by reaching a new all-time high near the 2,900 mark.
However, as I explained in my weekend analysis, while the overall trend remains strongly bullish, I anticipate a pullback to correct the 3,000-pip rally since the beginning of the year.
I am looking to enter a sell position with a tight stop-loss, aiming for a 1:3 risk-reward ratio to justify this high-risk trade.
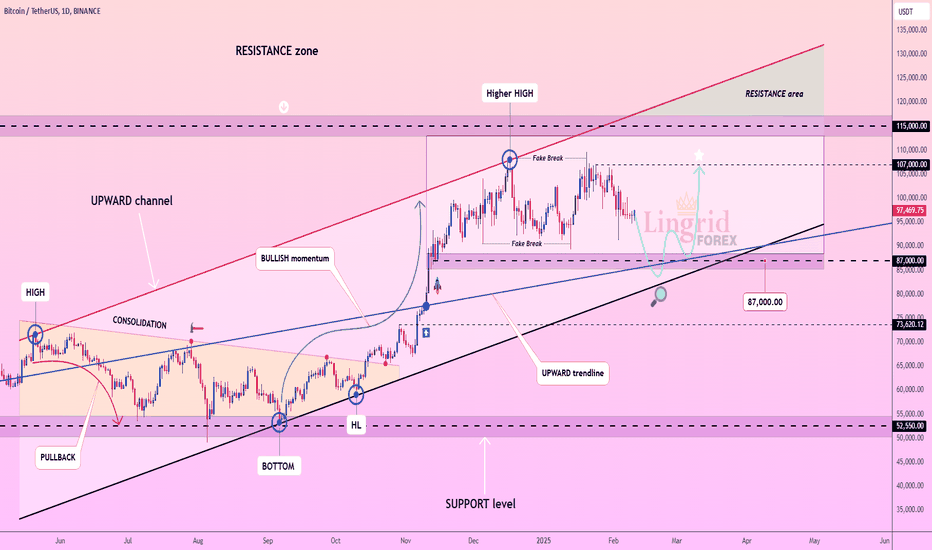
Lingrid | BTCUSDT mid-term PRICE Action PerspectiveBINANCE:BTCUSDT continues to consolidate below the 100,000 level. Over the past couple of days, the market has been printing doji candles, indicating indecision. Following a false break of the resistance zone, the market is now moving sideways. When we take a step back, we can see that the price has not achieved a 1/3 correction of the bullish move that occurred from August 2024 to January 2025. I believe the market will likely continue this sideways movement and may retrace to the area below 90,000 before rising to higher levels. A deeper pullback would be beneficial for the market, as it would create an opportunity to move to those higher levels. My mid term goal is resistance zone around 107,000
Traders, if you liked this idea or if you have your own opinion about it, write in the comments. I will be glad 👩💻
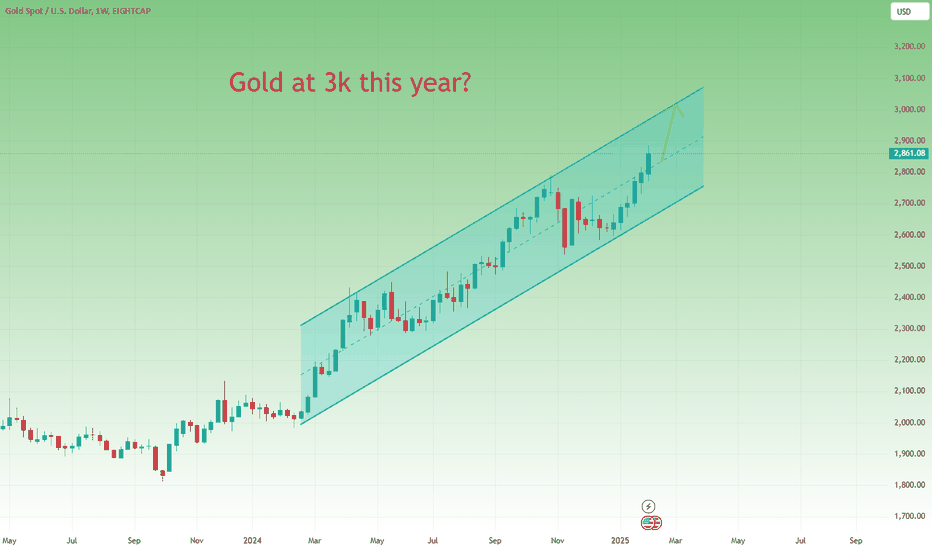
Gold’s Next Big Move: Rally to $3K or a Sharp Pullback?The big question on everyone’s mind is whether FOREXCOM:XAUUSD will reach $3,000 in 2025. In my opinion, it probably will.
Looking at the weekly chart, gold has been trading in a well-defined ascending channel for exactly a year. Each time the price dips near the trendline support, buyers step in, keeping the uptrend intact. The last time this happened was at the start of the year, and since then, gold has climbed more than 2800 pips from its low to its Friday's ATH.
With this in mind, we can reasonably expect Gold to maintain its bullish trajectory— an assumption supported not only by technical analysis but also by fundamental factors.
________________________________________
📊 Shorter Time Frame: Signs of Exhaustion?
Although the long-term trend remains bullish, trends are not linear—they consist of ups and downs. If we refine our analysis to a shorter time frame, the situation looks a bit different.
• The 4-hour chart still reflects a strong uptrend that began earlier this year.
• However, last week, signs of exhaustion emerged:
- Tuesday’s all-time high of $2,880 was followed by a normal pullback to the $2,840 zone (which I highlighted in last week’s analysis).
- On Friday, a new ATH near $2,890 was reached, but the market saw a sharp reversal after the initial NFP-driven rally, with further weakness into the closing hours.
________________________________________
🔍 Key Levels to Watch:
• Support Levels:
- $2,840–$2,835 (previous support zone)
- $2,800 (psychological level)
- $2,775–$2,760 (deeper retracement area)
• Resistance Levels:
- $2,890 (recent ATH)
- $2,900 (psychological barrier)
- $2,980–$3,000 (major upside target)
________________________________________
🎯 Potential Trade Setups:
✅ Bullish Scenario:
• If Gold holds above $2,840 and rebounds, a breakout above $2,880–$2,890 could drive prices towards $2,900+, with the final target at $3,000.
🚨 Bearish Scenario:
• If gold fails to hold $2,840, a deeper pullback to $2,800–$2,775 is likely.
• A weekly close below $2,800 could trigger an extended correction toward $2,760.
________________________________________
📉 My Strategy for Next Week:
While the long-term uptrend remains intact, I anticipate a short-term correction.
• I will be looking to sell rallies, targeting a pullback toward $2,800 or slightly below.
• If Gold tests key support and shows strength, I’ll switch to a buy-the-dip approach for the next leg higher.
⚠️ Note: This is a high-risk strategy, as we are still in a strong bull market. Proper risk management is essential.
Regards!
Mihai Iacob
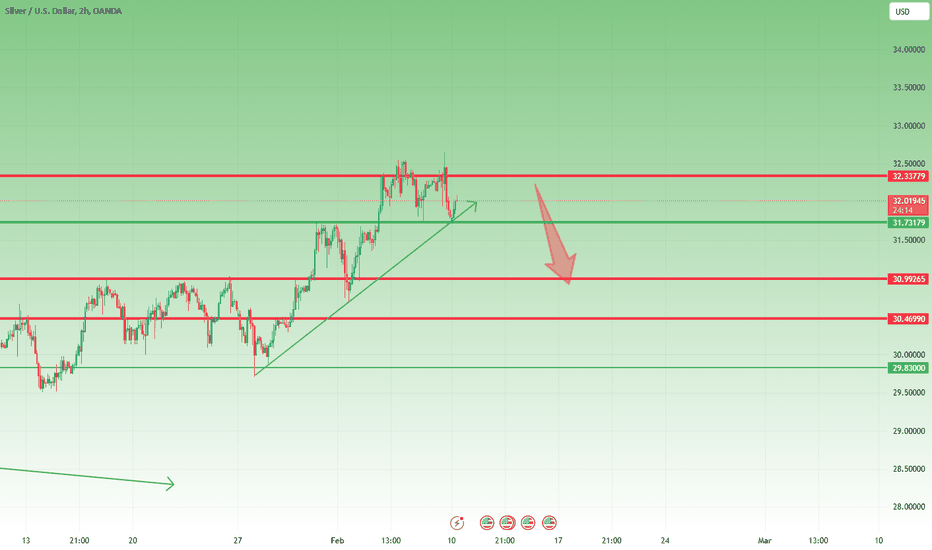
Silver Struggles at Resistance – Bearish Setup in Play?Since reaching the 32.30 resistance zone last Wednesday, OANDA:XAGUSD has been trading in a range-bound consolidation phase.
On Friday’s NFP release, the price spiked back into this resistance area but quickly reversed, closing the day near the 31.70 support level.
Currently, Silver is rebounding once again from this support, which could present a good shorting opportunity for sellers.
My bias is bearish as long as 32.50 resistance holds, and I expect a potential decline toward 31.00 in the near term.
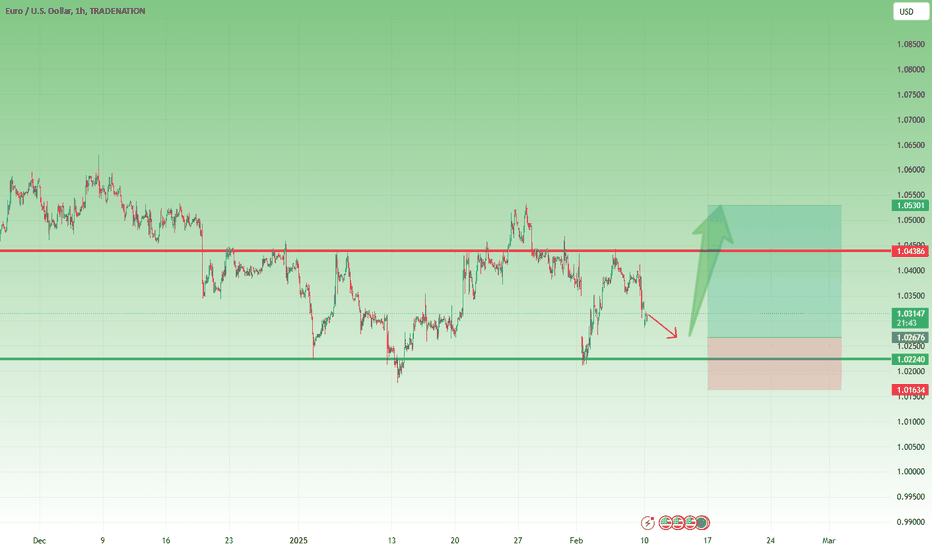
EUR/USD Range-Bound but Ready to Break Higher? Since the beginning of the year, EUR/USD has been trading within a range, fluctuating between 1.0200 and 1.0440, aside from a few temporary spikes in both directions.
While the overall trend remains bearish, I anticipate a relief rally in the near future, which could push the price toward the 1.0650–1.0700 zone in the medium term.
In the short term, the market remains stable, with a strong support base forming around 1.0200. Given this setup, my bias is bullish, and I’m looking to buy dips, targeting 1.0500 as the first key resistance level.
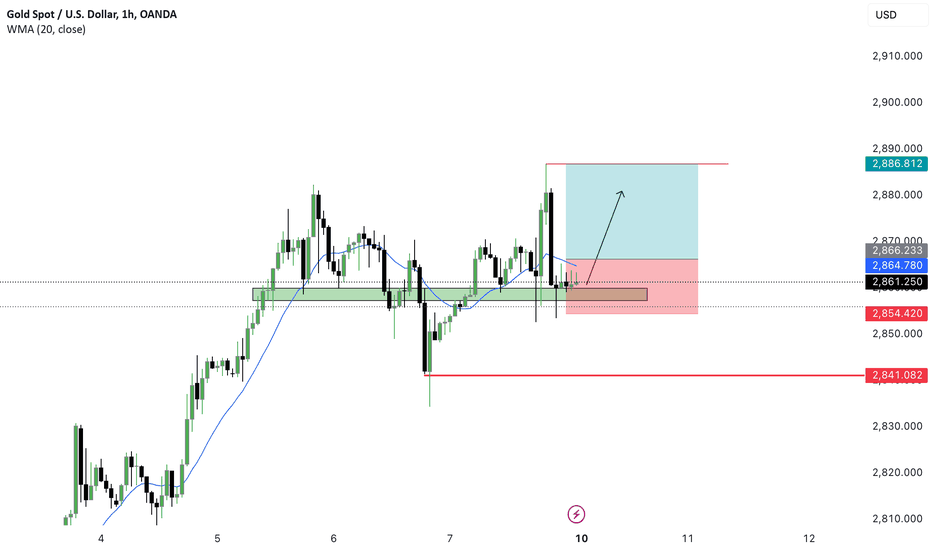
XAUUSD BUY TRADE SIGNAL GOLD ANALYSIS🔹 Current Trend:
Gold has been showing a bullish trend, respecting key support zones while maintaining a higher-low structure. The 20-period WMA (Weighted Moving Average) at 2,864.780 is acting as dynamic support.
🔹 Key Levels:
✅ Support Zone: 2,854 - 2,861 (Marked in Green)
✅ Resistance Zone: 2,886.812 (Marked in Red)
🔹 Trade Setup:
📈 Bullish Scenario:
Price is consolidating at a strong support level and forming a potential higher low structure.
A breakout above the current consolidation could trigger a bullish move towards 2,886.812.
If price holds above the 2,861 zone, this can be a confirmation for further upside movement.
📉 Bearish Invalidations:
A break below 2,854.420 would indicate potential weakness, possibly leading to a move toward 2,841.082.
🔹 Trading Plan:
Buy Entries on confirmation of bullish price action above the support zone.
Stop Loss placed below 2,854 to minimize risk.
Take Profit at 2,886 to capitalize on the potential bullish momentum.
⚡ Are you bullish or bearish on Gold? Drop your thoughts below! ⬇️🔥
#XAUUSD #GoldTrading #ForexTrading #PriceAction #TradeSetup #TechnicalAnalysis
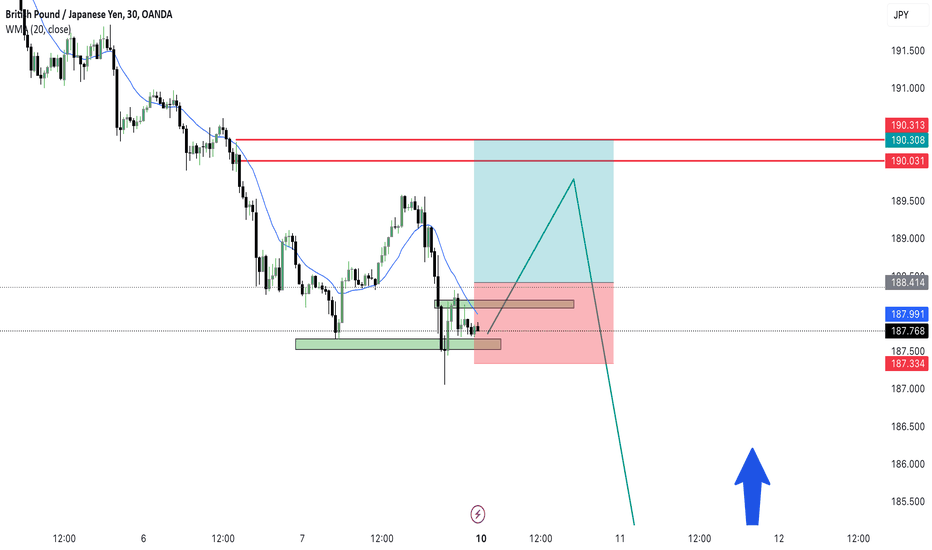
GBPJPY MONDAY TRADE SIGNAL📊 GBP/JPY 30-Minute Chart Analysis
🔹 Current Trend: The market has been in a strong downtrend, respecting the 20-period WMA (Weighted Moving Average) as dynamic resistance.
🔹 Key Levels:
✅ Support Zone: 187.500 - 187.334 (Marked in Green)
✅ Resistance Zones: 188.414 & 190.021 - 190.313 (Marked in Red)
🔹 Trade Setup:
📈 Possible Buy Opportunity:
Price is holding at a key support zone, showing potential for a short-term retracement towards the resistance level at 188.414 or even 190.021 before continuing lower.
A break & retest of the small resistance zone (marked in brown) could confirm a bullish move.
📉 Overall Bearish Bias:
If price reaches the higher resistance zone (190.021 - 190.313), it may create a strong selling opportunity.
A rejection from resistance could trigger a continuation of the downtrend, targeting new lows below 187.000.
🔹 Trading Plan:
Short-term traders can look for buy scalps towards resistance.
Swing traders should wait for a liquidity grab near resistance before entering a sell position targeting 186.500.
📌 Watch for confirmations like:
✅ Bullish rejection candles at support
✅ Break & retest of the marked zones
✅ Price action signals at resistance
⚡ What’s your bias on GBP/JPY? Bullish or Bearish? Drop your thoughts in the comments! ⬇️🔥
#GBPJPY #ForexTrading #MarketAnalysis #PriceAction #TradeSetup
Lingrid | GOLD Weekly Price Action AnalysisOANDA:XAUUSD market shows strong bullish momentum, with a streak of 6 consecutive weekly bullish closes and a +4% gain this week. The price is pushing higher, but has yet to reach the 2900 level, which may lead to a period of consolidation below this level or deep pullback. Markets often consolidate below or above strong levels before breaking through them.
On the daily timeframe, a pinbar has formed, indicating potential level rejection and a possible correction. The double top pattern suggests a pause in the bullish momentum, and the fake breakout of the previous resistance zone further supports this view. Given these signs of a pullback, it's likely that the market will form a trend continuation pattern, such as a triangle.
If a pullback occurs, the support area between the January high and last year's high would be a great spot to consider a long trade. This area provides a strong foundation for a potential bounce, making it an attractive entry point for a long position. Overall, I expect the market to pull back before potentially continuing its upward movement, as long as the price action supports this scenario.
Traders, if you liked this idea or if you have your own opinion about it, write in the comments. I will be glad 👩💻
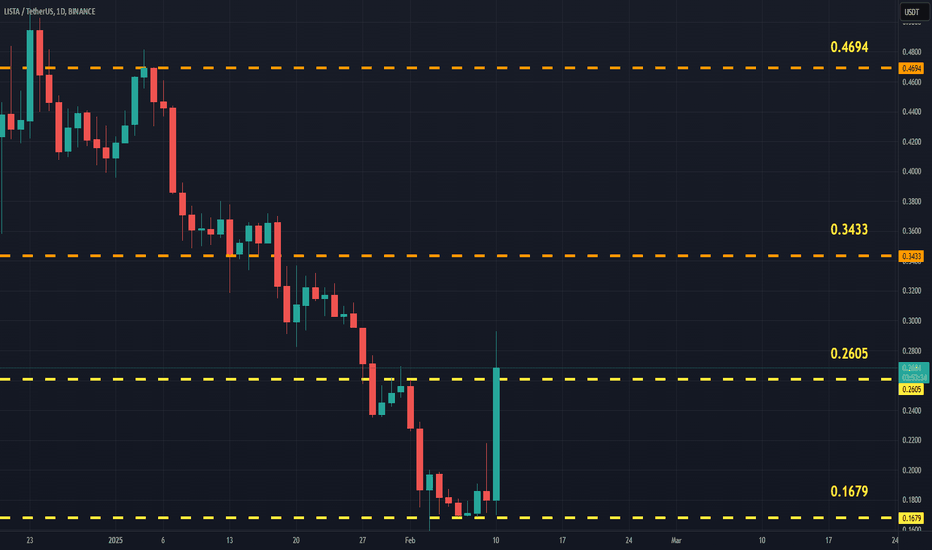
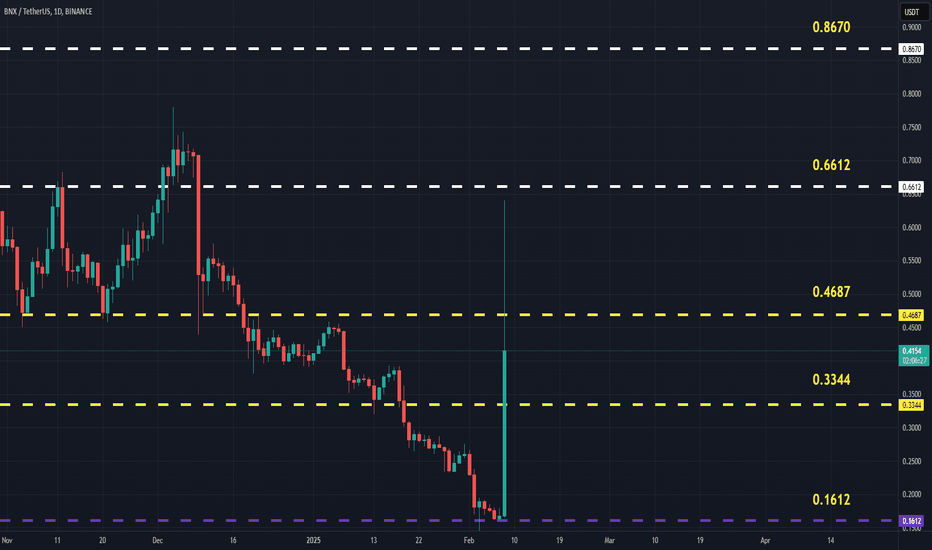
BNXUSDT(BinaryX) Updated till 08-02-25BNXUSDT(BinaryX) Daily timeframe range. massive retrace from its old low. over 280%+ move within single day thats pretty impressive. it got long way to go. for now if it can stay above 0.3344 it will retrace back to 0.4687.
