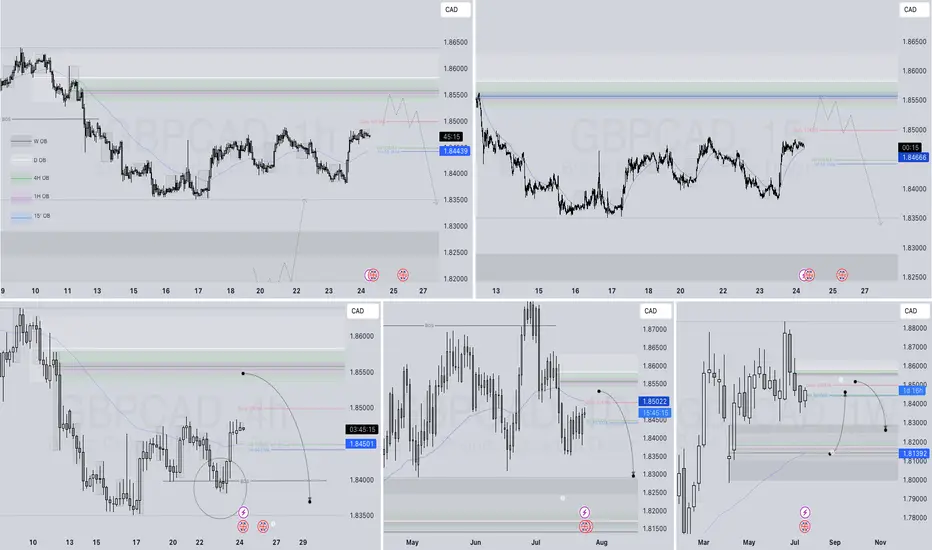
GBPCAD Q3 | D24 | W30 | Y25📊GBPCAD Q3 | D24 | W30 | Y25
Daily Forecast🔍📅
Here’s a short diagnosis of the current chart setup 🧠📈
Higher time frame order blocks have been identified — these are our patient points of interest 🎯🧭.
It’s crucial to wait for a confirmed break of structure 🧱✅ before forming a directional bias.
This keeps us disciplined and aligned with what price action is truly telling us.
📈 Risk Management Protocols
🔑 Core principles:
Max 1% risk per trade
Only execute at pre-identified levels
Use alerts, not emotion
Stick to your RR plan — minimum 1:2
🧠 You’re not paid for how many trades you take, you’re paid for how well you manage risk.
🧠 Weekly FRGNT Insight
"Trade what the market gives, not what your ego wants."
Stay mechanical. Stay focused. Let the probabilities work.
FRGNT
Signalservice
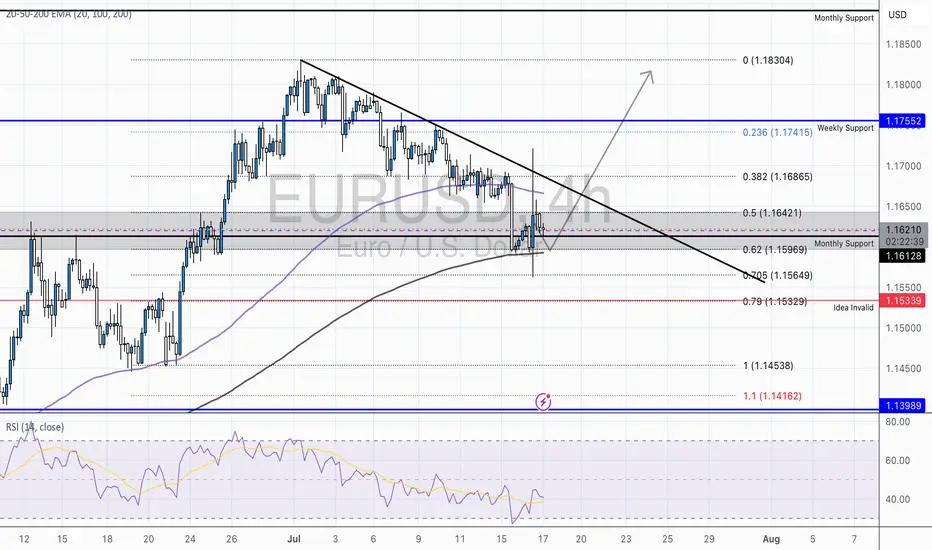
EUR/USD - Holding Bullish Structure Above Key Fibs and TrendlineTechnical Overview:
EUR/USD continues to respect its ascending channel structure, currently rebounding from the lower trendline support while trading above the 50 EMA and 200 EMA. After a healthy retracement to the monthly support (1.16128), the pair has shown strong buying interest, supported by bullish RSI divergence from oversold conditions on the 8H chart.
Key Levels:
Support Zone: 1.1613 – 1.1634 (Fib Cluster + Channel Support + Monthly Support)
Resistance Zone: 1.1755 (Weekly Resistance) followed by 1.1816 (0.27 Fib Extension) and 1.1887 (0.618 Extension)
Invalidation Level: Below 1.1533 (1.272 Fib + Structural Breakdown)
Confluences:
Price broke above a descending correctional trendline, indicating a potential bullish continuation.
Multiple Fibonacci levels (0.382, 0.5, 0.618) have stacked around the previous consolidation area, increasing probability of a sustained move.
RSI bounce from below 40 suggests short-term momentum reversal.
Trade Idea:
We may see a minor pullback into the 1.16344–1.1659 area before a potential continuation higher. Conservative bulls may wait for a retest of this zone with a bullish engulfing or pin bar confirmation before entering long.
Targets:
First target at 1.1755 (prior weekly resistance)
Second target at 1.1816 (Fib extension)
Final target near 1.1887 (major resistance / upper channel boundary)
Risk Management:
A break and close below 1.1533 would invalidate the bullish setup and signal potential bearish pressure returning to the pair.

Total3 – Back Above 1T, but Will It Offer a Second Chance?📈 What happened since April?
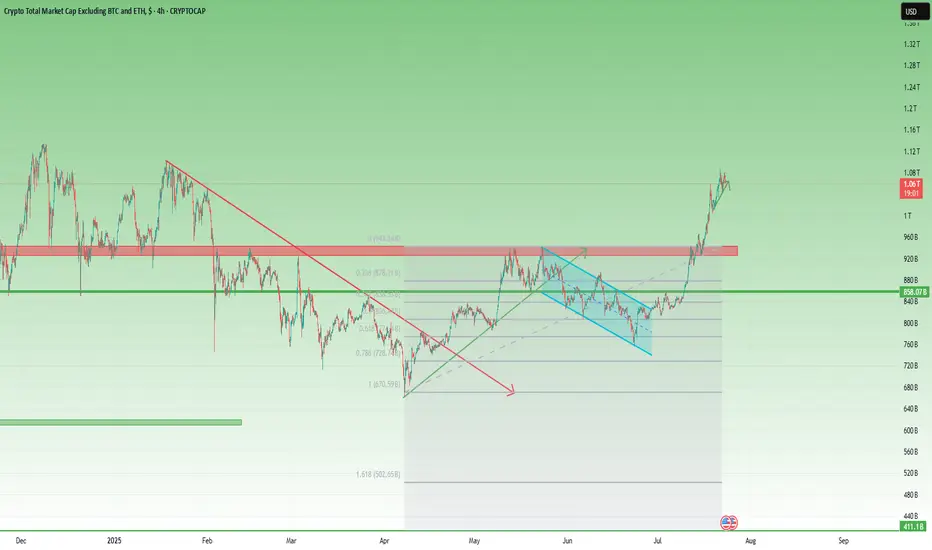
After the sharp low in early April, Total3 began to recover steadily.
Toward the end of the month, it broke above the falling trendline that had been holding since January — a key technical shift.
This triggered a strong recovery rally, pushing total altcoin capitalization (excluding BTC & ETH) to the 930–940B resistance zone.
📉 Then came the pullback…
Price printed a double top near resistance, followed by a drop — but not a bearish one.
Instead, the correction was orderly, forming a bullish flag, with the low landing right on the 61.8% Fibonacci retracement. Classic healthy structure.
🚀 The latest breakout
Earlier this month, Total3 launched a very impulsive leg up, reclaiming the 1 trillion level with strength.
At the time of writing, we’re trading back above 1T, and momentum remains on the bulls’ side.
However, the chart does look a bit overextended in the short term, suggesting a correction could follow soon.
🧭 Trading Plan – Will We Get a Retest?
The textbook play would be to wait for a deep pullback toward previous support levels.
BUT – I don’t believe we’ll get a full retest of the breakout. Altcoins may stay elevated or correct only modestly.
Instead, I’ll be watching the 1T zone and slightly below — that’s where I’ll look to load up on interesting altcoins.
📌 Conclusion:
Total3 has broken structure, reclaimed key levels, and is showing classic bullish continuation behavior.
The market may not offer you the perfect entry — but small dips near 1T could be all we get before another move higher. 🚀
Be prepared. Don’t wait for perfection in a market because rarely gives it.
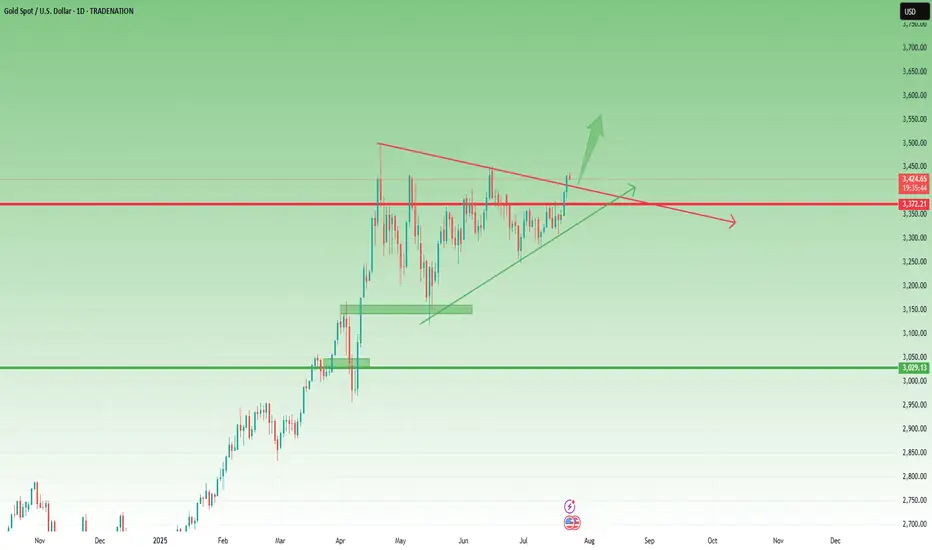
Lingrid | GOLD Key Resistance Zone. Possible Short-Term TradeThe price perfectly fulfilled my last idea . OANDA:XAUUSD has reached the upper boundary of the resistance zone around 3,445 after a strong impulse leg from the support trendline and the breakout of consolidation. Price action shows signs of exhaustion just below the June high, forming a potential reversal pattern near the channel top. If gold fails to hold above this resistance, a short-term pullback toward the 3,385 level becomes likely. The setup favors a short-term corrective decline unless bulls reclaim control with a breakout above the red trendline.
📉 Key Levels
Sell trigger: Rejection below 3,445
Sell zone: 3,430–3,445
Target: 3,385
Invalidation: Close above 3,480
💡 Risks
Breakout continuation toward 3,480
Sustained momentum from recent impulse leg
DXY weakness boosting gold's appeal
If this idea resonates with you or you have your own opinion, traders, hit the comments. I’m excited to read your thoughts!

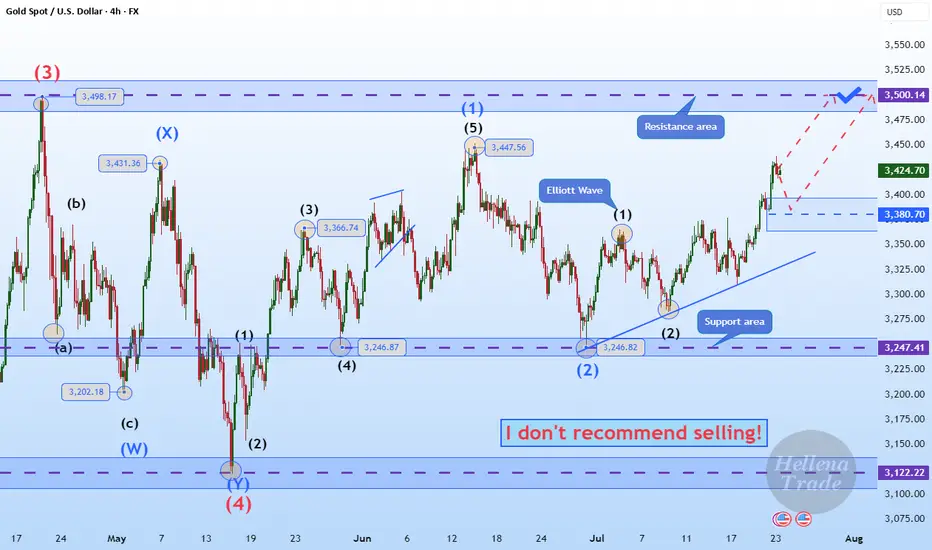
Hellena | GOLD (4H): LONG to resistance area of 3498 (Wave 3).The price continues to move in a bullish direction, and I believe that now is the time to pay attention to the medium-term wave “3.” It is actively developing, and I believe that the target should be set at the maximum area of the higher-order wave “3” — the resistance area of 3498.
This is the nearest target, which carries significant weight.
Overall, the upward five-wave movement is developing according to the old scenario.
Manage your capital correctly and competently! Only enter trades based on reliable patterns!
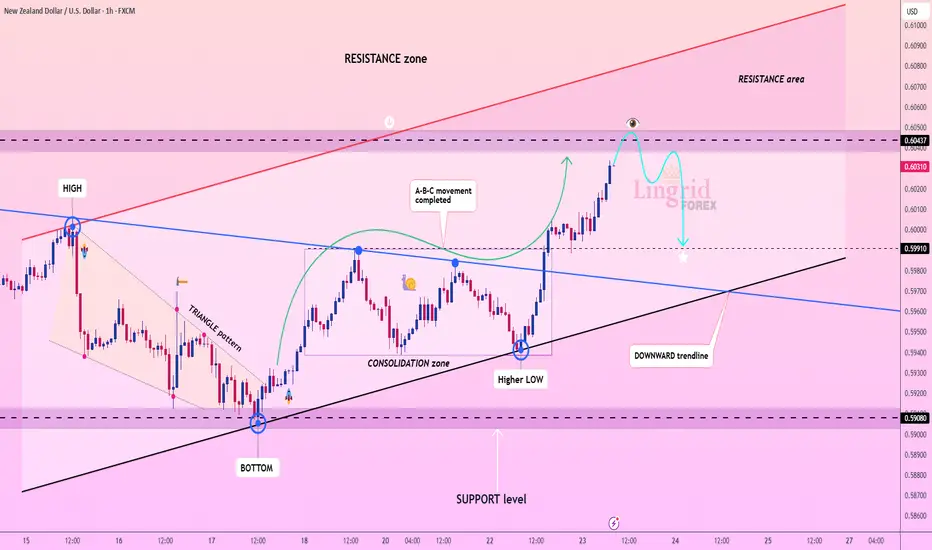
Lingrid | NZDUSD Potential Market Correction From ResistanceFX:NZDUSD has approached a key resistance zone at 0.6040 after completing an A-B-C upward move and forming a potential lower high. Price is testing both horizontal and trendline resistance, suggesting exhaustion within the broader upward move. A failure to hold above the 0.6040 area may trigger a reversal toward the 0.5991 support zone. The structure favors a bearish pullback if the breakout is rejected.
📉 Key Levels
Sell trigger: Rejection from 0.6045
Sell zone: 0.6035–0.6045
Target: 0.5991
Invalidation: Close above 0.6055
💡 Risks
Clean breakout above resistance zone
Strengthening NZD from risk sentiment shift
Holding above upward trendline support
If this idea resonates with you or you have your own opinion, traders, hit the comments. I’m excited to read your thoughts!
Lingrid | TRXUSDT Pullback Following the Bullish Momentum BINANCE:TRXUSDT is consolidating after retreating from the 0.3350 resistance, following a higher high within the upward channel. Despite short-term bearish momentum, price has rebounded off the key 0.3128 support near the blue trendline. A break above recent highs may open a move back toward the resistance zone and upper channel. As long as the ascending structure holds, bullish continuation remains favored.
📉 Key Levels
Buy trigger: Break above 0.3190
Buy zone: 0.3128–0.3160
Target: 0.3350
Invalidation: Break below 0.3090
💡 Risks
Failure to reclaim breakout structure
Channel support breakdown
Broader market weakness in altcoins
If this idea resonates with you or you have your own opinion, traders, hit the comments. I’m excited to read your thoughts!

XAGUSD Outlook – 40 Remains the Next TargetIn my previous XAGUSD analysis, I argued that the trend was strongly bullish and that a move toward 40 was the next logical outcome. At the time, price was correcting, and I highlighted the 37.50 zone as a key area to look for long opportunities.
✅ Indeed, Silver respected that zone perfectly —
It retested the broken consolidation, found support, and then surged higher, marking a new multi-year high in yesterday’s session.
________________________________________
🔍 What Now?
Nothing has changed in the broader view:
• Trend: Strongly bullish
• Structure: Higher highs and higher lows remain intact
• Behavior: Dips are being bought aggressively
As long as the recent 37.50 low is not broken, the strategy remains straightforward:
Buy dips within bullish continuation
________________________________________
🎯 40 in Sight — But Don’t Be Surprised if It Goes Further
The 40 zone remains the natural next target — a major psychological level.
But based on current momentum and breakout strength, Silver could go even higher in the coming weeks and months. If buyers keep control, we might even see new ATH test by year's end (50 zone).
________________________________________
🟢 Conclusion
This breakout confirms the larger trend.
The pullback to 37.50 was bought, as expected, and now Silver is making its move.
Strategy should remain the same:
Stay long above 37.50
Buy the dips
Watch how price reacts near 40 — but keep an open mind for higher levels
Disclosure: I am part of TradeNation's Influencer program and receive a monthly fee for using their TradingView charts in my analyses and educational articles.

Gold Update – Strong Breaks, Strong BullsYesterday, after the break of the key 3370 resistance, Gold corrected slightly toward 3383, then consolidated briefly in that area. From there, it launched into a strong new leg up, closing the day once more near the highs, around 3430.
📌 What’s important here is that the price did not even come back to retest the broken resistance — now turned support. Combined with the strong daily close near the high of the range, this gives us a clear message:
➡️ Bulls are in full control.
________________________________________
🔍 This Week – Three Key Breaks
So far this week, Gold has delivered three major breakouts:
• ✅ A clean breakout from the box consolidation that kept price stuck and indecisive last week
• ✅ A decisive break above the 3400 psychological figure
• ✅ A breakout above the symmetrical triangle resistance, which had been forming since late April
Each of these is significant on its own. Together, they suggest a shift toward a more aggressive bullish scenario.
________________________________________
🔮 What’s Next?
All these breakouts point to the potential for more gains ahead.
In fact, the next logical step could be an attempt to mark a new All-Time High.
My view remains the same:
Buying dips remains the strategy of choice, with a focus on the 3400 zone as a key support area, and a swing target around 3500.
Disclosure: I am part of TradeNation's Influencer program and receive a monthly fee for using their TradingView charts in my analyses and educational articles.
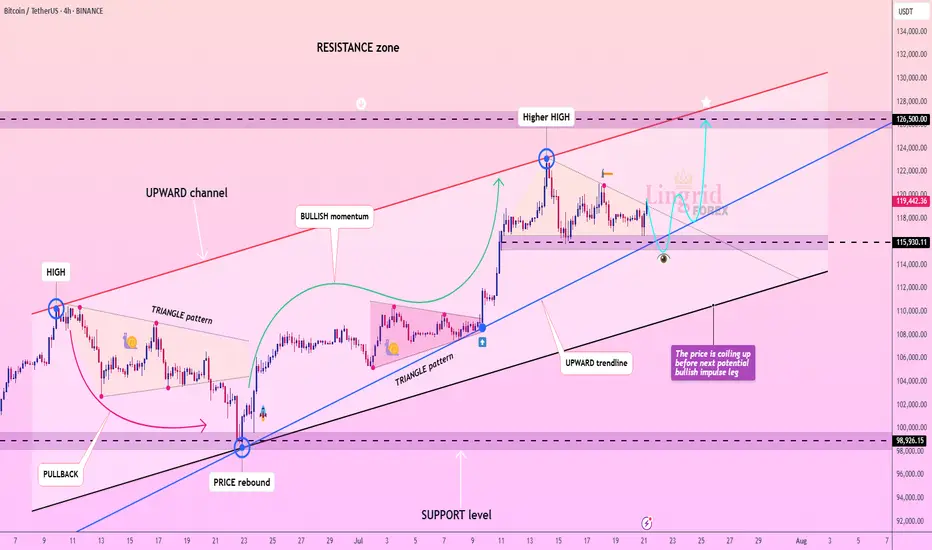
Lingrid | BTCUSDT Consolidation Expansion ScenarioBINANCE:BTCUSDT is coiling within a bullish continuation zone after rebounding strongly from the 115,930 support and holding above the blue ascending trendline. Price formed a higher high inside the rising channel, followed by sideways consolidation, suggesting preparation for another bullish leg. The triangle pattern breakout and price stability above the trendline favor upward continuation toward the resistance at 126,500. Momentum remains intact while the structure supports the next breakout push.
📉 Key Levels
Buy trigger: Break and hold above 120,000
Buy zone: 117,500–118,200
Target: 126,500
Invalidation: Close below 115,930
💡 Risks
Loss of support at the trendline
Strong rejection near red channel resistance
Weak market sentiment or macro news shocks
If this idea resonates with you or you have your own opinion, traders, hit the comments. I’m excited to read your thoughts!
GBP/USD — Potential Bullish Reversal Setup | Long Bias Above Sup🧠 Thesis:
GBP/USD is showing early signs of a potential bullish reversal from a key confluence zone. While price has recently tested short-term descending channel, we’re currently testing a strong ascending trendline support and prior demand zone. This setup offers a favorable long-risk scenario — so long as price remains above 1.3335 (invalid level).
🔍 Technical Breakdown:
Descending Channel: Price has been in a corrective downward channel since early July. This pullback appears orderly and corrective rather than impulsive.
Support Zone: We are seeing strong reactions from the 1.3400–1.3440 area, which aligns with:
Previous consolidation zone (mid-May).
200 EMA on the 4H.
Long-term ascending trendline support (from April lows).
Bullish RSI Divergence: RSI is testing oversold territory (~32) with potential for bullish divergence forming — a classic early signal for a bounce.
EMA Cluster: 50 EMA has been breached but price is testing the 200 EMA as last-resort dynamic support. If held, this further adds to the bullish case.
🧭 Scenarios:
✅ Bullish Bias (Preferred)
If price holds above the trendline support and breaks out of the descending channel, we could see a bullish impulse toward:
🎯 TP1: 1.3600 (prior structure)
🎯 TP2: 1.3770 (trendline extension & fib confluence)
Confirmation trigger: Break and close above 1.3500 resistance (channel breakout).
❌ Invalidation:
A decisive break below 1.3335 (marked in red) invalidates this idea and shifts bias back to bearish — potential deeper pullback toward 1.3200s.
⚠️ Risk Management:
Entry zone: 1.3430–1.3450 (near support)
Stop loss: Below 1.3335
Risk-reward: >2.5:1 on a successful breakout
📝 Conclusion:
This is a classic trend-continuation play with clean structure and a logical invalidation point. The market is offering a textbook “buy-the-dip” scenario off strong multi-timeframe support. Patience is key — wait for confirmation before sizing in.

EUR/USD – Falling Wedge at Major Fibonacci Zone | Bullish ReversAfter a strong mid-June rally, EUR/USD has pulled back into a key fib cluster, showing early signs of reversal from a classic falling wedge pattern — often a precursor to bullish breakouts.
Technical Breakdown:
📉 Descending Trendline
🔍 Fibonacci Confluence:
Price is reacting from the 0.5-0.618 – 0.705 zone (1.16421-1.15969), aligning perfectly with historical demand and the golden zone of the fib retracement.
Just below sits the 0.79 fib (1.15339), which also marks our invalidity level for this idea — a deep but powerful retracement if tested.
💡 RSI:
While still below 50, it has created a hidden bullish divergence between July 12–17, hinting that momentum is flipping back to bulls.
🧠 Educational Insight:
This setup combines Trendlines, Fibonacci retracement theory, and EMA dynamics to build a multi-layered trade thesis — the type of confluence we look for at Wright Way Investments.
Price doesn’t just reverse because it hits a fib level. But when structure, EMAs, and RSI align — the odds increase significantly.
📈 Trade Setup (Idea-Based, Not Financial Advice):
Long Entry Zone: Current area (1.159–1.161), with confirmation above 1.1626
Invalidation: Clean break & close below 1.15339
Target Zones:
🎯 TP1 – 1.1642 (50 fib & retest zone)
🎯 TP2 – 1.1686 (38.2 fib)
🎯 TP3 – 1.1755 (Weekly Resistance)
📌 Summary:
EUR/USD is forming a textbook reversal setup, supported by fib precision and EMA alignment. Patience is key — but the ingredients are here for a strong bullish continuation.
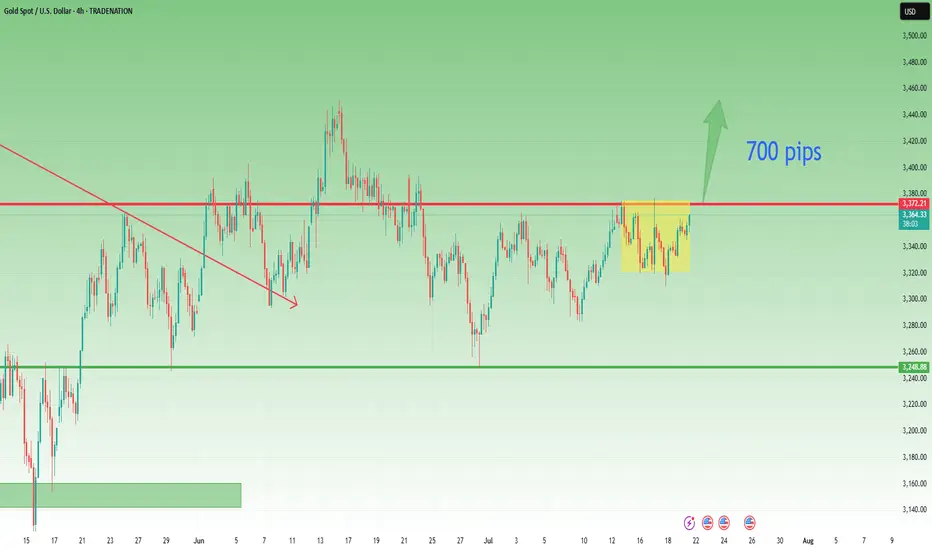
Gold - Above 3370 Is Bullish Territory – But 3360 Must Hold📆 What happened yesterday?
After more than a week of frustrating, sideways price action, Gold finally broke out above the key 3370 resistance zone.
The breakout was clean and impulsive, with TRADENATION:XAUUSD pushing to an intraday high around 3400.
Following that move, price printed a small double top near the high and began a modest correction — perfectly normal after such a breakout. At the time of writing, Gold trades at 3385, still holding above former resistance.
📈 Why this breakout matters:
The daily close at 3396 came in strong and near the top, leaving behind a clear Marubozu candle
This kind of price action signals conviction and momentum
The breakout confirms what I’ve been anticipating for days — the range is resolved, and the market is choosing the bullish path
🎯 What to expect next:
If price stabilizes above 3400, the road to 3450 opens — which is the target mentioned in my previous analyses
That area represents the next major resistance and likely magnet for price if bulls stay in control
🧭 Trading Plan:
For me, the plan is now simple:
✅ Buy the dips — especially on a potential retest of the 3370–3375 broken resistance, which now turns into support
❌ Negation comes only with a daily close below 3360, which would invalidate this breakout and raise questions
📌 Conclusion:
The breakout has finally come. After days of coiling, Gold chose the upside.
Momentum is building, structure is clean, and bulls are back in control — unless 3360 fails.
Until then, I remain bullish, looking to buy dips into strength. 🚀
Disclosure: I am part of TradeNation's Influencer program and receive a monthly fee for using their TradingView charts in my analyses and educational articles.
Lingrid | GOLD Price Correction or Continuation ?The price perfectly fulfilled my last idea . OANDA:XAUUSD has completed an A-B-C bullish movement within the rising structure and is now testing a key resistance zone near 3,387. With momentum fading near the upper boundary, a potential correction toward the 3,367 area is likely before any further advance. A bounce from the SWAP zone may trigger renewed upside toward the 3,430 resistance. Price action remains bullish above the higher low and broken triangle pattern.
📉 Key Levels
Buy trigger: Rebound from 3,367
Buy zone: 3,355–3,370
Target: 3,430
Invalidation: Break below 3,342
💡 Risks
Deep correction below key structure
Failure to reclaim resistance after retest
Sudden shift in macroeconomic sentiment
If this idea resonates with you or you have your own opinion, traders, hit the comments. I’m excited to read your thoughts!

Lingrid | USDCHF Corrective Move and Bearish ContinuationThe price perfectly fulfills my previous idea . FX:USDCHF is weakening after printing a lower high beneath the resistance zone and rejecting the confluence of the downward trendline and horizontal supply near 0.80079. The structure remains bearish despite short-term corrective moves, as each rally stalls below previous highs. Price is at risk of rolling over again, aiming for the 0.78300 support if the 0.80000 area holds as resistance. Sellers remain in control as long as the pair trades below the red trendline.
📉 Key Levels
Sell trigger: Rejection below 0.80000
Sell zone: 0.79800–0.80100
Target: 0.78300
Invalidation: Close above 0.80150
💡 Risks
Bullish breakout above the descending trendline
Momentum divergence on intraday timeframes
Broader USD strength recovery
If this idea resonates with you or you have your own opinion, traders, hit the comments. I’m excited to read your thoughts!

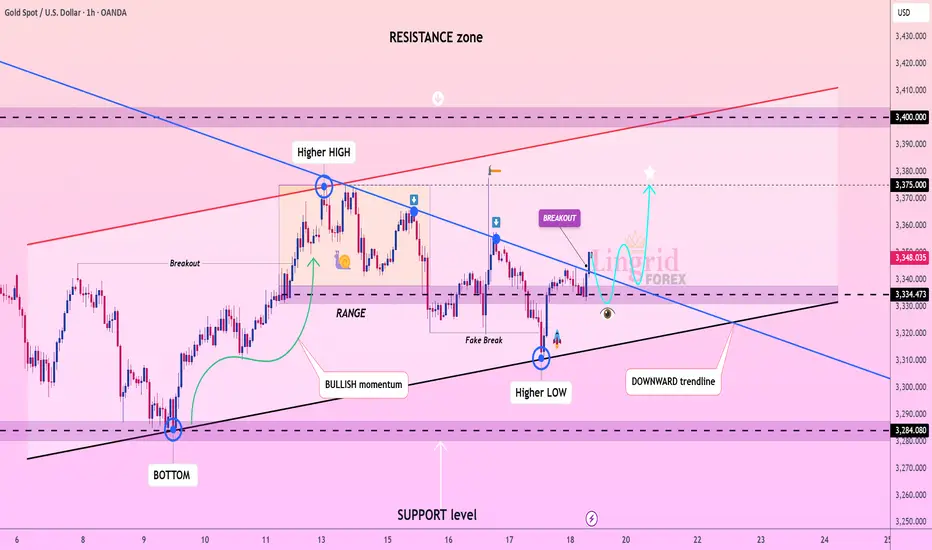
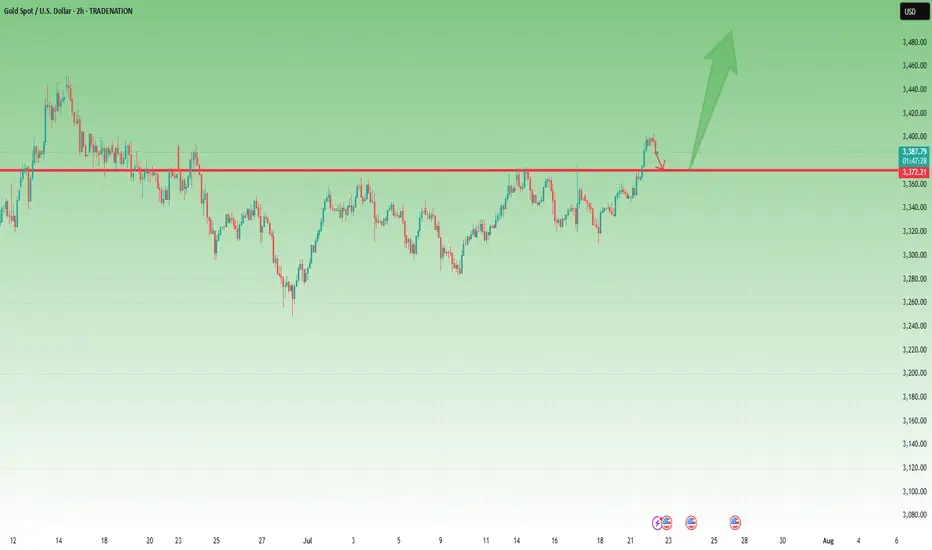
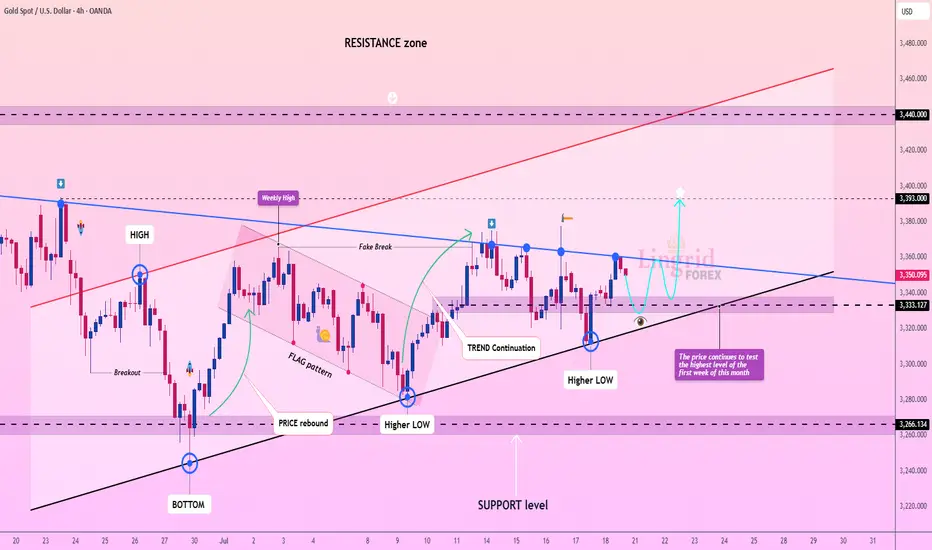
Lingrid | GOLD Weekly Analysis: Testing Resistance ZoneOANDA:XAUUSD markets are showing renewed strength as prices continue to test the highest levels reached in the first week of this month, demonstrating persistent bullish momentum despite ongoing consolidation. The precious metal is approaching a decisive technical juncture that could determine the next major directional move.
The chart reveals a compelling technical setup with gold forming higher lows while maintaining the upward trend continuation. After the previous fake breakout and flag pattern completion, the market has established a solid foundation above the $3,330 support level. The current structure shows a series of higher lows, confirming the underlying bullish bias.
The weekly high retest presents a crucial inflection point. A successful break above this level could trigger the next major leg higher toward the $3,400+ target zone, particularly given the ascending triangle formation and persistent institutional interest. The convergence of multiple technical indicators, including the trend continuation pattern and higher low formation, suggests accumulation at current levels.
Key levels to monitor include the immediate resistance at $3,393 and the critical $3,450 level. A decisive break above these levels would likely accelerate momentum toward $3,500-$3,600, while failure to maintain the higher low structure could see a pullback toward $3,285 support. The overall technical picture remains constructively bullish within the broader uptrend.
If this idea resonates with you or you have your own opinion, traders, hit the comments. I’m excited to read your thoughts!
Gold Outlook – The Range Holds, Direction Still Pending📆 What happened recently?
Since the middle of last week, I’ve been repeating the same core idea like a broken record:
👉 “Gold needs to break out of the range to define its next real move.”
And once again, on Friday, TRADENATION:XAUUSD respected the structure, fluctuating quietly and closing the week right in the middle of the range — no breakout, no confirmation.
📈 Current status:
The new week opened with some bullish interest, and at the time of writing, Gold trades around 3363. Still inside the box.
So far, no technical change, and certainly no resolution.
❓ What am I watching for?
A clear break above 3375 → confirms bullish continuation
A decisive break below 3320 → confirms reversal potential
Until then, everything in between is noise and chop.
🧭 Trading plan:
My stance remains unchanged:
⏳ No position. No bias. Just waiting.
Once we get confirmation in either direction, I’ll take action.
📌 Conclusion:
Gold is still locked inside the range. The market is coiling, but no side is winning yet.
Patience here is a weapon — and I’m keeping it loaded. 🚀
Disclosure: I am part of TradeNation's Influencer program and receive a monthly fee for using their TradingView charts in my analyses and educational articles.
Bitcoin- 175-200k by year's endEvery major Bitcoin move over the last decade — whether a jaw-dropping bull run or a brutal crash — has shared one silent macro trigger.
It’s not the halving.
It’s not ETF hype.
It’s not Twitter sentiment or TikTok FOMO.
👉 It’s global liquidity.
And right now, this powerful force is expanding fast — the same setup that previously drove Bitcoin from $5K to $70K in under a year.
But here’s the twist: as of today, Bitcoin is already trading near $120,000, not $20K or 30k.
That means the engine is already roaring — and if this macro thesis holds, the next stop might just be $175,000-200.000 by year's end.
________________________________________
🧠 What Is Global Liquidity, Really?
Global liquidity = the total money sloshing around the financial system.
It’s often measured through M2 money supply, combining:
• Cash
• Checking/savings deposits
• Easily accessible liquid assets
The most comprehensive view comes from Global M2, which aggregates liquidity from 20 of the world’s largest central banks.
Right now, Global M2 is not just rising — it’s breaking to all-time highs.
And if history repeats itself, Bitcoin tends to follow this wave closely.
________________________________________
📅 Past Performance: Bitcoin and Liquidity Walk Hand in Hand
Let’s break it down:
• 2016–2017: Liquidity surges → BTC +5,000%
• 2020–2021: Post-COVID easing → BTC $5K to $69K
• 2018 & 2022: Liquidity dries up → BTC crashes ~70%
It’s a recurring pattern:
Liquidity drives the crypto cycle.
________________________________________
💡 Why Liquidity Moves: Interest Rates and Central Banks
Central banks control the tap.
• 🟢 Cut rates → Easier credit → More lending → More liquidity
• 🔴 Raise rates → Tighter credit → Less spending → Liquidity contraction
In 2022, the Fed tightened hard.
🧊 U.S. money supply shrank.
📉 Bitcoin fell from $70K to $15K.
But starting August 2023, the Fed paused, then pivoted.
Since then:
• 🟢 The U.S. M2 supply rebounded
• 🟢 Global M2 began expanding again
• 🟢 Over 64 global rate cuts were made in just six months — one of the fastest global easing cycles in history
The last time we saw this much cutting? 2020.
And we all know what happened to Bitcoin then.
U.S M2
________________________________________
🟢 Today’s Setup: The Engine Is Already Running
Fast forward to mid-July 2025:
Bitcoin is no longer at $30K — it’s already testing $120K.
Intraday highs have touched $123K, with a current consolidation zone between $117K–$120K.
This isn’t a "recovery rally" — we’re already in price discovery territory.
The question now becomes:
Is $150K and above next… or are we topping out?
________________________________________
📈 Charting the Path: Bitcoin vs Global M2
When we overlay Bitcoin price over global liquidity trends, one thing becomes crystal clear:
📊 Bitcoin tracks liquidity direction.
• When money supply expands, Bitcoin rallies.
• When money dries up, Bitcoin tanks.
Given that global M2 is at record highs, and liquidity conditions are easing globally, the chart suggests there’s still plenty of fuel in the tank.
And if we follow the same growth, Bitcoin could realistically reach $175,000 before 2026 kicks in.
________________________________________
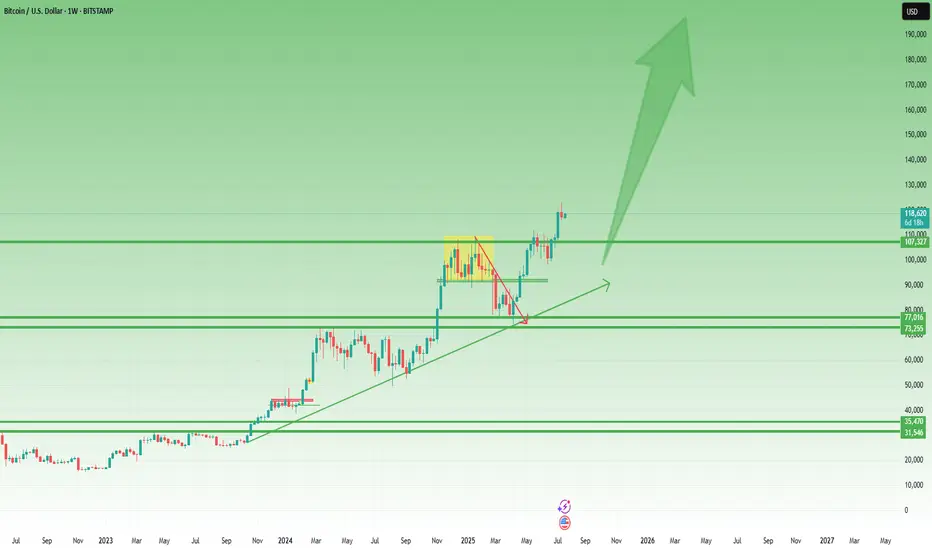
Technically:
As we can clearly see from the posted weekly chart, you don’t need to be an expert to recognize the strength of the current uptrend.
While last week printed a small bearish Pin Bar, this alone shouldn’t raise major concerns — especially considering the presence of multiple key support levels, starting from the 110K zone.
In the context of a strong and well-established trend, such candles often reflect normal short-term profit-taking, not a reversal.
🎯 Conclusion – Don’t Fight the Tide
This isn’t about hopium.
It’s not moon talk.
It’s about macro flows and monetary velocity.
Ignore the noise.
Watch what the central banks are doing.
Because Bitcoin moves not on wishful thinking, but on waves of liquidity — and the tide right now is rising fast.
Whether $175K comes by year-end, one thing is clear:
We are in the middle of a liquidity-driven expansion phase, and Bitcoin is already responding.
Stay focused, manage your risk, and don’t chase — ride the wave. 🌊
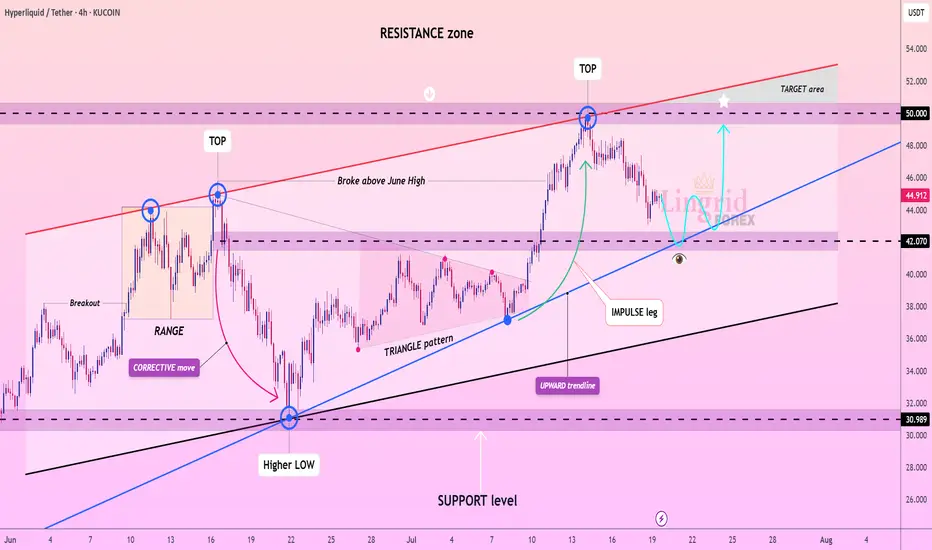
Lingrid | HYPEUSDT potential Rebound from the Support ZoneThe price perfectly fulfilled my last idea . KUCOIN:HYPEUSDT recently surged above the triangle pattern and tested the key resistance near 50, forming a local top. After a healthy retracement, price is now approaching the blue upward trendline and support zone near 42, setting the stage for another bullish bounce. The structure reveals a higher low and a strong impulse leg, suggesting continuation toward the upper resistance area. The chart favors bullish continuation after retest confirmation of the ascending support.
📉 Key Levels
Buy trigger: Bounce from 42.5–43.5 zone
Buy zone: 42.0–43.0
Target: 50.0 with potential to 52.0
Invalidation: Breakdown below 40.0
💡 Risks
Failure to hold trendline support
False breakout rejection below 42.0
Broader market sentiment turning risk-off
If this idea resonates with you or you have your own opinion, traders, hit the comments. I’m excited to read your thoughts!
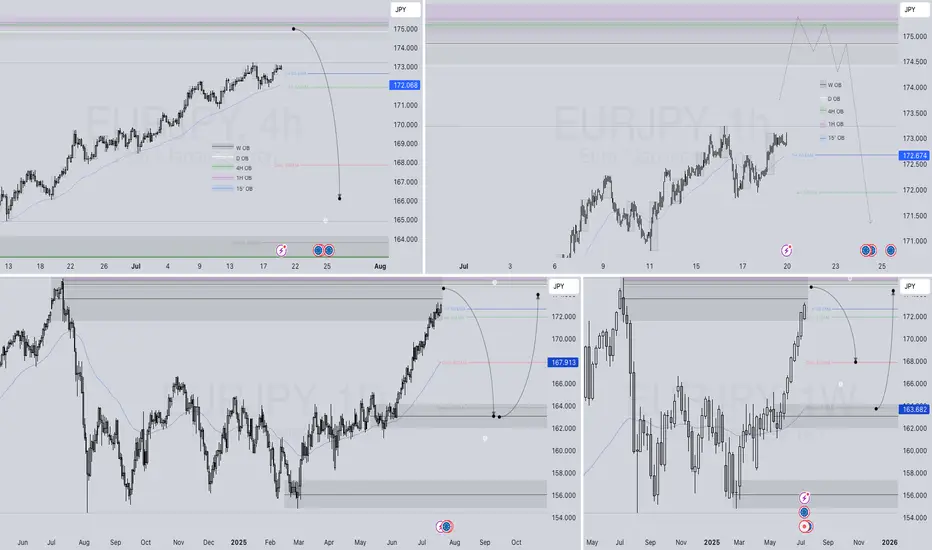
EURJPY – WEEKLY FORECAST Q3 | W30 | Y25📊 EURJPY – WEEKLY FORECAST
Q3 | W30 | Y25
Weekly Forecast 🔍📅
Here’s a short diagnosis of the current chart setup 🧠📈
Higher time frame order blocks have been identified — these are our patient points of interest 🎯🧭.
It’s crucial to wait for a confirmed break of structure 🧱✅ before forming a directional bias.
This keeps us disciplined and aligned with what price action is truly telling us.
📈 Risk Management Protocols
🔑 Core principles:
Max 1% risk per trade
Only execute at pre-identified levels
Use alerts, not emotion
Stick to your RR plan — minimum 1:2
🧠 You’re not paid for how many trades you take, you’re paid for how well you manage risk.
🧠 Weekly FRGNT Insight
"Trade what the market gives, not what your ego wants."
Stay mechanical. Stay focused. Let the probabilities work.
FRGNT FOREX ANALYSIS 📊
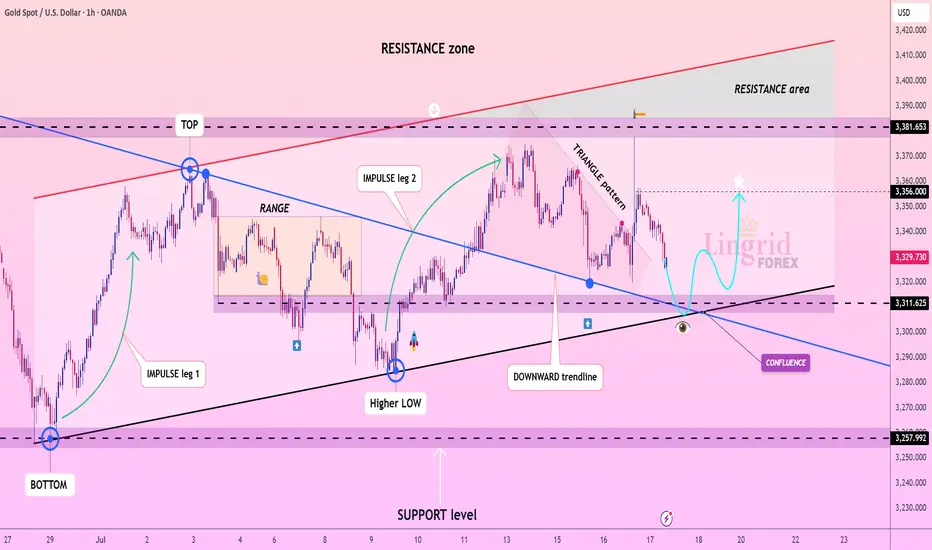
Lingrid | GOLD Continues to See Range-Bound MovementOANDA:XAUUSD is forming a bullish structure above the confluence of the downward trendline and horizontal support at 3,310. A strong impulse move followed by a triangle consolidation hints at an emerging continuation pattern, with buyers preparing for another leg higher. Price is currently approaching a key decision zone where previous support and diagonal confluence intersect, creating a launchpad scenario. If price confirms support above 3,311, a rebound toward the 3,356–3,382 zone becomes likely.
📉 Key Levels
Buy trigger: Rebound from 3,310–3,320
Buy zone: 3,300–3,315
Target: 3,356 and potentially 3,380
Invalidation: Break and close below 3,250
💡 Risks
Breakdown below the support zone may trigger extended retracement
False breakout through triangle resistance without volume
Sudden volatility from macroeconomic catalysts (e.g., Fed comments or CPI data)
If this idea resonates with you or you have your own opinion, traders, hit the comments. I’m excited to read your thoughts!
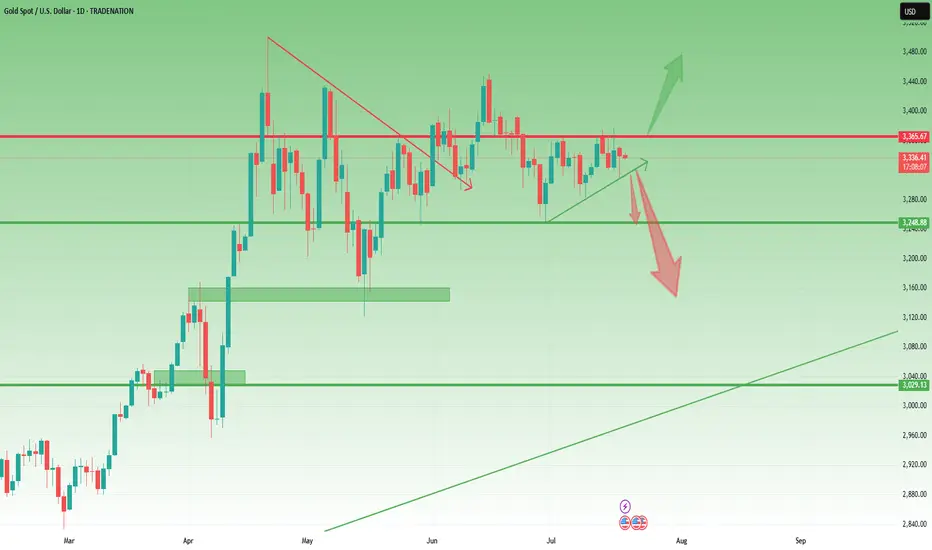
Gold- Still needs to resolve the range🔸 Still Rangebound, But Not for Long
In yesterday’s analysis, I mentioned that two scenarios are in play for Gold:
1. Bullish above 3375
2. Bearish under 3320
Throughout the session, price action leaned toward the bearish side, and I aligned with that by opening a short position. It ended with a minor loss — just 50 pips, which is negligible considering I'm looking for a potential 1,000 pip move in the bigger picture.
________________________________________
🔍 What's Next?
As the title says, Gold still needs to resolve the current range before a clear directional move unfolds.
The same key levels discussed yesterday remain valid and relevant.
And since it’s Friday, today’s daily and weekly candle close will be critical in shaping expectations for next week.
________________________________________
📈 Bullish Case: Close Above 3360
• A daily/weekly close around 3360 would bring strong pressure on the 3375 resistance.
• That could lead to a bullish breakout from the ascending triangle pattern.
• It would also leave behind a bullish weekly pin bar (last week was a bullish pin bar too).
• This scenario would bring 3450 into focus — with 3500 and even a new ATH on the table in the coming weeks.
________________________________________
📉 Bearish Case: Close Near 3300
• A close near 3300 would signal a failed rally attempt
• That would expose 3250 support short term, and 3150 medium term.
________________________________________
🧭 Final Thoughts
At the moment, I’m flat and waiting for clearer confirmation later in the day.
The next move big will be defined by the weekly close — it’s as simple as that.
P.S.: It’s just a hunch , but I’m still leaning toward a break under 3300 as the next major move.
Disclosure: I am part of TradeNation's Influencer program and receive a monthly fee for using their TradingView charts in my analyses and educational articles.
Lingrid | GOLD Broke Corrective Dynamic Resistance OANDA:XAUUSD rebounded off the key support near 3334, forming a higher low and breaking above the descending trendline. This breakout confirms bullish intent, supported by prior accumulation in the range and fake breakdown traps. Price is now retesting the breakout zone and is expected to launch toward 3375 and possibly higher. The structure favors a bullish continuation pattern supported by confluence of trendlines and rising momentum.
📉 Key Levels
Buy trigger: Break and hold above 3350
Buy zone: 3335–3345
Target: 3375 short-term, with potential to 3400
Invalidation: Drop below 3320 support line
💡 Risks
Another fake breakout followed by strong rejection
Resistance at 3375 acting as a supply wall
Low volume on breakout can cause reversal
If this idea resonates with you or you have your own opinion, traders, hit the comments. I’m excited to read your thoughts!