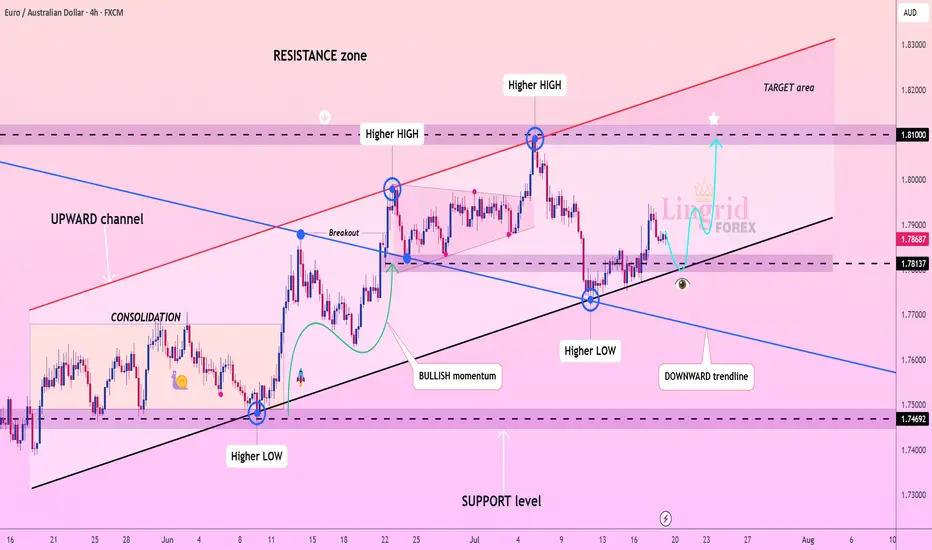
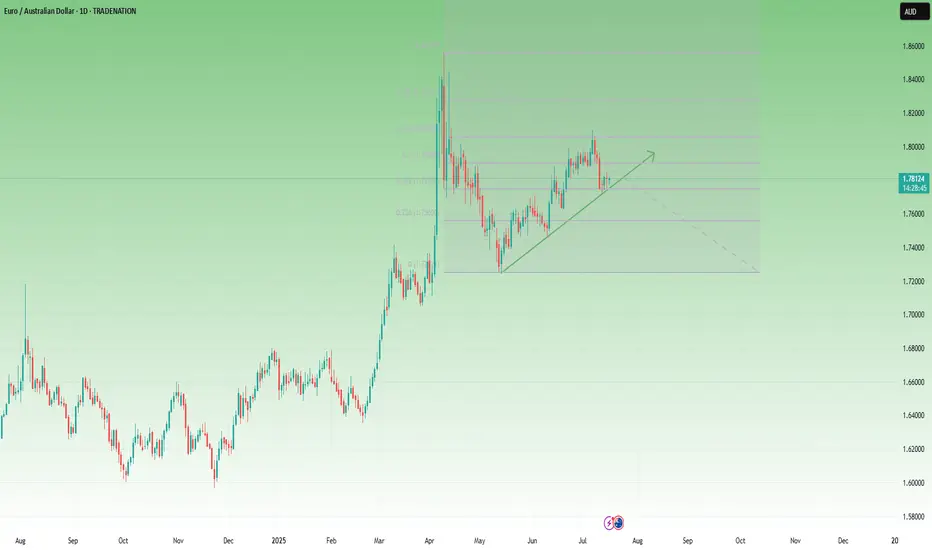
Lingrid | EURAUD Potential Retest of the Key LevelFX:EURAUD is holding firmly above the rising trendline after a successful retest of the support zone at 1.7813. The price has formed consecutive higher lows and remains within a well-defined upward channel, indicating continued bullish structure. A small corrective pullback is expected before a renewed rally toward the 1.8100 resistance level. Momentum is building for a potential breakout continuation toward the upper boundary of the channel.
📉 Key Levels
Buy trigger: Bounce from 1.7813 and reclaim of 1.7900
Buy zone: 1.7820–1.7880
Target: 1.8100
Invalidation: Breakdown below 1.7780 and support trendline
💡 Risks
Failure to hold above the current higher low
False breakout followed by bearish rejection from the mid-range
Weak momentum due to macroeconomic uncertainty
If this idea resonates with you or you have your own opinion, traders, hit the comments. I’m excited to read your thoughts!
Signalservice
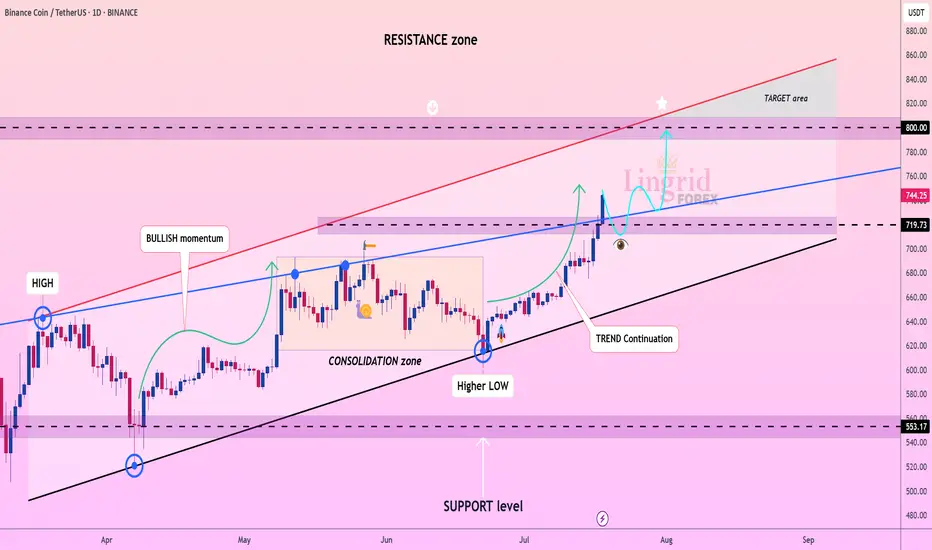
Lingrid | BNBUSDT Bullish MOMENTUM. Long from SUPPORT zoneBINANCE:BNBUSDT is continuing its bullish momentum after bouncing from the support trendline and breaking above the consolidation zone. Price has formed a higher low and followed through with strong impulse candles, pushing past local resistance around 720–740. The breakout confirms trend continuation within the upward channel, with price now aiming toward the 800 psychological level. The next leg higher could accelerate toward the upper resistance zone if support holds near 720.
📉 Key Levels
Buy trigger: Breakout above 740 confirmed
Buy zone: 719–730
Target: 800
Invalidation: Close below 700 support and trendline
💡 Risks
Rejection near horizontal resistance around 760
Bearish divergence on lower timeframes
Macro volatility from regulatory headlines or BTC sharp moves
If this idea resonates with you or you have your own opinion, traders, hit the comments. I’m excited to read your thoughts!
Lingrid | SOLUSDT trend Continuation TradeThe price perfectly fulfilled my previous idea . BINANCE:SOLUSDT found strong support around the 155.7 level after a brief pullback and continues to respect the ascending blue trendline. The previous bullish impulse followed by a healthy consolidation suggests a classic trend continuation structure. If buyers defend the current demand zone and reclaim upward momentum, a move toward the 180 resistance zone is likely. This setup aligns with broader bullish market structure and rising channel dynamics.
📉 Key Levels
Buy trigger: confirmed bounce from 155.7 trendline support
Buy zone: 155.7–158.0 (range floor and trendline confluence)
Target: 180.0
Invalidation: breakdown below 155.0 signals structure shift
💡 Risks
Volatility around trendline retest could trigger stop hunts
Failure to reclaim momentum above 165 may lead to ranging
Sudden market-wide weakness could pressure altcoins broadly
If this idea resonates with you or you have your own opinion, traders, hit the comments. I’m excited to read your thoughts!

Lingrid | GBPUSD buying Opportunity from the Demand ZoneFX:GBPUSD is rebounding from the 1.3390 support level after completing a triangle breakdown and retesting the lower support zone. A potential double-bottom pattern is forming near the key support area, signaling a short-term bullish reversal. If bulls reclaim the descending blue trendline, momentum could drive price back toward the 1.3550 resistance level. This retracement would mark a corrective phase within the larger structure, offering an upside opportunity.
📉 Key Levels
Buy trigger: bullish rejection from 1.3390 with recovery above 1.3440
Buy zone: 1.3390–1.3440 (demand and bounce structure)
Target: 1.3550
Invalidation: 4H candle close below 1.3390 support breaks bullish setup
💡 Risks
Failure to break above trendline could result in further consolidation
Macroeconomic news may override technical rebound
Downtrend pressure remains unless higher lows are confirmed
If this idea resonates with you or you have your own opinion, traders, hit the comments. I’m excited to read your thoughts!

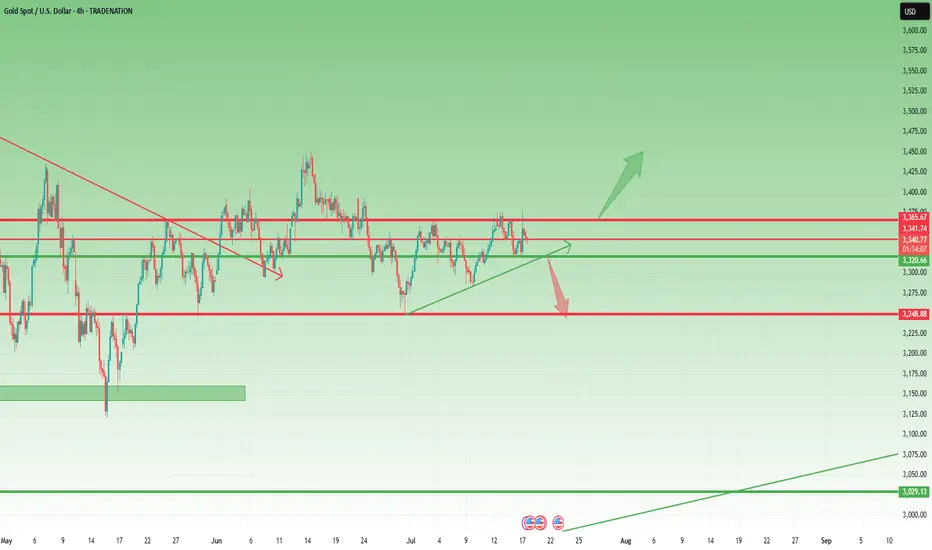
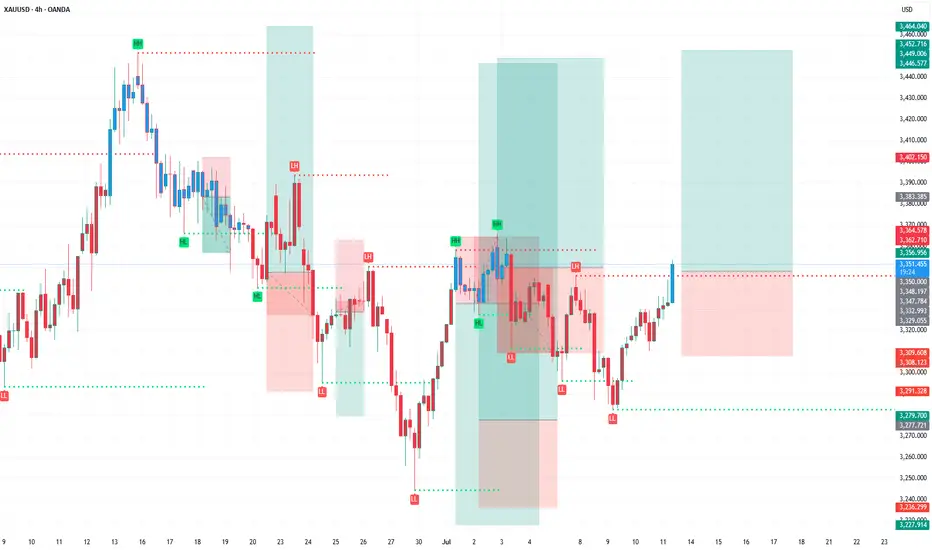
Waiting for the Break: 3375 or 3320 Will Decide the Next 1k Pips📉 Quick recap:
As you know, I've been bullish on Gold. However, as explained in yesterday’s analysis, I started to approach this view with more caution. Unfortunately, I closed my long position at break even… before the rally to the 3375 resistance. That’s trading.
📌 What now?
Despite missing that move, the market is beginning to offer more clarity. There are now two key levels that will likely define the next major swing:
________________________________________
🔹 1. Resistance at 3375 – Top of the Range / Triangle Breakout Zone
• This level marks the upper boundary of the recent range
• It’s also the resistance of a developing ascending triangle
• A clean breakout above 3375 would confirm the pattern and could trigger a strong upside acceleration
• Target: 3450 zone, with potential for more if momentum kicks in (approx. 1000 pips higher)
➡️ This is the obvious bullish scenario – in line with the broader trend and classical technical setup.
________________________________________
🔻 2. Support at 3320 – The Less Obvious, but Classic Gold
• 3320 is now a confluence support area
• Technically, a break below here is less probable – but Gold has a habit of doing the unexpected
• If 3320 breaks, bears could look for a first leg to 3280 (approx. 400 pips), and very probably 3250 (around 700 pips drop)
➡️ This bearish scenario is not the base case, but it must not be ignored. Sometimes the trap is in the obvious.
________________________________________
🧭 Trading Plan:
For now, I’m out of the market, patiently waiting for confirmation. I’ll trade the breakout – whichever side gives the signal first.
________________________________________
📌 Conclusion:
Gold is coiling for a larger move. The levels are clear: 3375 and 3320 are the doors. One of them will open. Until then, we wait and prepare. 🚀
Disclosure: I am part of TradeNation's Influencer program and receive a monthly fee for using their TradingView charts in my analyses and educational articles.
GOLD XAUUSD TodayGOLD XAUUSD Today
SSM Structure back to sell trend
In my opinion good for looking sell setup
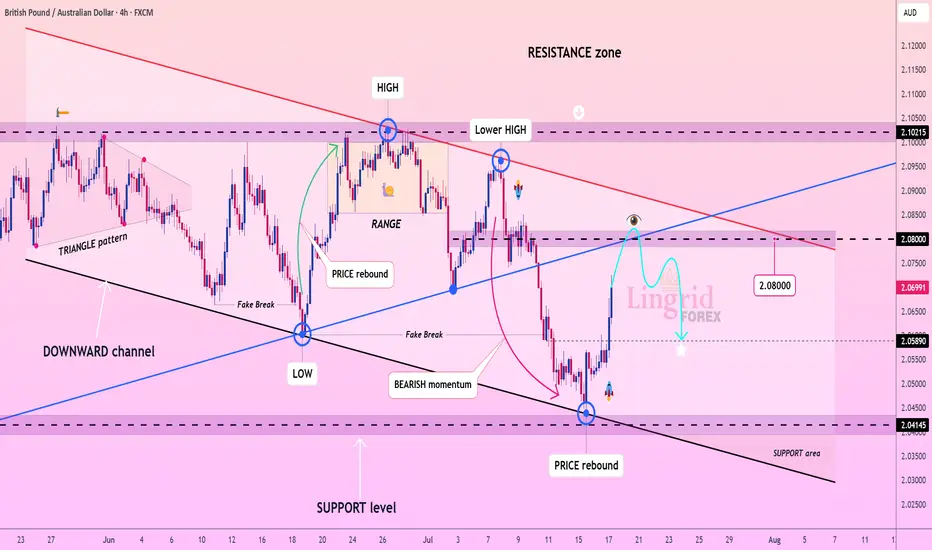
Lingrid | GBPAUD Selling Opportunity From the Key LevelFX:GBPAUD rebounded sharply from the key support zone near 2.0415, forming a corrective leg toward the mid-range resistance at 2.0800. However, the overall structure remains within a downward channel, and the recent lower high under the red resistance trendline suggests continuation of bearish pressure. A rejection from the 2.08–2.10 zone would likely resume the prior impulse leg toward lower support levels. Until a breakout above the descending red trendline occurs, rallies remain corrective.
📉 Key Levels
Sell trigger: Rejection from 2.0800–2.0900
Sell zone: 2.0750–2.0850
Target: 2.0589 and potentially 2.0415
Invalidation: Break and close above 2.1020
💡 Risks
Breakout from the red resistance line could reverse the downtrend
Sudden AUD weakness from macro events
Price closes above the descending channel boundary
If this idea resonates with you or you have your own opinion, traders, hit the comments. I’m excited to read your thoughts!
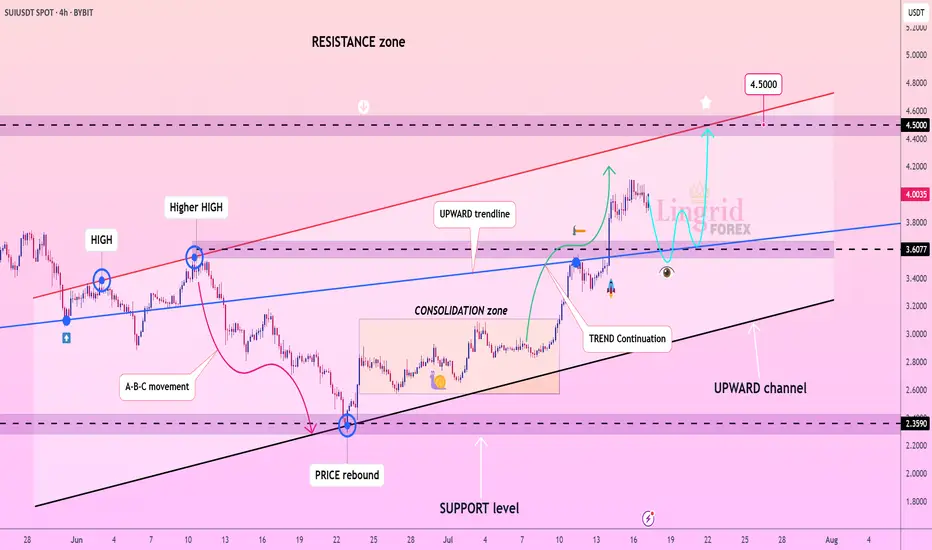
Lingrid | SUIUSDT Pullback and New Higher High PotentialBINANCE:SUIUSDT has rebounded strongly from the support level at $3.60, continuing its bullish sequence of higher highs and higher lows. The price broke out of the consolidation zone and climbed above the blue upward trendline, confirming a continuation of the bullish trend. A retest of the breakout area is likely before a push toward the major resistance zone at $4.50. The structure remains bullish as long as the channel support holds.
📉 Key Levels
Buy trigger: Bounce from $3.60 zone
Buy zone: $3.55–$3.70 (retest range)
Target: $4.50 (red resistance line)
Invalidation: Close below $3.45 trendline support
💡 Risks
Breakdown of the black channel line
Volume divergence or failure to hold the $3.60 support
Broader market weakness across altcoins
If this idea resonates with you or you have your own opinion, traders, hit the comments. I’m excited to read your thoughts!
USD/JPY – Rising Wedge Meets Major ResistanceChart Overview:
USD/JPY is printing a textbook rising wedge formation, typically a bearish pattern—especially when occurring at the top of a major move.
What makes this setup compelling:
Price is testing the upper wedge resistance near the 148.50–149.00 region, a historically reactive zone.
There’s clear confluence with the 200 SMA, horizontal resistance, and wedge structure—all signaling potential exhaustion.
🔍 Key Technicals:
Resistance Zone: 148.00–149.00 (Highlighted Supply Zone)
Rejection Candle Pattern: Recent upper wick shows rejection and buyer fatigue
Bearish Divergence on RSI (14): Price made higher highs, RSI printed lower highs — a classic warning signal
🧠 Educational Note: Rising Wedge Patterns
A rising wedge is a bearish reversal pattern, especially potent when it forms after an extended rally. The structure narrows as buyers lose steam, leading to a likely breakdown once support is breached.
Pro Tip: Always confirm a wedge breakdown with a close below support + volume spike or bearish engulfing.
🔄 Invalidation:
This idea becomes invalid above 150.467, where the wedge breaks upward and price potentially enters a new bullish phase. Marked clearly as “Idea Invalid” on the chart.
🧠 Final Thoughts:
This chart combines price action, pattern structure, RSI divergence, and SMA confluence — a high-probability scenario favored by elite traders. If you trade based on confirmation rather than prediction, this could be a setup to watch closely.
🗣 Drop your thoughts or questions below!
💬 Let’s learn and grow together.

XAU/USD 1H – Bullish Breakout in Play | Eyes on 3,400+XAU/USD has officially broken out of a falling wedge pattern, triggering a classic bullish continuation setup. The rejection off the 0.618–0.705 fib retracement zone ($3,280–$3,290) acted as a powerful launchpad, pushing price above the mid-structure confluence and EMAs.
✅ Key Technical Highlights:
Structure Break: Clear bullish breakout from descending wedge + EMA crossover confirmation (20/50 over 200).
Fibonacci Anchors: Price respected the golden pocket (0.618–0.705), now aiming for full fib extension targets.
Targets:
🎯 TP1: 3,397 (-0.27 fib)
🎯 TP2: 3,440 (-0.618 fib / upper wedge trend-line resistance)
Support Zone: 3,304 – 3,319 (0.5–0.382 fib zone), now acting as fresh demand area.
RSI: Rebounding from 50 with momentum, no divergence, suggesting room for continuation.
🔔 Bullish Scenario:
As long as price holds above the breakout retest zone (≈3,336), momentum favors the bulls with high probability toward 3,400+. Clean higher highs and higher lows confirm trend alignment.
⚠️ Invalidation Level:
Break and close back below 3,304 would shift this from breakout to fakeout — watch for bearish pressure toward 3,280 if that occurs.
📌 Wright Way Outlook:
Momentum is on the side of the bulls. With fundamentals aligned and structure broken, this setup favors precision swing entries with clean RR.
Stay patient, stay tactical. Trade the Wright Way.

Gold – Bullish Structure Still Intact, but Bears are Knocking📉 What happened yesterday?
As expected, XAUUSD made another leg down, breaking even below my buy zone (3330–3335) and hitting a low at 3320. From there, we’re now seeing a modest rebound, with gold trading around 3333 at the time of writing.
📌 Current position:
I'm currently holding a long position. It hovers around break-even – fluctuating between small gains and small losses. Nothing solid yet.
❓ Key question:
Was this just a deep pullback within a bullish structure… or the beginning of a deeper trend reversal?
🔍 Why bulls still have a case:
• Price prints higher lows – bullish structure technically remains intact
• A clean break above 3350 would show short-term strength
• A confirmed break above 3375 would activate a bullish ascending triangle → targeting the 3450 zone
⚠️ But here's the concern:
• Yesterday’s dip to 3330 happened during the New York session (strong volume)
• The bounce from 3320 has been weak, with no follow-through
• Daily candle closed near the lows, showing a long upper wick → a classic bearish signal
• The confluence support now lies at 3310–3320. A red daily candle closing in this area could mean the medium-term trend is flipping
🎯 My trading plan:
Although I'm still holding my buy, if bulls don’t recover 3350 quickly, I will consider closing early. The break of 3310 would shift my bias bearish.
________________________________________
📌 Conclusion:
We’re in a critical zone. The bullish structure isn’t broken yet, but yesterday’s action was not encouraging. If buyers fail to reclaim control soon, the market may be preparing for a deeper correction. Stay sharp. 🚀
Disclosure: I am part of TradeNation's Influencer program and receive a monthly fee for using their TradingView charts in my analyses and educational articles.

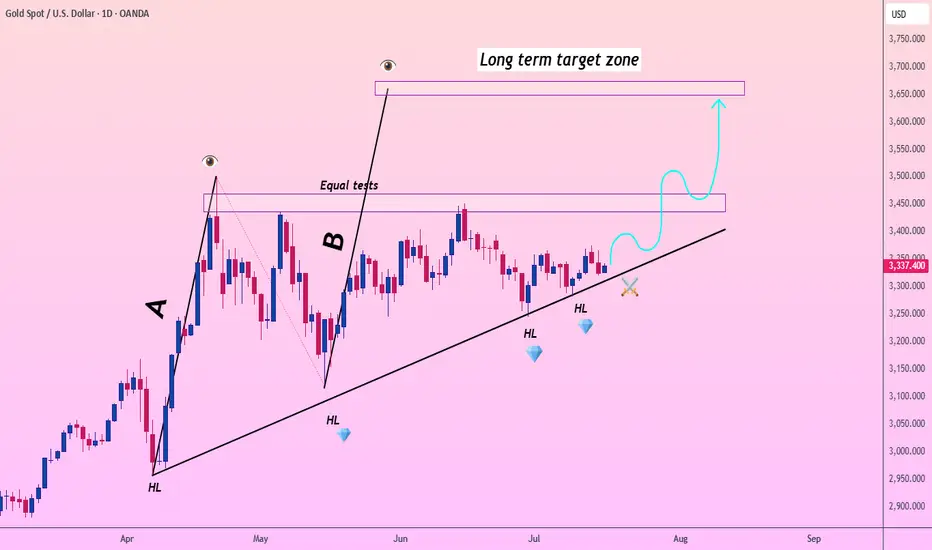
Lingrid | Gold ready to Make BoostOANDA:XAUUSD maintains a solid bullish structure with a clear series of higher lows (HLs) forming along the ascending trendline. After strong impulsive waves labeled A and B, price has repeatedly tested the resistance zone around 3450–3460, creating a double-top-like structure with equal tests. A confirmed close above 3460 would unlock the next leg higher in this ongoing uptrend.
📉 Key Levels
🔼 Buy trigger: Break and close above 3460
🟢 Buy zone: 3320–3340 (near HL and trendline)
🎯 Target: 3650–3700 (long-term breakout objective)
🚫 Invalidation: Drop below 3275 and trendline failure
💡 Risks
-Potential fakeout above 3460 without volume support
-Broadening consolidation range if breakout fails
-Macroeconomic catalysts (FOMC, CPI, geopolitical tensions)
If this idea resonates with you or you have your own opinion, traders, hit the comments. I’m excited to read your thoughts!
EURAUD Flag Forming Below 1.80 – Time to Sell the Rally?📈 The Big Picture
In mid-February, EURAUD exploded to the upside, gaining over 2000 pips in just two weeks. After peaking near 1.85, the pair corrected sharply, returning to more balanced levels around 1.72.
🕰️ What’s happened since?
The market has resumed its climb and just recently made a new local high at 1.81. On the surface, it looks like bulls are still in control – but a closer look reveals warning signs.
🔍 Key structure observations:
• The current rally appears to be a measured move, topping out near the 61.8% Fibonacci retracement of the previous drop
• Price structure is overlapping, suggesting weak momentum
• A large flag pattern is developing – typically bearish in this context
• The pair still trades above the ascending trendline, but a breakdown is looming
📍 Current price: 1.7805
🎯 Swing Trade Plan
From a swing trading perspective, I’m looking to sell rallies near the 1.80 zone, with:
• Negation: if the price breaks clearly above the recent high
• Target: the recent low around 1.7250 – where the last correction ended
________________________________________
📌 Conclusion:
EURAUD may have exhausted its bullish energy. The technical picture suggests we are in the late stage of the rally, with bearish patterns stacking up. Unless bulls manage a clean breakout above 1.80, this looks like a great place to position for a medium-term reversal. 🚀
Disclosure: I am part of TradeNation's Influencer program and receive a monthly fee for using their TradingView charts in my analyses and educational articles.
Gold Pullback in Play – Still Aiming for 3450 📌 In yesterday’s analysis, I argued that bulls likely won the battle and that a new leg up toward 3450 could be next from a swing trade perspective. I also mentioned that buying dips remains the preferred strategy.
And indeed – we got that dip.
📉 Price pulled back to 3340 and bounced,
but it hasn’t yet touched my key area of interest: 3330–3335.
What now?
My view stays the same –I still expect a move toward the 3450 zone,but I also believe a deeper dip toward support is still on the table – likely a liquidity grab before the next leg up.
Trading Plan:
✅ Buying dips remains the core strategy
🚫 Invalidation only comes on a break below 3305–3310
🎯 Upside target remains well above 3400, aiming for 1000+ pips
Let’s stay focused and let price come to us.
🚀
Disclosure: I am part of TradeNation's Influencer program and receive a monthly fee for using their TradingView charts in my analyses and educational articles.

GOLD / XAUUSD TodayGOLD / XAUUSD Today change trend to long setup.
My first is on chart.
I remember today is Friday
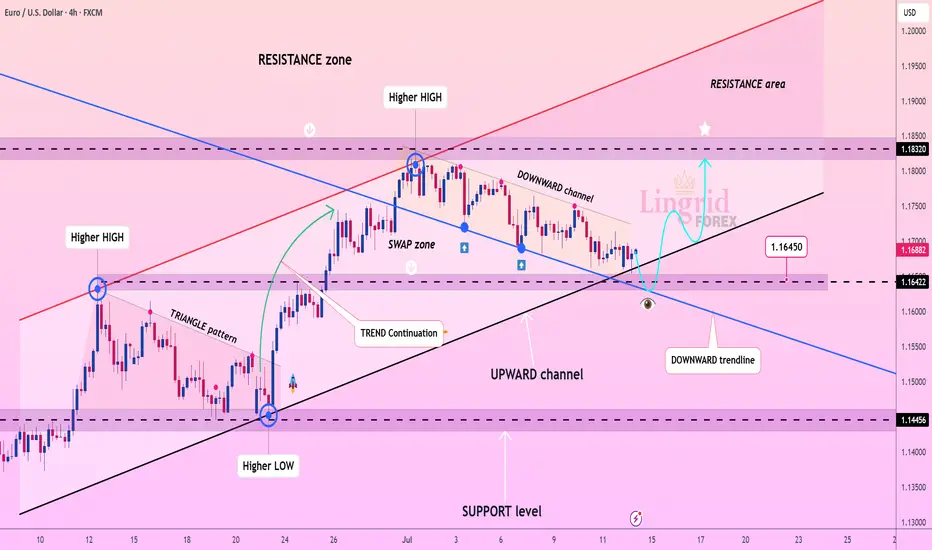
Lingrid | EURUSD Pulled Back to Key Support levelFX:EURUSD is approaching a major confluence zone at 1.16422 where the downward channel meets the upward trendline and horizontal support. The structure remains bullish with a sequence of higher highs and higher lows, and the current pullback fits within a healthy correction phase. A strong bounce from this triple-support region could trigger a reversal toward 1.18320, validating the continuation of the broader uptrend. All eyes are now on the 1.16450 reaction point for early momentum signs.
📉 Key Levels
Buy trigger: bullish reaction from 1.16422 support zone
Buy zone: 1.16200–1.16500 (channel base + trendline + demand)
Target: 1.18320
Invalidation: confirmed 4H close below 1.1600 breaks upward structure
💡 Risks
Deeper push below the trendline may trap early buyers
Low liquidity during the bounce can cause fakeouts
Unexpected USD strength could stall recovery momentum
If this idea resonates with you or you have your own opinion, traders, hit the comments. I’m excited to read your thoughts!
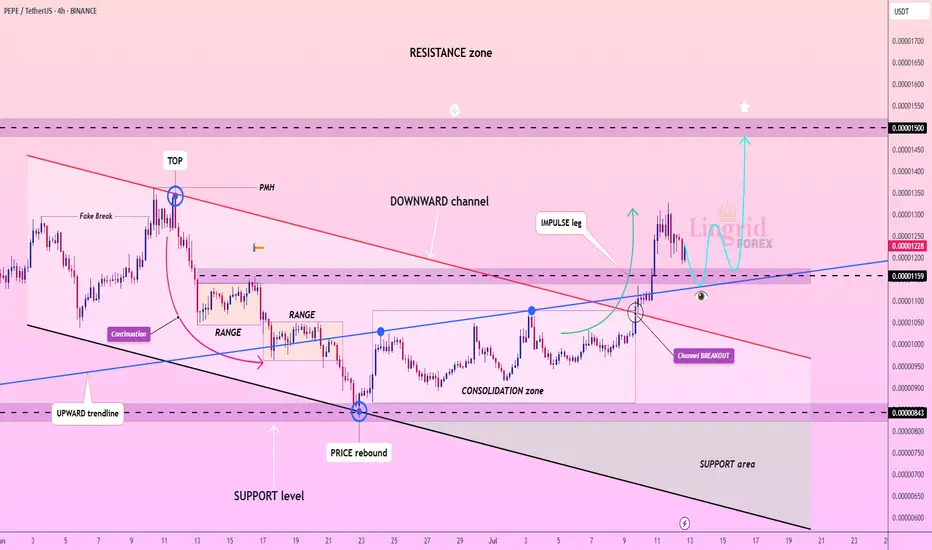
Lingrid | PEPEUSDT Corrective Channel BreakoutThe price perfectly fulfilled my previous idea . BINANCE:PEPEUSDT rebounded powerfully from the 0.00000843 support and broke out of the long-standing downward channel, marking the start of a bullish impulse leg. Price is now holding above the breakout point and consolidating above the 0.00001159 structure, setting the stage for continuation. As long as buyers defend this reclaimed level, price could attempt another leg toward the upper resistance zone at 0.00001500. Structure and volume suggest that accumulation is complete and bulls are in control.
📉 Key Levels
Buy trigger: sustained support above 0.00001159 and breakout follow-through
Buy zone: 0.00001100–0.00001159 (former resistance turned support)
Target: 0.00001500
Invalidation: breakdown below 0.00001100 risks trapping longs
💡 Risks
Volatility around breakout retests may shake weak hands
Failure to reclaim momentum at 0.00001250 could stall the push
Re-entry into the old consolidation range may delay upside momentum
If this idea resonates with you or you have your own opinion, traders, hit the comments. I’m excited to read your thoughts!
Lingrid | GOLD potential Bullish Move From Confluence ZoneOANDA:XAUUSD is forming a higher low above trend support, following a breakout from the consolidation zone and a bullish continuation leg. Price is currently pulling back toward the 3345–3350 region, which aligns with the previous breakout and key structure support. A successful retest of this area would provide confirmation for a renewed push toward the 3400 resistance zone. Momentum favors further upside if bulls defend the support and reclaim bullish control.
📉 Key Levels
Buy trigger: bullish bounce from 3345 with reclaim above 3360
Buy zone: 3345–3360 (trend support and previous breakout)
Target: 3400
Invalidation: drop below 3345 with sustained pressure cancels bullish thesis
💡 Risks
Weak volume on bounce could lead to range-bound price action
Global macro shifts may interfere with expected trend continuation
Another fake breakout near 3400 could trigger sharp rejection
If this idea resonates with you or you have your own opinion, traders, hit the comments. I’m excited to read your thoughts!

USD/JPY – Major Reversal Zone | Potential Top FormingUSD/JPY has entered a critical supply zone near 148.700 an area that has historically acted as strong resistance. The confluence of trendline rejection, overextended RSI, and multiple moving average rejections suggest a potential short-term top is forming.
🔍 Technical Breakdown:
Macro Pattern: Price is forming a broadening wedge with repeated rejections from the upper resistance trendline (multi-touch).
Supply Zone: The 148.400–148.700 range has acted as a liquidity grab zone historically — current reaction is showing early signs of exhaustion.
Bearish Confluence:
Price stalling below upper wedge resistance.
RSI sitting near overbought territory (68.75) with bearish divergence brewing.
200 SMA overhead and flattening, acting as dynamic resistance.
🎯 Trade Outlook (Short Bias):
Idea Triggered: If price fails to break and close above 148.700 with strong bullish volume, sellers are likely to step in.
Target 1: 144.200 (mid-wedge support)
Target 2: 139.000 (base of structure & ascending trendline)
Invalidation: Daily close above 148.70–149.00 — would indicate potential continuation to new highs.
🔔 Watch For:
Bearish engulfing or rising wedge breakdowns on lower timeframes (4H / 1H).
RSI divergence confirmation.
Volume drying out near resistance.
📌 Wright Way Insight:
This is a high-probability fade setup at a well-defined resistance zone. Unless bulls break structure convincingly, momentum is likely to shift down — favoring strategic short entries.
Let the chart speak. Don’t chase — trade the reversal, trade the Wright Way.

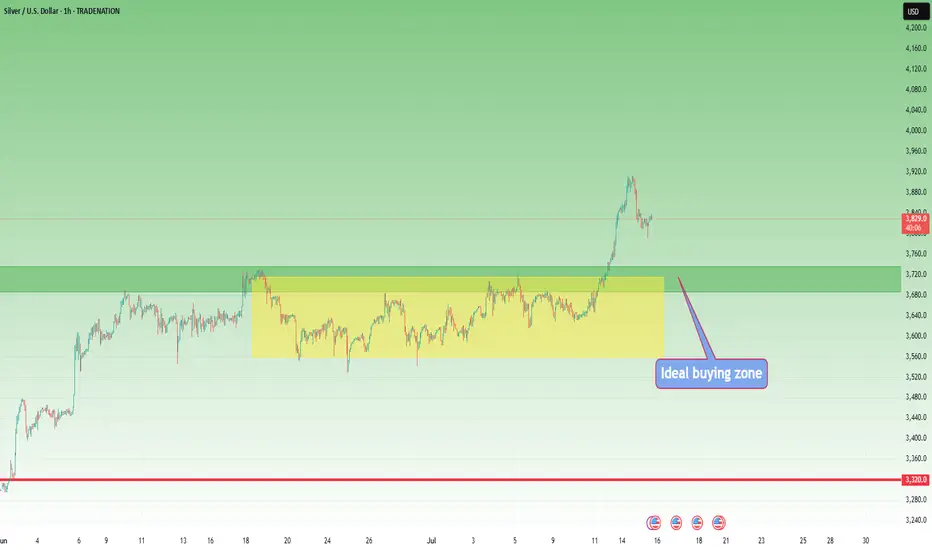
Silver Update (XAGUSD): Eyeing the Next Move After the $39 SurgeAs mentioned in my Friday analysis, Silver ( TRADENATION:EURUSD XAGUSD) was preparing for an important breakout — and indeed, the market delivered. The clean break through resistance triggered a strong acceleration, pushing the metal up to $39, pretty close to the psychological $40 level.
Now, we’re seeing a healthy correction after this steep rise, and this could turn into a buying opportunity for the bulls.
📌 Key support zone:
The ideal area to watch is between $37.20 and $37.50 — this is the sweet spot where bulls might step back in.
But be aware:
👉 After strong breakouts, the broken resistance doesn’t always get retested — sometimes the price rebounds from higher levels.
🎯 Plan of Action:
• Monitor price action under $38
• Watch for reaction patterns and structure shifts
• Don’t force entries — let the market confirm
Silver remains strong as long as the structure holds, and this pullback might just be the market catching its breath before another leg up. 🚀
Disclosure: I am part of TradeNation's Influencer program and receive a monthly fee for using their TradingView charts in my analyses and educational articles.
Gold Bulls Are Back – Eyes on 3450 GOLD – Bulls Regain Control After Defending 3280
🟡 Last week was a dynamic one for Gold traders.
The week began with signs of an upside reversal, followed by a drop to test the 3280 support. That dip held—and from there, we saw a strong push higher, ending the week right at the top of the range.
📌 Friday’s close left behind a continuation Pin Bar on the weekly chart – a strong signal in favor of the bulls.
- This week started with a new local high at 3375,but we’re now seeing a pullback in the 3355 area at the time of writing.
What’s next?
Given last week’s price action, bulls seem to have won the battle and appear ready to challenge the 3400 level.
My plan for this week:
I’m looking to buy dips, and as long as nothing changes, my target is the 3450 zone.
Disclosure: I am part of TradeNation's Influencer program and receive a monthly fee for using their TradingView charts in my analyses and educational articles.

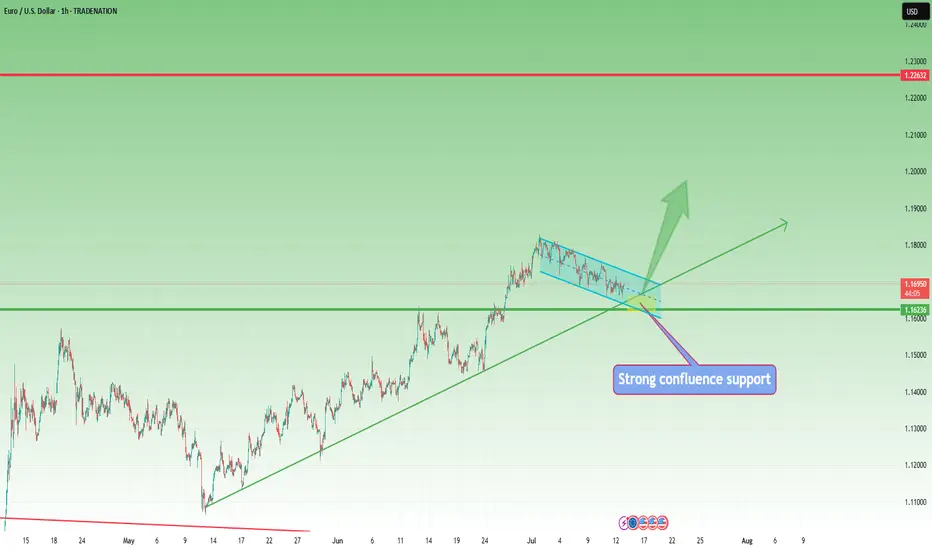
EUR/USD –Bullish Flag After Long Term Trend Shift: Is 1.20 Next?📌 In my previous EUR/USD analysis, I mentioned that the long-term trend likely reversed, and we could see a move toward the 1.23 zone in the medium to longer term.
That view is playing out.
Recently, the pair printed a new local high above 1.18, confirming the trend change.
📉 After this rise, EUR/USD pulled back –but the structure is clearly corrective: overlapping and a classic bullish flag formation.
What's next?
This correction looks close to completion, and bulls may soon return to push toward the key 1.20 level.
Trading Plan:
The 1.1620–1.1650 area stands out as a strong confluence zone – ideal for looking for buying opportunities.
The trend has changed. The setup is forming. Now it’s about timing.
Disclosure: I am part of TradeNation's Influencer program and receive a monthly fee for using their TradingView charts in my analyses and educational articles.
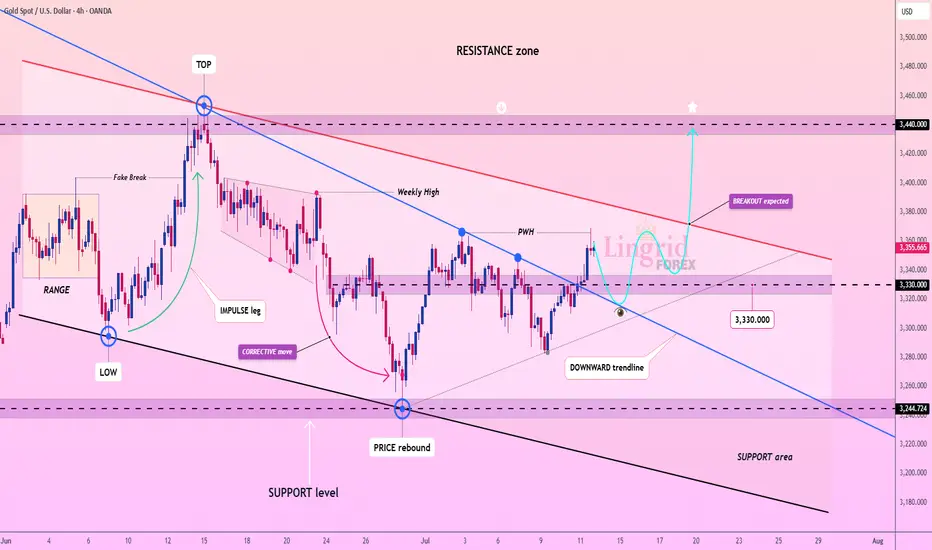
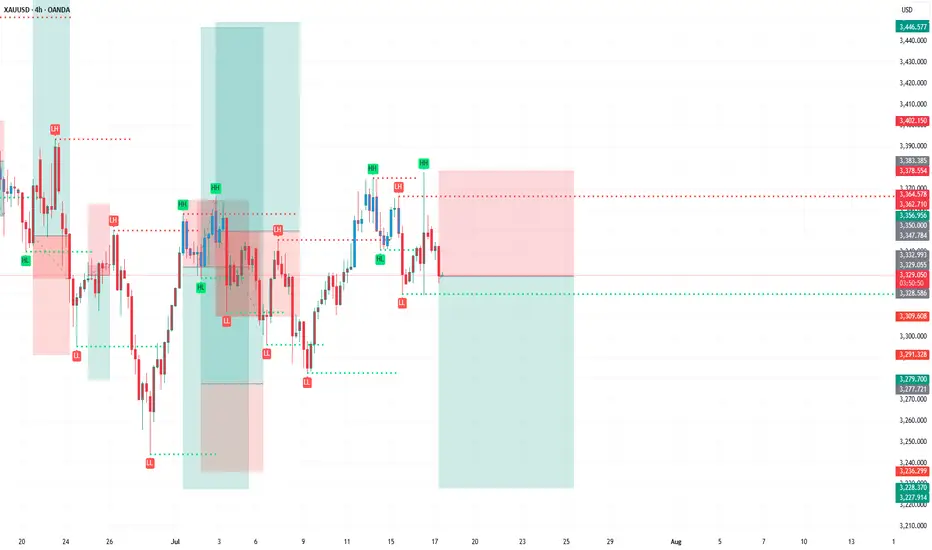
Lingrid | GOLD Weekly Market AnalysisOANDA:XAUUSD markets are navigating through a technical consolidation phase following the recent rally, maintaining underlying bullish momentum despite current volatility. The precious metal is trading between critical levels that will determine the next major directional move.
4H chart reveals a complex structure with a retest of the resistance zone around $3,440, gold has initiated a corrective move along the descending channel. The current setup suggests a healthy pullback toward the support zone near $3,330. Breaking above the downward trendline will constitute an important technical signal for bullish continuation.
The higher timeframe provides a broader perspective with an A-B pattern currently forming. Equal tests at resistance levels indicate significant institutional accumulation. The rising trendline (HL) continues to support prices, confirming the long-term bullish structure. The target zone above $3,600 remains viable if gold can successfully break through the current resistance cluster.
Key levels to monitor include the $3,330 support and $3,440 resistance. A decisive break above previous week high could trigger the next leg toward $3,400-$3,450, while failure to hold support might see a deeper correction toward $3,250. The overall technical picture suggests this consolidation represents a continuation pattern within the broader uptrend. If this idea resonates with you or you have your own opinion, traders, hit the comments. I’m excited to read your thoughts!