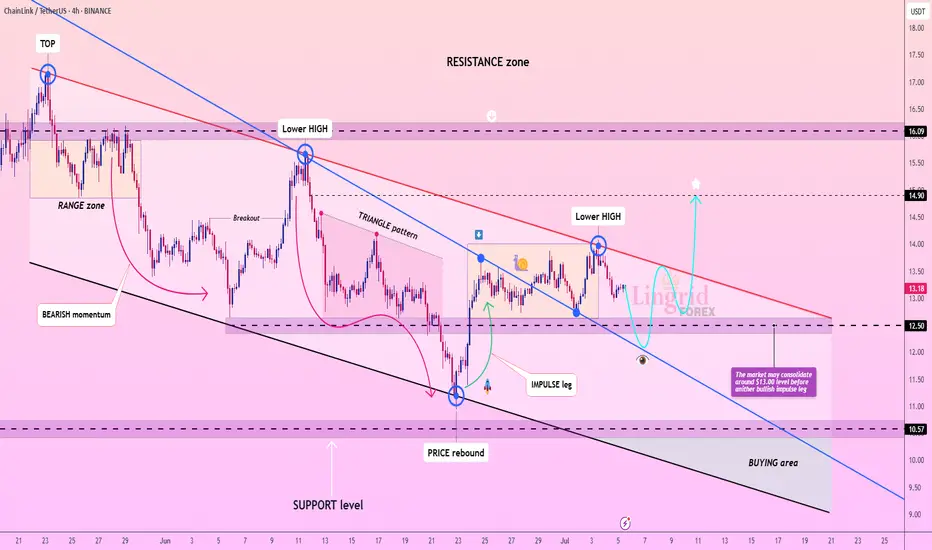
Lingrid | LINKUSDT potential Bullish BreakoutBINANCE:LINKUSDT has formed a sequence of lower highs beneath a descending red trendline, indicating that bearish pressure remains dominant. After a recent rejection near $13.80, price action is now pulling back toward the $12.50–$13.00 range where consolidation is likely. The structure suggests a potential rebound from the lower boundary before another bullish push into the resistance zone near $14.90.
📉 Key Levels
Buy zone: 12.50–13.00 (support + prior consolidation)
Sell trigger: loss of 12.50 support with strong volume
Target: 14.90 – major horizontal resistance
Buy trigger: bullish reversal from the 12.50 support zone
💡 Risks
Breakdown below $12.50 could send price toward $10.57
Lower highs pattern still intact unless $14.00 is cleared
Mid-range chop could delay trend continuation or trap longs
If this idea resonates with you or you have your own opinion, traders, hit the comments. I’m excited to read your thoughts!
Signalservice
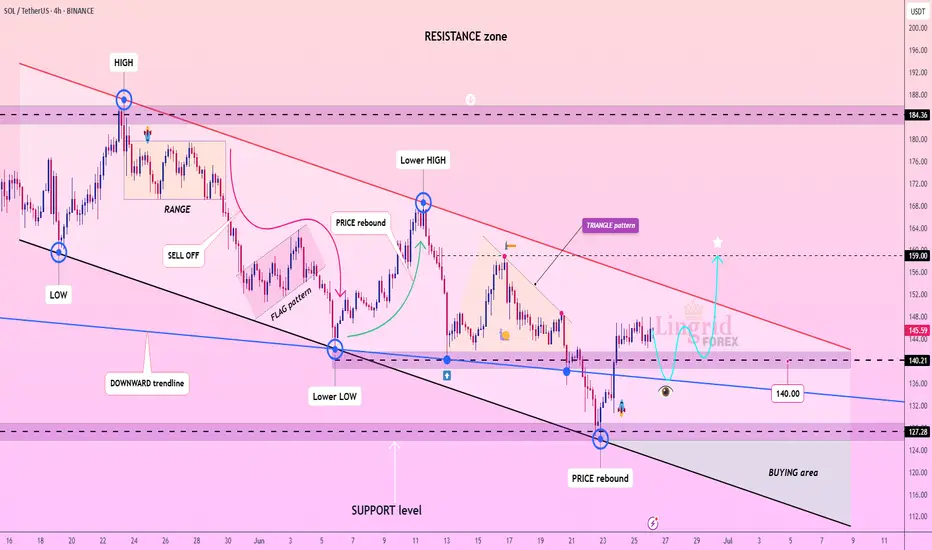
Lingrid | SOLUSDT possible Channel BreakoutBINANCE:SOLUSDT is showing early signs of recovery after rebounding from the 127 support zone and reclaiming structure near the 140 level. Price is now consolidating below the red descending trendline, which acts as dynamic resistance. A breakout above 145 could confirm bullish reversal and target the 159 resistance zone as indicated by the star projection. The key lies in whether buyers can sustain pressure above the 140 zone.
📈 Key Levels
Buy zone: 138–142
Sell trigger: break below 127
Target: 159
Buy trigger: breakout and close above 145 trendline
💡 Risks
Failure to hold above 140 may lead to fresh lows
Downtrend may resume if price gets rejected at 145
Low volume breakout may signal a bull trap
If this idea resonates with you or you have your own opinion, traders, hit the comments. I’m excited to read your thoughts!
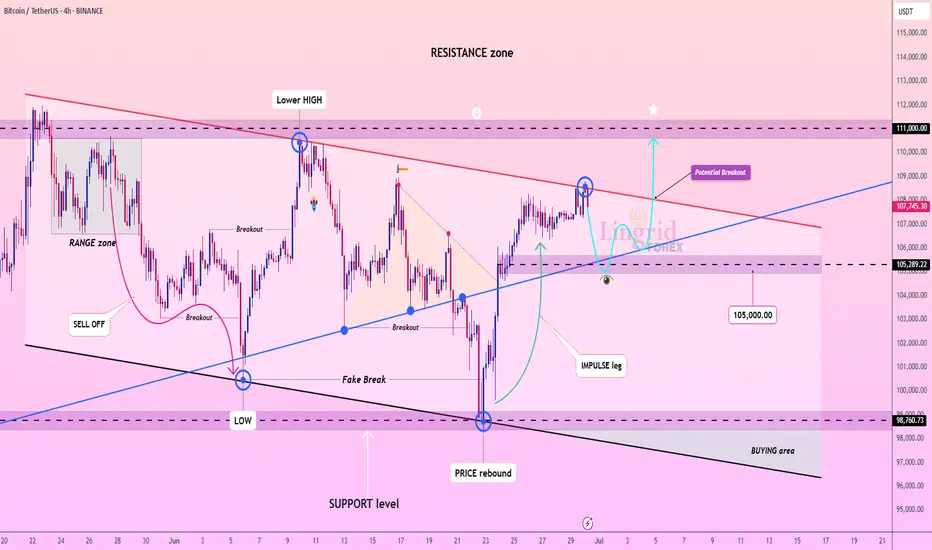
Lingrid | BTCUSDT possible Channel Break - Upside Surge The price perfectly fulfilled my last idea . BINANCE:BTCUSDT is pulling back slightly after rejecting the descending red trendline near the 108,000 level, while remaining above the breakout zone around 105,000. The structure suggests a potential bullish continuation if the price holds this level and forms a higher low. A successful breakout above 108,000 could ignite a move toward the 111,000 resistance band.
📈 Key Levels
Buy zone: 105,000–105,300
Sell trigger: breakdown below 105,000
Target: 111,000
Buy trigger: breakout and retest above 108,000 with strong momentum
💡 Risks
Failure to hold 105,000 reopens path to 98,700
Bearish rejection at 108,000 could maintain lower high structure
Weak volume breakout may lead to a bull trap under 111,000
If this idea resonates with you or you have your own opinion, traders, hit the comments. I’m excited to read your thoughts!
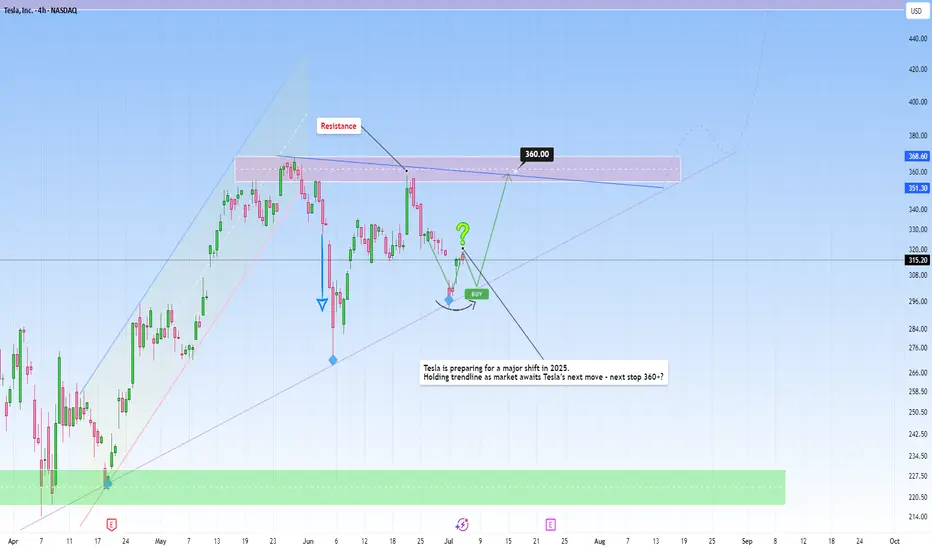
Big Bounce or Breakdown? Tesla at the edgeTesla is at crossroads right now, where the next move will define its near-term trajectory.
After an extended correction phase, TSLA is reaching a key zone around the $300 level, one that held price well during recent pullbacks.
Although recent tax news caused a decline in the price, belief in Tesla’s longer-term trajectory remains strong among many investors.
At the same time, many investors are carefully monitoring the support near $215 to $230, another important zone. This level has acted as a reliable level during past pullbacks, as it suggests the stock has a solid base, despite short-term ups and downs. For these investors, maintaining their positions through consolidation is a test of patience and belief in Tesla’s longer-term trajectory. If Tesla breaks below the $230 support zone, some investors may view this as an opportunity to take advantage once again.
Given the current setup, it’s best to be cautious and wait for confirmation before looking to get involved.
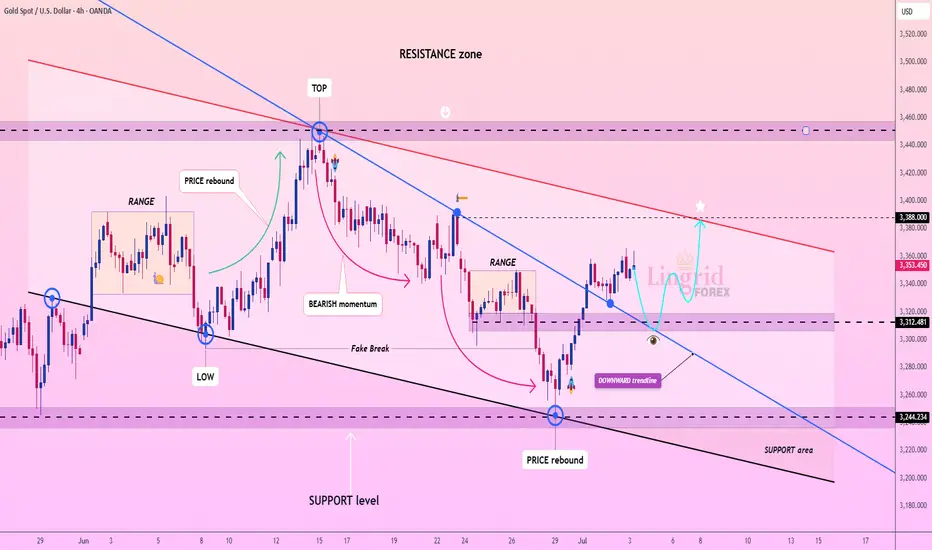
Lingrid | GOLD Pre-NFP Price Action AnalysisThe price perfectly fulfilled my last idea . OANDA:XAUUSD rebounded strongly from the 3244 support area, breaking above the downward trendline and pushing into the mid-resistance band. The price is currently testing 3353 and could pull back slightly before retesting the 3388 key resistance level. A sustained breakout above that red trendline would open the door for a run toward 3450.
📈 Key Levels
Buy zone: 3312–3330 (post-breakout retest area)
Sell trigger: break below 3312 and close under trendline
Target: 3388 with potential extension to 3450
Buy trigger: confirmed bullish bounce from 3312 and momentum above 3353
💡 Risks
Resistance at 3388 may cause rejection if volume fades
Downward trendline remains a structural cap unless fully broken
False breakout could return price back to 3244 zone quickly
If this idea resonates with you or you have your own opinion, traders, hit the comments. I’m excited to read your thoughts!
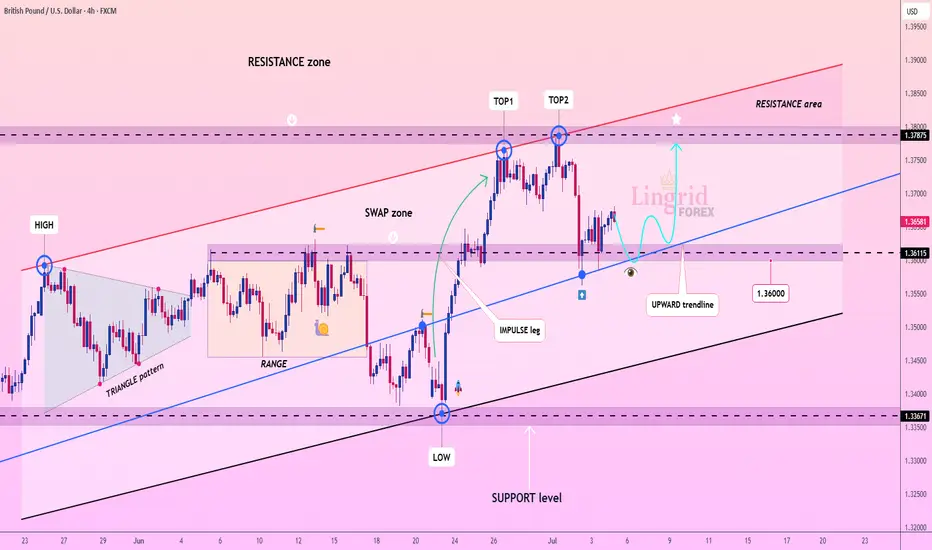
Lingrid | GBPUSD Potential Bounce at Key Psychological LevelThe price perfectly fulfilled my previous idea . FX:GBPUSD is consolidating above the upward trendline after forming a local double top near the 1.3787 resistance zone. The price is currently retesting the 1.3611–1.3660 support cluster, aligned with the trendline and previous impulse breakout area. A successful bounce from this zone could initiate another rally toward the upper boundary of the resistance range.
📈 Key Levels
Buy zone: 1.3600–1.3660 (trendline + support overlap)
Sell trigger: breakdown below 1.3600
Target: 1.3787 – resistance ceiling with prior rejection
Buy trigger: bullish reaction from 1.3611 area with strong candle close
💡 Risks
Breakdown below 1.3600 may expose deeper retracement to 1.3367
Repeated rejection at 1.3787 could form a longer-term double top
Macro data surprises could shift short-term direction suddenly
If this idea resonates with you or you have your own opinion, traders, hit the comments. I’m excited to read your thoughts!
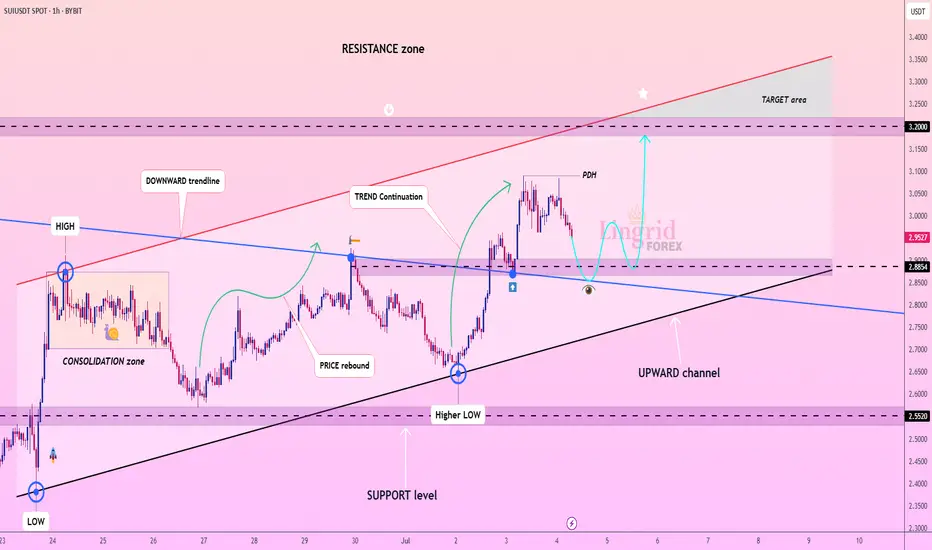
Lingrid | SUIUSDT Pullback Setup: Expansion Trade OpportunityBINANCE:SUIUSDT is forming a bullish continuation structure within an upward channel, with the price pulling back after reaching a recent peak. Current support is found around 2.885, aligned with the upward trendline and prior breakout zone. If the price rebounds from this cluster, it may target the upper resistance near 3.20.
📈 Key Levels
Buy zone: 2.85–2.89 (support + trendline confluence)
Sell trigger: break and close below 2.85
Target: 3.20 within the upper boundary of the resistance zone
Buy trigger: bullish bounce from trendline and higher low confirmation
💡 Risks
Failure to hold above 2.88 support may invalidate the upward bias
Price volatility near trendline could trap early buyers
Rejection from 3.20 might trigger sharp retracement back to 2.70
If this idea resonates with you or you have your own opinion, traders, hit the comments. I’m excited to read your thoughts!
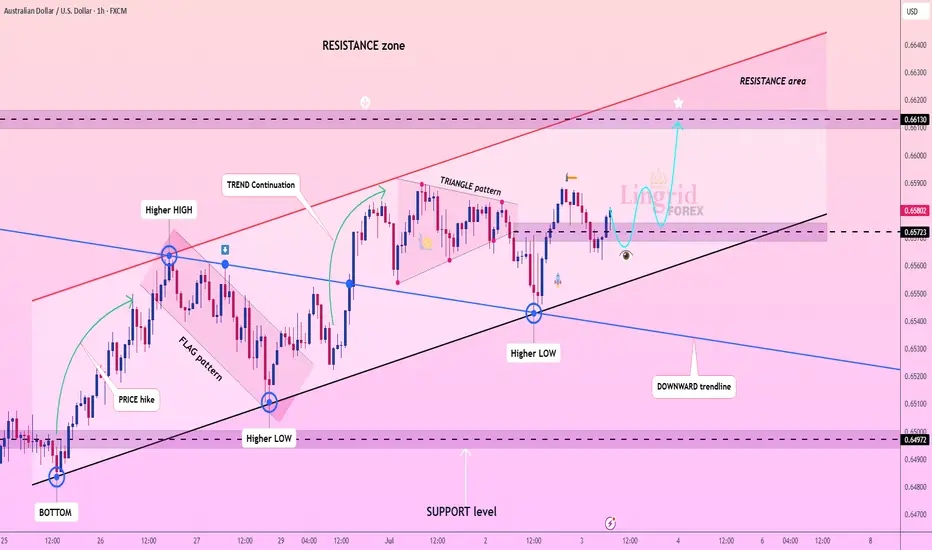
Lingrid | AUDUSD capitalizing on the BULLISH ContinuationOANDA:AUDUSD is forming higher lows above the key ascending trendline, showing clear signs of bullish structure continuation. After breaking out of the flag pattern and triangle, price is now consolidating just above the 0.6572 support zone. If buyers hold this level, a breakout toward the 0.6613 resistance area becomes increasingly likely.
📈 Key Levels
Buy zone: 0.6572–0.6580 (above trendline)
Sell trigger: break below 0.6572 trendline support
Target: 0.6613 resistance area
Buy trigger: bounce from trendline and continuation above minor resistance
💡 Risks
Failure to hold the ascending trendline may trigger deeper correction
Low volume during breakout attempts could invalidate the move
Strong resistance at 0.6613 may cause short-term rejection
If this idea resonates with you or you have your own opinion, traders, hit the comments. I’m excited to read your thoughts!
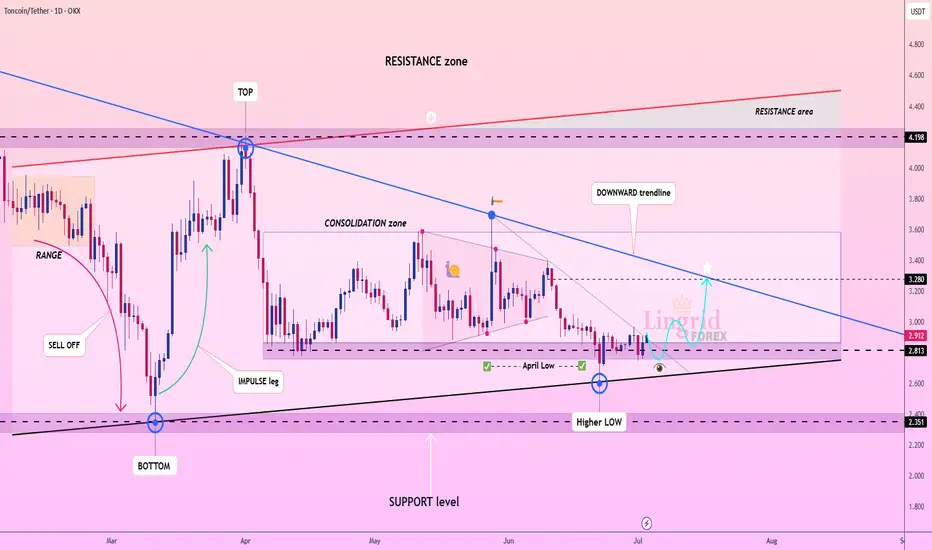
Lingrid | TONUSDT Market Bottom Established at Demand ZoneOKX:TONUSDT is rebounding from the April low near the 2.81 zone after holding a higher low structure above key support. Price remains compressed within a long-term consolidation, but the higher lows and recent bounce signal potential for a breakout attempt. A move toward the 3.28 level would test the major downward trendline and open the path toward the upper resistance range.
📈 Key Levels
Buy zone: 2.81–2.90 (above April low)
Sell trigger: rejection at 3.28 trendline resistance
Target: 3.28 breakout zone
Buy trigger: daily close above 3.28 confirms bullish reversal
💡 Risks
Repeated failure to break the trendline may reintroduce downside pressure
Momentum could stall without volume confirmation
Strong resistance between 3.28–3.40 may limit breakout attempts
If this idea resonates with you or you have your own opinion, traders, hit the comments. I’m excited to read your thoughts!
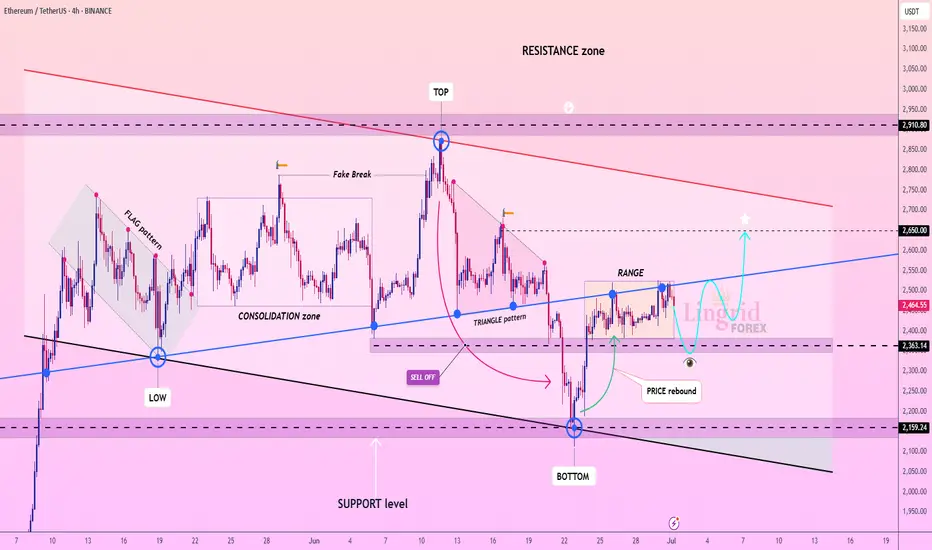
Lingrid | ETHUSDT Price Compression and Expansion PhasesBINANCE:ETHUSDT is struggling to hold gains after a rejection from the top of the range, with price retracing back toward the breakout point and key trendline support. The structure remains intact above 2,363, where bulls may attempt another rebound. A sustained move above the blue ascending trendline would open the way toward the 2,650 target, completing the projected rebound path.
📈 Key Levels
Buy zone: 2,363–2,400
Sell trigger: breakdown below 2,363
Target: 2,650
Buy trigger: breakout and retest of 2,475–2,500 with volume
💡 Risks
Failure to hold the trendline could push price toward 2,159
Weak follow-through may stall near 2,550
Bearish engulfing from current range top can trap early buyers
If this idea resonates with you or you have your own opinion, traders, hit the comments. I’m excited to read your thoughts!
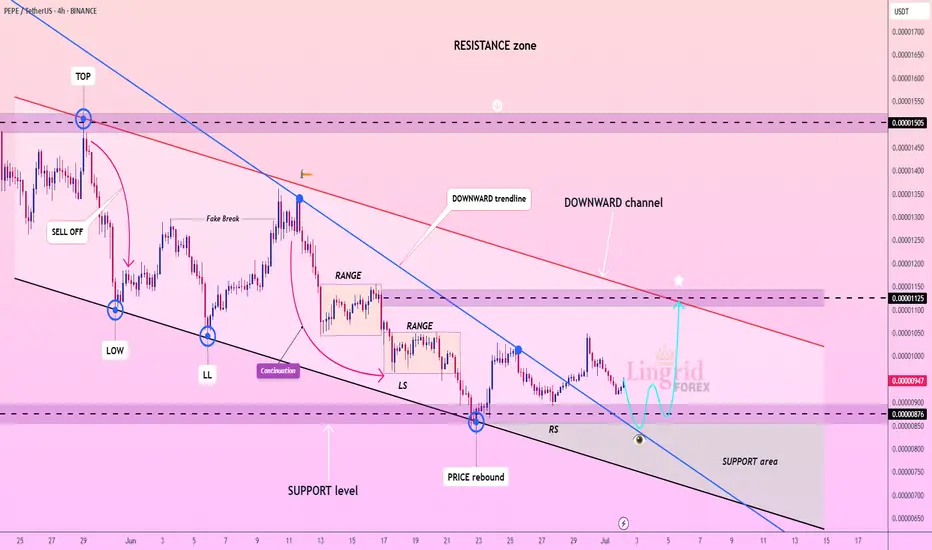
Lingrid | PEPEUSDT Inverse Head and Shoulder. Bullish Reversal ?BINANCE:PEPEUSDT is forming a potential reversal setup after rebounding from the 0.00000876 support within a well-defined downward channel. Price action shows signs of accumulation with a right shoulder (RS) formation and a potential breakout brewing above the descending blue trendline. A clean push toward the 0.00001125 resistance would confirm the pattern and may trigger further upside toward the red trendline.
📈 Key Levels
Buy zone: 0.00000876–0.00000900
Sell trigger: failure below 0.00000876
Target: 0.00001125
Buy trigger: breakout and retest of 0.00000960–0.00000980
💡 Risks
Strong resistance from downward channel could limit upside
Breakout failure may trap buyers near 0.00000980
Low liquidity increases volatility risk near major levels
If this idea resonates with you or you have your own opinion, traders, hit the comments. I’m excited to read your thoughts!
Lingrid | GOLD Weekly Analysis: Risk-Off Trade Unwinds OANDA:XAUUSD endured another challenging week as the Iran-Israel ceasefire continued to diminish safe-haven demand, while robust equity market performance drew capital away from precious metals. The risk-on environment has fundamentally shifted investor priorities, with growth assets overshadowing traditional defensive plays like gold.
The chart reveals gold testing the crucial $3,270 support zone, representing a significant confluence level where the upward trendline intersects with horizontal support. This area has historically provided strong buying interest and serves as a critical inflection point for gold's medium-term direction.
From a broader perspective, the 4H chart shows gold approaching the lower boundary of its established upward channel around $3,250. The pullback from the HH near $3,450 has accelerated through multiple support levels, with the downward trendline acting as dynamic support to any recovery attempts.
A decisive break below the $3,235 - $3,250 support confluence could trigger further selling toward the $3,200 major support zone. However, the long-term upward trendline dating back several months provides substantial technical backing. A successful defense of current levels would likely attract value buyers and could spark a relief rally toward the $3,330-$3,350 resistance area, particularly if geopolitical tensions resurface or equity markets show signs of fatigue.
If this idea resonates with you or you have your own opinion, traders, hit the comments. I’m excited to read your thoughts!

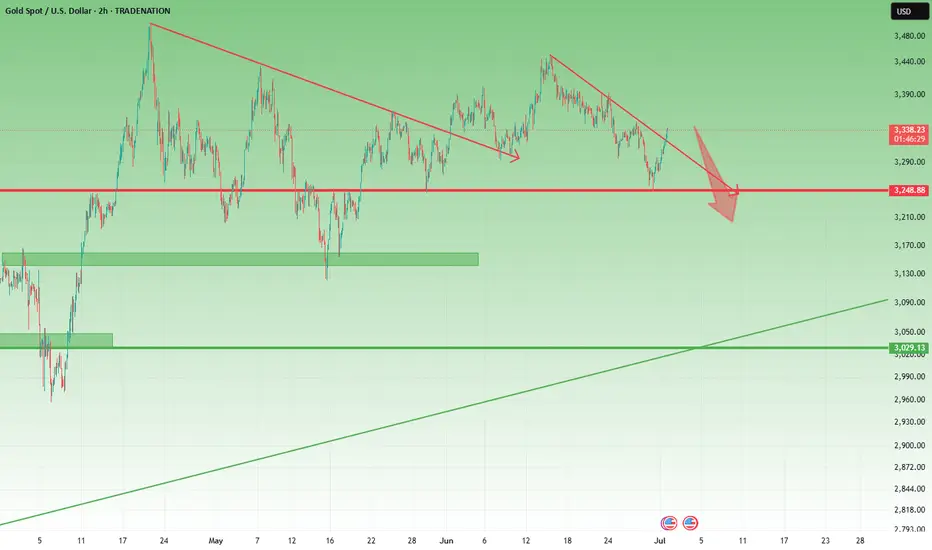
XAUUSD – Correction or Reversal? 1. What happened yesterday
As expected, Gold started to rise after finding support at 3250. The move up played out perfectly, reaching the resistance area highlighted in yesterday’s analysis — around 3320–3340.
________________________________________
2. The key question today
Is this just a correction in a bearish trend, or the start of reversal?
________________________________________
3. Why I remain bearish
• On the weekly chart, structure still leans bearish
• On lower time frames, the bounce looks corrective — not impulsive
• No breakout above 3360 yet, which would be needed to shift the bias
• A move back below 3320 would likely trigger renewed selling
• If that happens, 3250 could be tested again quickly
We need to respect the bounce — but not overreact to it.
________________________________________
4. Trading plan
My bias remains bearish as long as price stays under 3360.
However, if we get a daily close above 3360, I’ll pause and re-evaluate the short bias. The market would then be signaling a potential trend shift.
________________________________________
5. Final thoughts 🚀
This is a key moment for gold. We’re at resistance zone but not broken above yet.
Until proven otherwise, the trend remains down — and rallies into 3340 zone should be considered selling opportunities.
Disclosure: I am part of TradeNation's Influencer program and receive a monthly fee for using their TradingView charts in my analyses and educational articles.
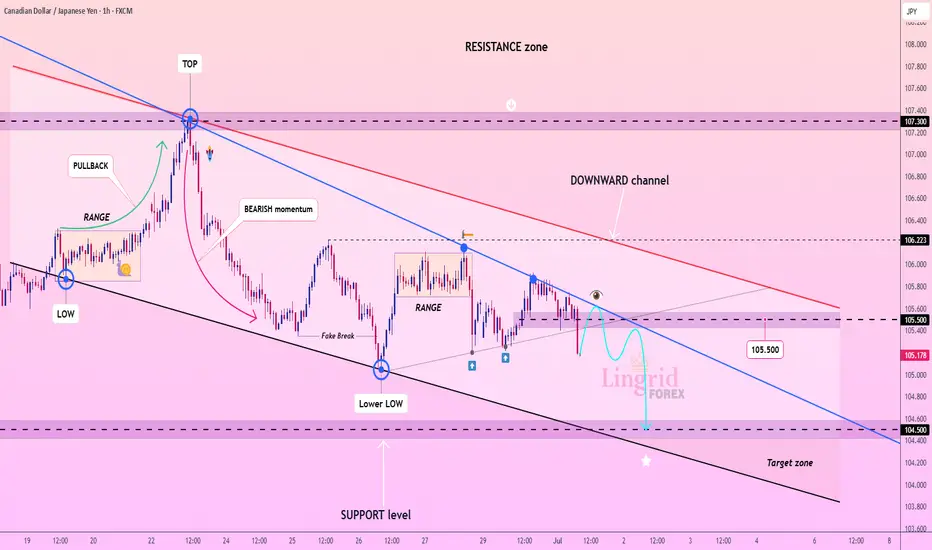
Lingrid | CADJPY Potential Downside Move After BreakoutThe price perfectly fulfilled my previous idea . FX:CADJPY is facing continuous rejection from the descending trendline, maintaining its position within the downward channel. Price is struggling to hold above the 105.00 region, showing signs of distribution after a fake breakout and lower high formation. A sustained breakdown below 105.00 would confirm the bearish continuation targeting the 104.00–104.50 zone.
📉 Key Levels
Sell zone: 105.40–105.50
Buy trigger: breakout above 105.60 and retest
Target: 104.500
Sell trigger: confirmed break and close below 105.00
⚠️ Risks
False breakdown could lead to sharp recovery toward 106.20
Oversold conditions may slow downside near 104.50
Range re-accumulation above 105.00 could trap short-sellers
Thin liquidity around 104.20 might cause price spikes
If this idea resonates with you or you have your own opinion, traders, hit the comments. I’m excited to read your thoughts!
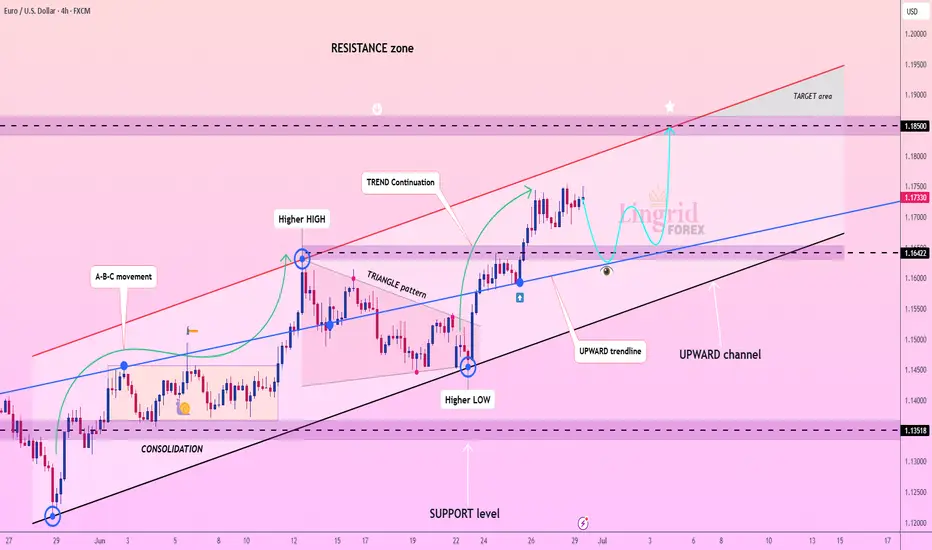
Lingrid | EURUSD Pullback - Continuation Trading OpportunityFX:EURUSD is consolidating above the upward trendline after forming a higher high and pulling back toward dynamic support. Price structure remains bullish within the rising channel, and a rebound from the 1.1640–1.1700 zone could trigger the next leg higher. If bulls regain momentum, the pair may aim for the 1.1850 resistance ceiling within the target area.
📈 Key Levels
Buy zone: 1.1640–1.1700
Sell trigger: breakdown below 1.1640
Target: 1.1850
Buy trigger: breakout and retest above 1.1750 with strong momentum
💡 Risks
Breakdown below the upward channel may signal a broader reversal
Weak bullish reaction from trendline could stall upside progress
Failure to reclaim 1.1750 resistance keeps price vulnerable to deeper pullbacks
If this idea resonates with you or you have your own opinion, traders, hit the comments. I’m excited to read your thoughts!
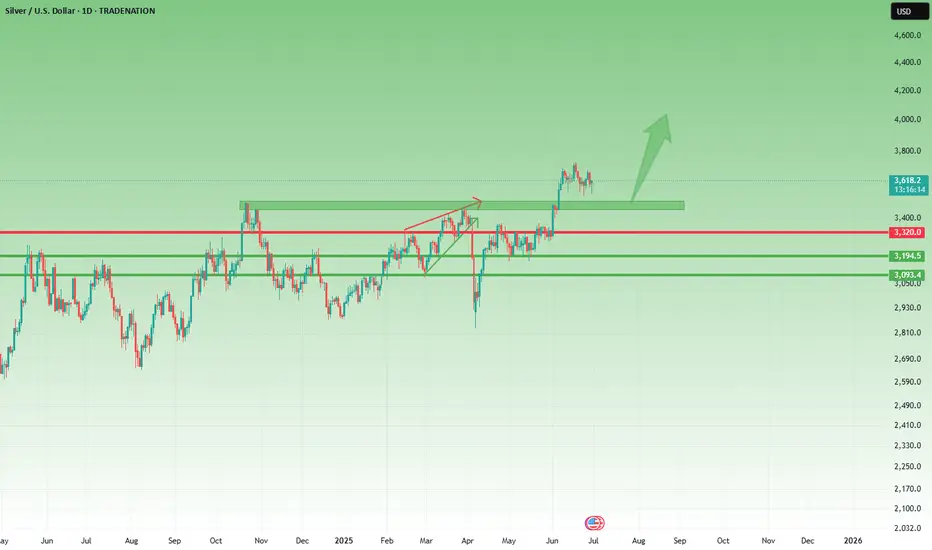
XAGUSD – Bullish Setup for a Move Toward 40 1. What happened recently
After the massive selloff in early April, Silver (XAGUSD) reversed aggressively — gaining nearly 10,000 pips and breaking into multi-decade highs near 38. That kind of move is not noise. It’s power.
The month of June brought consolidation, with price slowly correcting and stabilizing. But this doesn’t look like distribution — it looks like new accumulation.
2. The key question
Is Silver building a base for the next breakout, or has the rally run out of steam?
3. Why I expect another leg up
- 35.00 is now acting as a solid support — tested, respected
- The correction has been shallow, typical for a bull rectangle structure
- Momentum remains on the buyers’ side — no major breakdown signs
- If buyers step in strongly, the next target is clearly the 40.00 psychological level
- This is a textbook bullish continuation setup.
4. Trading plan
Swing traders should watch the 35.00–35.20 zone for buying opportunities.
The risk/reward is attractive — with a potential for +5000 pips on a move toward 40, while keeping stops under the base.
Buy the dips — not the breakouts.
5. Final thoughts 🚀
Silver is shining again. The trend is up, the structure supports further gains, and the chart is offering a clean setup. Until 35 fails, the bias remains bullish.
Disclosure: I am part of TradeNation's Influencer program and receive a monthly fee for using their TradingView charts in my analyses and educational articles.
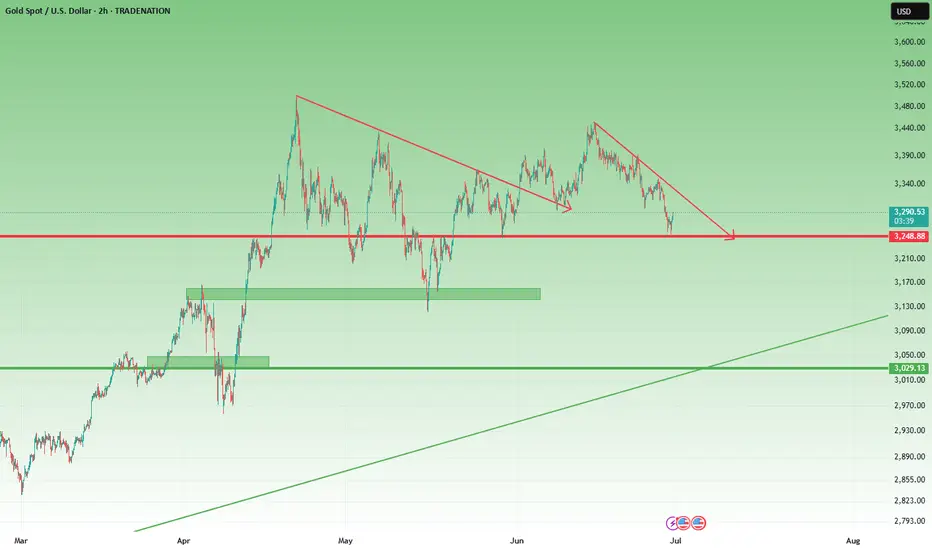
Gold Rebounds from 3250 – But Bears Still in Control1. What happened last week
As you know, I’ve been bearish on Gold all last week long. Even though the geopolitical situation in the Middle East escalated over the weekend, the fact that price couldn’t reclaim the 3400 resistance was a major red flag.
It showed us that the bullish sentiment was fragile, and that downside pressure is just around the corner.
And indeed — Gold sold off. The weekly close below the 3300 level confirmed the weakness.
2. The key question now
Has Gold found a bottom at 3250, or is this just a temporary rebound before another leg down?
3. Why I expect a continuation lower
- The weekly close was under 3300, breaking key support
- 3250 is being tested again — a level touched multiple times since the mid-April ATH
- The current rebound looks corrective, not impulsive
- Resistance levels at 3320 and 3340 are likely to hold as ceilings
- No major catalyst yet to justify a reversal
- This looks like a classic “sell the rally” setup in a weakening trend.
4. Trading plan
The idea is simple: sell the spikes.
If price bounces into 3320–3340, I will look to short again, anticipating a renewed test of the 3250 support zone.
If 3250 breaks — we could see acceleration toward 3200 or lower.
5. Final thoughts 🚀
No need to complicate things. Gold remains vulnerable unless it clears 3340. Until then, the trend is your friend — and that trend points down.
Disclosure: I am part of TradeNation's Influencer program and receive a monthly fee for using their TradingView charts in my analyses and educational articles.
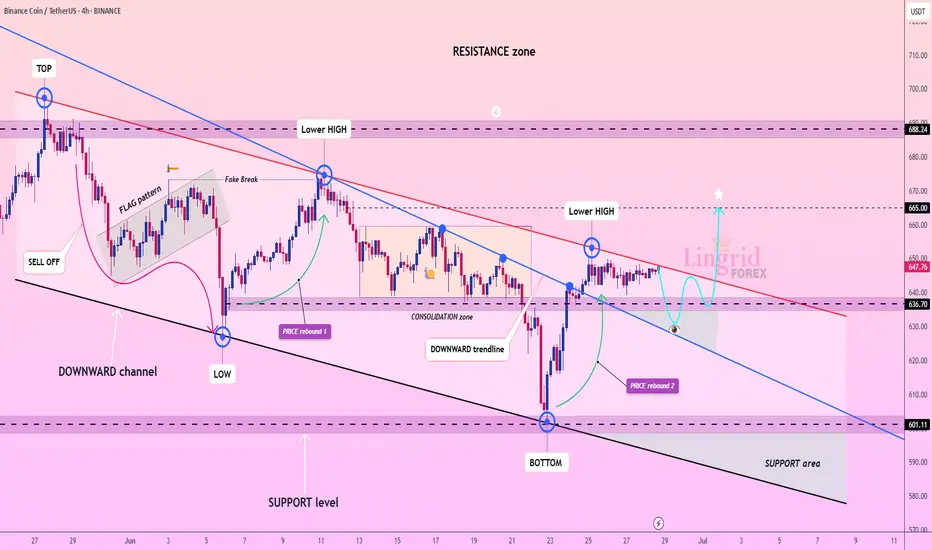
Lingrid | BNBUSDT breakout Setup. Preparing for Bullish Surge? BINANCE:BNBUSDT is facing strong resistance below the red descending trendline, repeatedly forming lower highs as it struggles to break above 650. The price is coiling between the 636 and 648 zones, hinting at a potential breakout or breakdown move. A clean rejection could drag price back to the 601 support area, while a surge above 650 opens the path toward 665.
📈 Key Levels
Buy zone: 636–640
Sell trigger: rejection from 648 or breakdown below 636
Target: 665
Buy trigger: breakout and close above 650 with volume
💡 Risks
Range continuation may trap breakout traders
Failure to hold 636 could accelerate downside
Resistance at 665 may cap bullish move short-term
If this idea resonates with you or you have your own opinion, traders, hit the comments. I’m excited to read your thoughts!
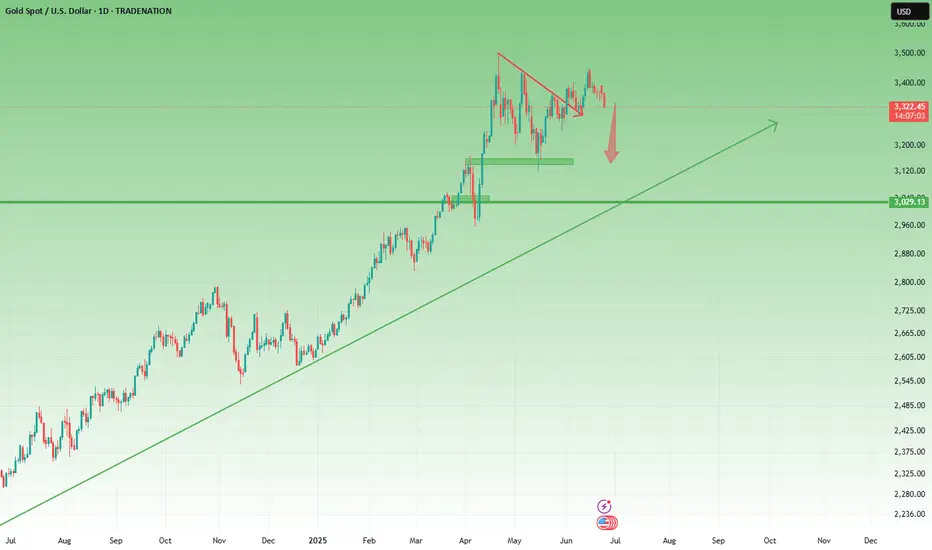
Gold Fails to Hold the Fear – Ceasefire Triggers 500+ Pip DropIn yesterday’s analysis, I pointed out that despite the weekend escalation in the middle-east, which triggered a gap up in Gold, the price action didn’t confirm the fear narrative. Gold failed to hold its gains – a clear sign of weakness.
📌 What happened next?
Throughout the day, Gold attempted multiple pushes toward 3400 – but each effort was met with strong selling pressure.
Then came the ceasefire announcement… and Gold dropped hard, now trading around 3320, locking in over 500 pips of profit from my short setup.
________________________________________
❓ More importantly, what’s next for Gold?
More important than the short-term noise is what the charts are now telling us:
📉 Weekly chart? Bearish.
🕯️ Daily chart? Also turned bearish after last week’s indecisive price action.
________________________________________
📌 Strategy remains the same:
I continue to sell rallies, and I’m now watching the 3280 support zone for a possible test in the coming hours.
Patience. Discipline. Let the market come to you. 🚀
Disclosure: I am part of TradeNation's Influencer program and receive a monthly fee for using their TradingView charts in my analyses and educational articles.
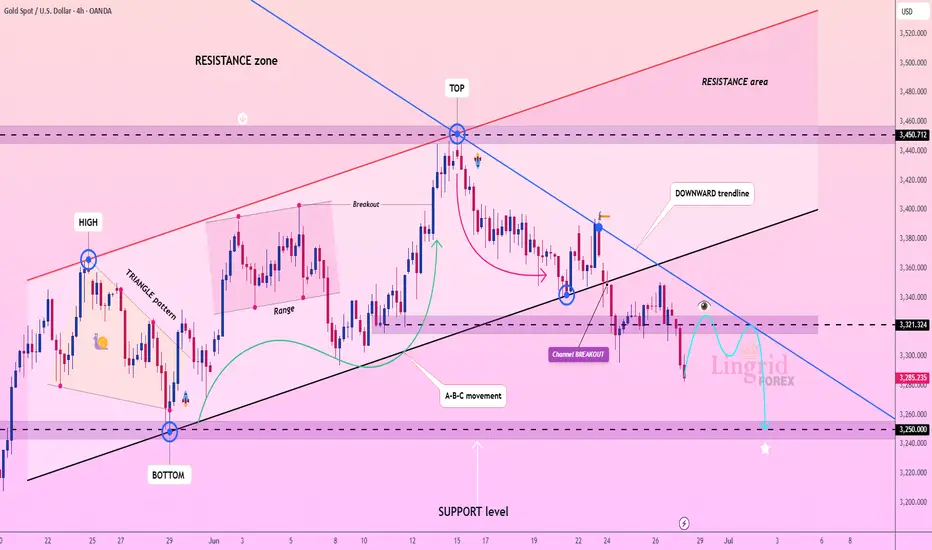
Lingrid | GOLD Bear Channel Break: Short OpportunityOANDA:XAUUSD has broken down from the upward channel and is now trading below the key 3,321 level, which previously served as support. The price is forming a bearish structure beneath the black and blue trendlines, with 3,250 emerging as the next potential target. A minor relief bounce could retest 3,320, but rejection here would reinforce downside continuation.
📈 Key Levels
Sell zone: 3,315–3,330
Sell trigger: rejection below 3,321
Target: 3,250
Sell confirmation: breakdown from 3,285 with momentum
💡 Risks
False breakout above 3,321 could trap sellers
Weak bearish momentum may result in sideways chop
Re-entry into channel could negate bearish outlook
If this idea resonates with you or you have your own opinion, traders, hit the comments. I’m excited to read your thoughts!
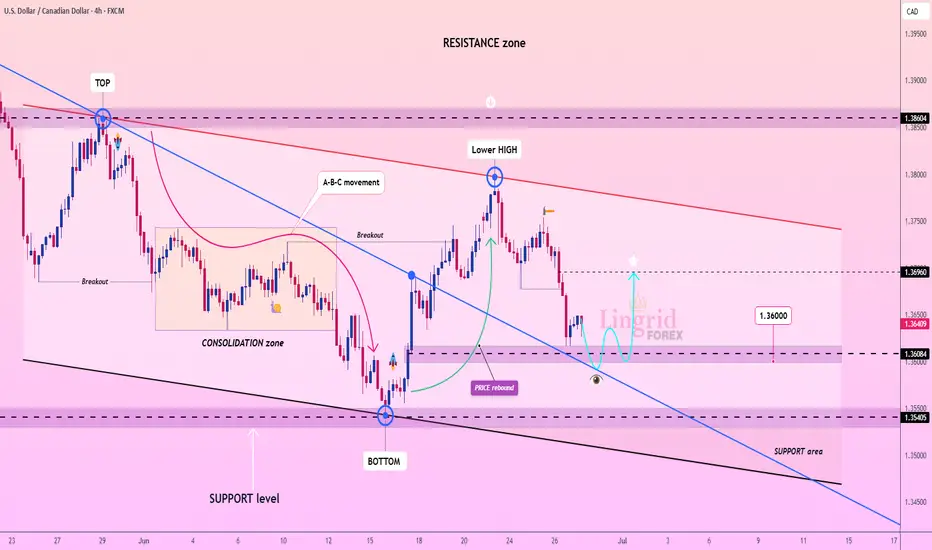
Lingrid | USDCAD Support Level Bounce OpportunityThe price perfectly fulfilled my last idea . FX:USDCAD is attempting to stabilize after a sharp drop from the 1.3696 resistance area, approaching the lower boundary of the falling wedge pattern. The price is testing the 1.3600–1.3550 support band, aligned with the blue descending trendline and historical pivot zones. A bullish rebound here could push the pair back toward 1.3696, while failure to hold exposes 1.3500 and lower.
📈 Key Levels
Buy zone: 1.3550–1.3600
Sell trigger: breakdown below 1.3550
Target: 1.3696
Buy trigger: breakout and retest of 1.3625–1.3650 zone
💡 Risks
Bearish momentum continuation toward 1.3500 if bounce fails
Weak volume recovery may trap buyers near 1.3620
Rejection near descending red trendline can maintain bearish pressure
If this idea resonates with you or you have your own opinion, traders, hit the comments. I’m excited to read your thoughts!
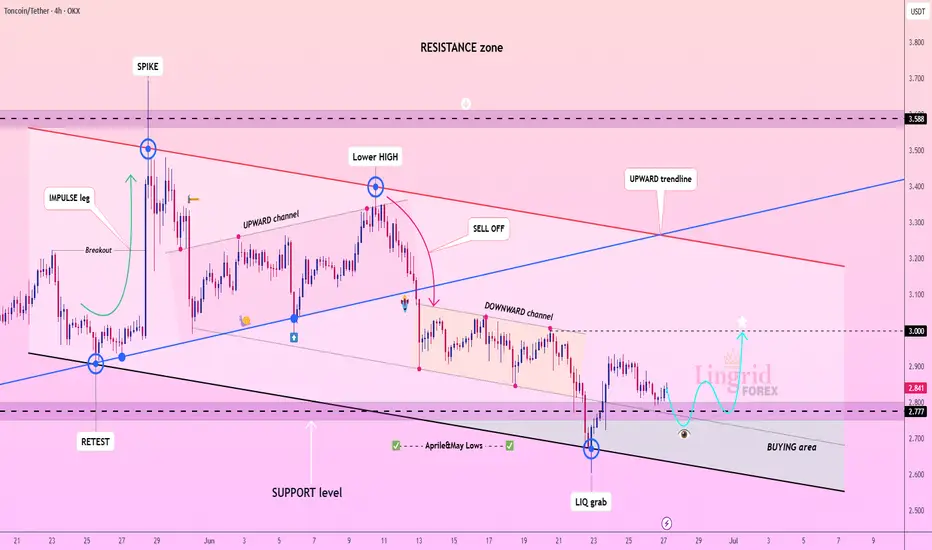
Lingrid | TONUSDT April-May Low Fake BreakoutOKX:TONUSDT is recovering after a liquidity grab near the April–May lows, bouncing from the lower boundary of the descending channel. The current move is stabilizing inside the BUYING area, suggesting accumulation and possible breakout preparation. If the 2.77 support holds, price may rally toward the 3.00 psychological barrier. A deeper dip below 2.77 would negate the bullish setup and reintroduce downside risks.
📈 Key Levels
Buy zone: 2.75–2.80
Sell trigger: sustained close below 2.75
Target: 3.00
Buy trigger: breakout above 2.90 with volume
💡 Risks
Low demand at the base could stall recovery
Failure to break out of the downward channel weakens upside case
Price rejection near 2.90 may trap early buyers
If this idea resonates with you or you have your own opinion, traders, hit the comments. I’m excited to read your thoughts!
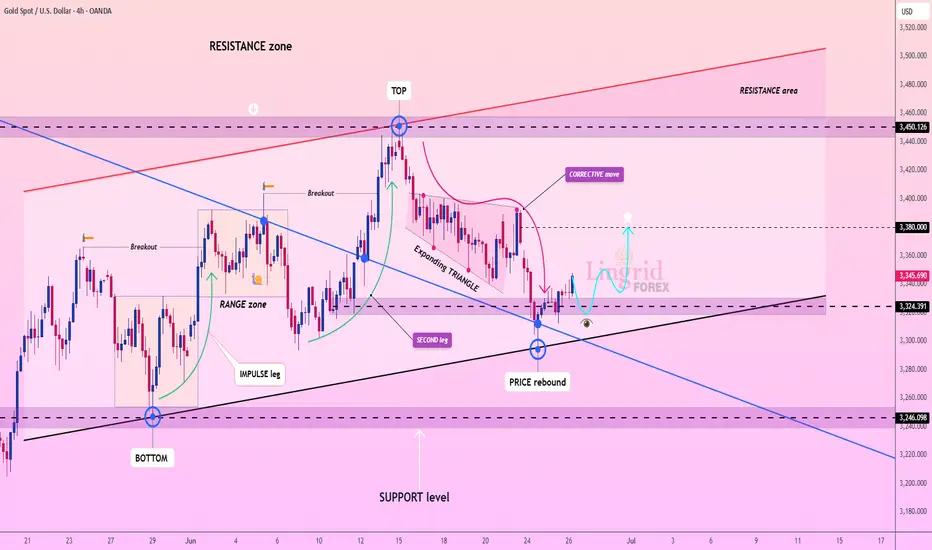
Lingrid | GOLD Potential Bullish Reversal TradeOANDA:XAUUSD is rebounding from key structure support after forming a double-leg corrective move inside an expanding triangle. Price has reclaimed the 3,324 zone, aligning with the trendline and support confluence, suggesting a short-term bullish bias. If this rebound sustains, gold could retest the 3,380 barrier before eyeing the 3,450 resistance ceiling. A rejection from mid-levels would reintroduce downside pressure toward the 3,246 zone.
📈 Key Levels
Buy zone: 3,320–3,330
Sell trigger: break below 3,324
Target: 3,450
Buy trigger: strong candle close above 3,380
💡 Risks
Weak volume could stall upside continuation
Failure to hold the trendline may drag price toward 3,246
Broader resistance zone between 3,380–3,450 could limit upside momentum
If this idea resonates with you or you have your own opinion, traders, hit the comments. I’m excited to read your thoughts!