Lingrid | EURCAD April High - Key Resistance Level TestThe price perfectly fulfilled my last idea . FX:EURCAD is extending its bullish leg after breaking out of both a triangle pattern and the downward trendline. The pair reached the 1.59500 resistance area and is now hovering within a broad supply zone where previous reactions occurred. Unless bulls force a sustained breakout, the price may revisit the 1.58060 support for reaccumulation.
📈 Key Levels
Sell zone: 1.59500 - 1.59700
Sell trigger: breakdown below 1.59000
Target: 1.58060
Buy trigger: above 1.57500
💡 Risks
False breakout from resistance could trap late buyers
Extended move may prompt short-term profit-taking
Break below the upward trendline weakens bullish momentum
If this idea resonates with you or you have your own opinion, traders, hit the comments. I’m excited to read your thoughts!
Signalservice

Dollar - Short term Bullish again (Mainly Bearish)Looks like Dollar wants to come back into the range we broke down from. I am still bearish dollar but no point getting into longer term "bearish" dollar trades yet

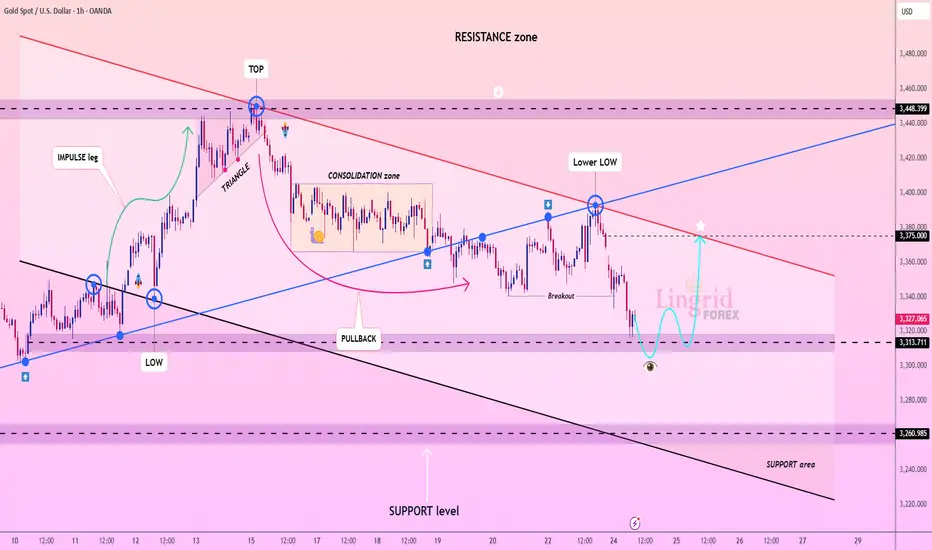
Lingrid | GOLD Retracement Entry Opportunity from Support ZoneOANDA:XAUUSD is attempting to stabilize after breaking below the consolidation zone and forming a new lower low near the 3,313 support. Price action hints at a bullish rebound setup, potentially targeting the 3,375 resistance aligned with the descending red trendline. The structure may shift if price forms a higher low and retests broken support as a springboard.
📈 Key Levels
Buy zone: 3,313 – 3,320
Sell trigger: break below 3,313
Target: 3,375
Buy trigger: higher low and breakout above minor resistance
💡 Risks
Failure to reclaim 3,313 could trigger another sell-off
Resistance trendline near 3,375 remains a rejection risk
Lack of volume confirmation may weaken bullish scenario
If this idea resonates with you or you have your own opinion, traders, hit the comments. I’m excited to read your thoughts!
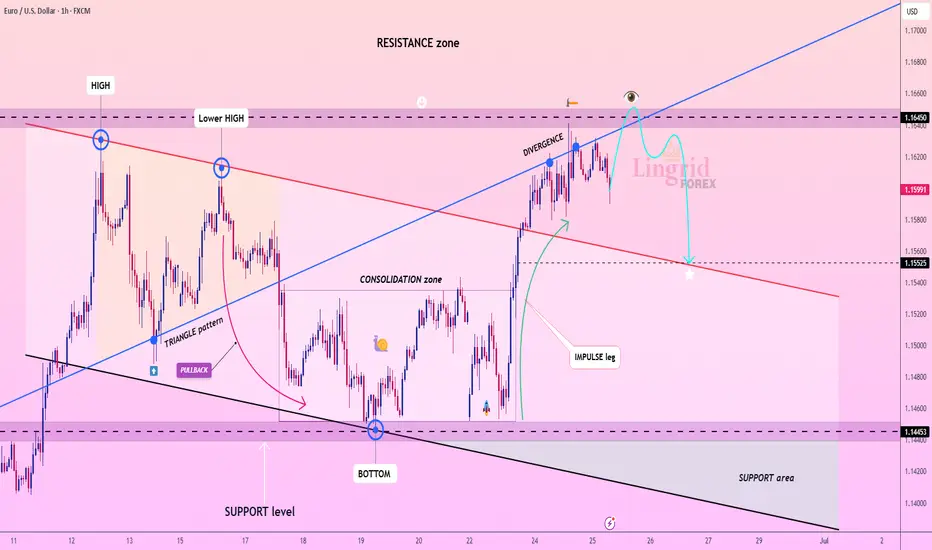
Lingrid | EURUSD Short-Term Correction. Counter Trend SetupThe price perfectly fulfilled my previous idea . FX:EURUSD completed a full impulse move from the bottom, touching the upper resistance line while showing clear bearish divergence at recent highs. Price is now hovering near 1.16450, with early signs of weakness below the ascending blue trendline. A breakdown from this zone could confirm a reversal toward the 1.15585 support and potentially deeper if momentum builds.
📉 Key Levels
Sell zone: 1.1630 – 1.1650
Sell trigger: break below 1.1600
Target: 1.15525
Buy trigger: breakout and hold above 1.1650
⚠️ Risks
Divergence may take time to fully play out
Reclaiming 1.1650 would negate bearish setup
Consolidation near highs may trap early sellers
If this idea resonates with you or you have your own opinion, traders, hit the comments. I’m excited to read your thoughts!
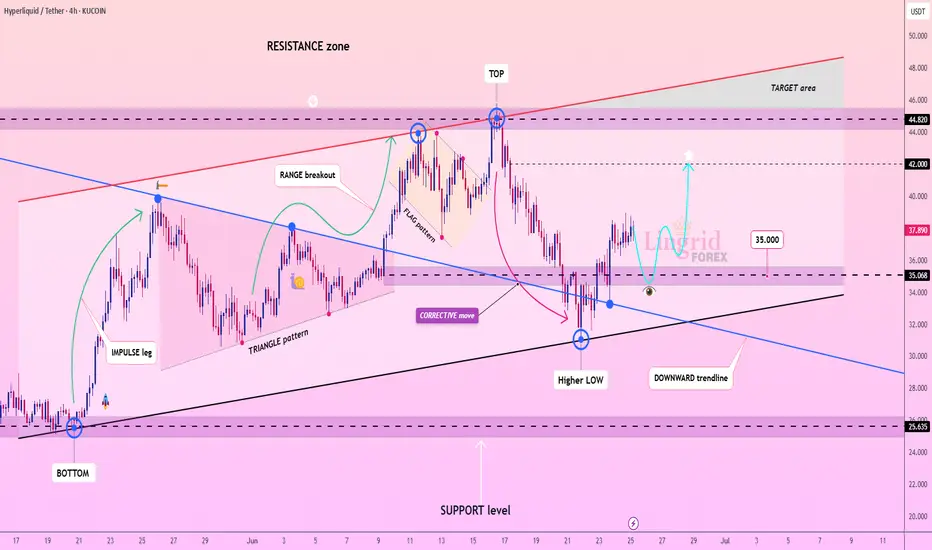
Lingrid | HYPEUSDT potential Long After Correction in the MarketKUCOIN:HYPEUSDT is attempting to recover from a corrective dip, forming a higher low above the upward trendline and stabilizing near the 35.0 support zone. Price is currently testing a minor resistance and may confirm a bullish reversal if the structure builds a higher high above 38.5. A breakout toward the 42.0 level aligns with the projection, possibly extending into the 44.8 target area.
📈 Key Levels
Buy zone: 35.0 – 36.0
Sell trigger: break below 35.0
Target: 42.0 – 44.8
Buy trigger: bullish breakout from local structure
💡 Risks
Rejection below 38.5 may lead to further downside
Broad resistance near 42.0 could stall momentum
A breakdown of trendline support would invalidate the bullish setup
If this idea resonates with you or you have your own opinion, traders, hit the comments. I’m excited to read your thoughts!
GOLD XAUUSD TodayMy SSM Structure change to strong bearish
My view is on chart.
I expect move up a little bit but after this new low
GOLD XAUUSD TodayGOLD XAUUSD Today for me maybe finish down move
Next week I expect change direction to LoNG setups.
My target will be new high.
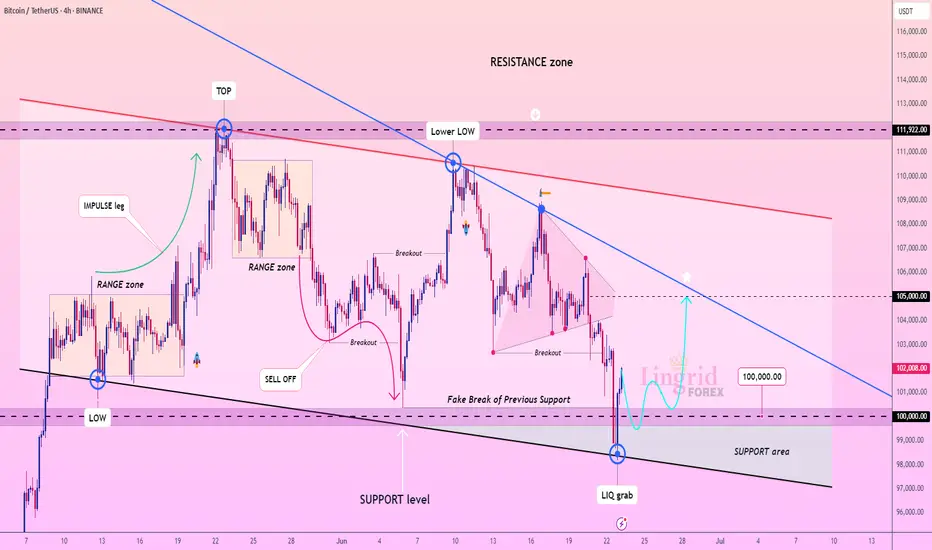
Lingrid | BTCUSDT potential Bullish Momentum after Fake BreakoutBINANCE:BTCUSDT just reclaimed the support area after a deep liquidity grab below 100,000, rebounding sharply toward the mid-range. Price is still trapped below the descending resistance trendline, but the recent fake break and reversal signal a bullish shift in momentum. If bulls hold above 100K, a breakout toward 105,000 looks increasingly probable.
📈 Key Levels
Buy zone: 99,000–100,500
Sell trigger: break below 99,000
Target: 105,000
Buy trigger: strong breakout above the descending blue trendline
💡 Risks
Retesting resistance at 105,000 may trigger a pullback
Descending structure still intact until breakout confirms
Sharp volatility spikes could invalidate short-term setups
If this idea resonates with you or you have your own opinion, traders, hit the comments. I’m excited to read your thoughts!
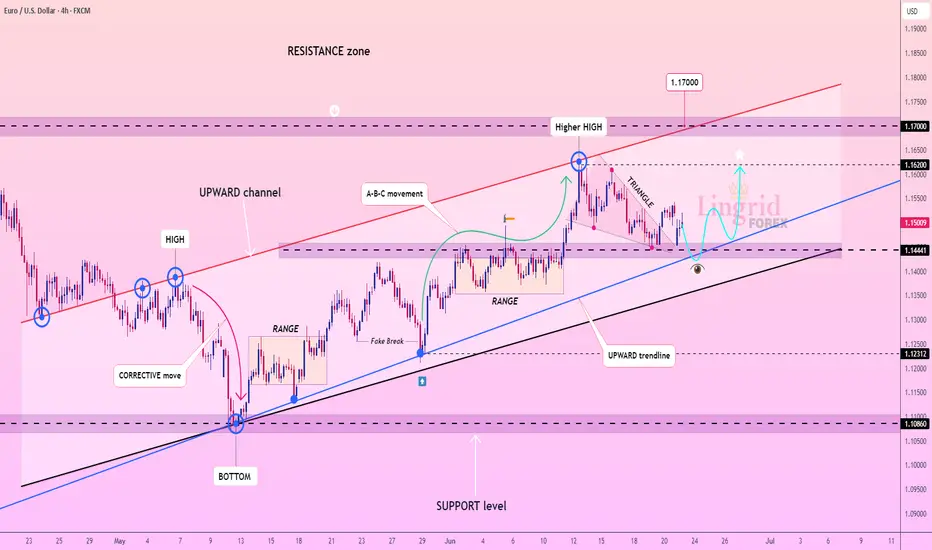
Lingrid | EURUSD Pullback - Awaiting Trend Continuation SignalFX:EURUSD is consolidating above the upward trendline after forming a triangle within the broader ascending channel. The recent pullback tested the 1.1444 support zone, with a rebound hinting at renewed bullish pressure. A push beyond 1.1620 could unlock upside toward the 1.1700 resistance mark.
📈 Key Levels
Buy zone: 1.1444–1.1470
Sell trigger: breakdown below 1.1444
Target: 1.16200
Buy trigger: breakout above 1.1523 resistance
💡 Risks
Triangle breakdown could shift the short-term bias bearish
Failure to reclaim 1.1620 may stall bullish momentum
A sharp drop below the black trendline would invalidate the structure
If this idea resonates with you or you have your own opinion, traders, hit the comments. I’m excited to read your thoughts!
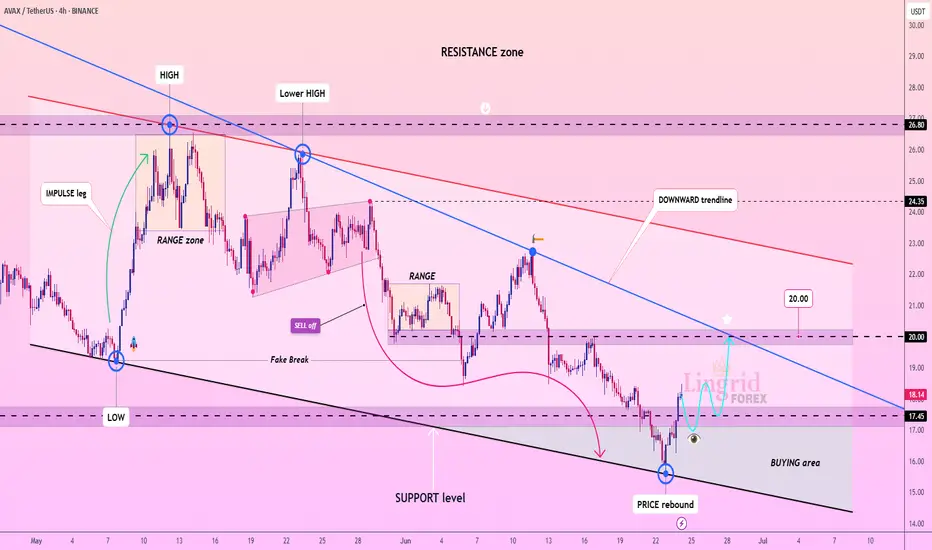
Lingrid | AVAXUSDT strong REBOUND from the SUPPORT zoneCRYPTOCAP:AVAX is rebounding from the lower boundary of its descending channel after a deep sweep into the buying area near 17.00. The price formed a local bottom and is attempting to reclaim the 17.45–18.50 resistance band, hinting at early bullish intent. If buyers sustain this recovery, a test of the 20.00 psychological barrier could follow.
📈 Key Levels
Buy zone: 16.20–17.00
Sell trigger: breakdown below 15.80
Target: 20.00
Buy trigger: breakout and retest of 18.50 resistance
💡 Risks
Failure to break 18.50 may trap longs below key resistance
Breakdown from support invalidates current bullish setup
Broader downtrend still dominant unless 20.00 is reclaimed
If this idea resonates with you or you have your own opinion, traders, hit the comments. I’m excited to read your thoughts!
Dollar Back to bearishAmazing run on the liqudity I outlined over the weekend. We literally stabbed through with a few pips and massive rejection. This is all war related but you see how these levels get appreciated all the time.
Insane rejection after taking the liquidity

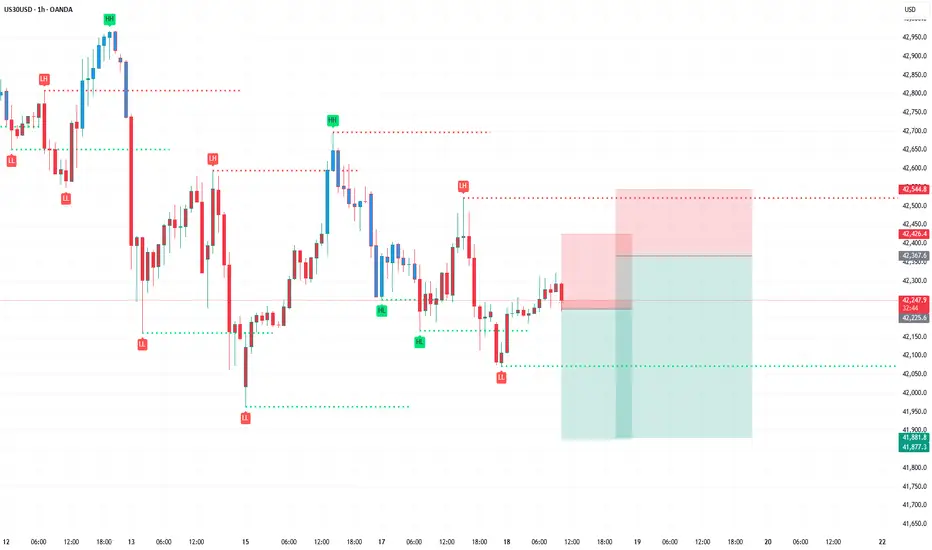
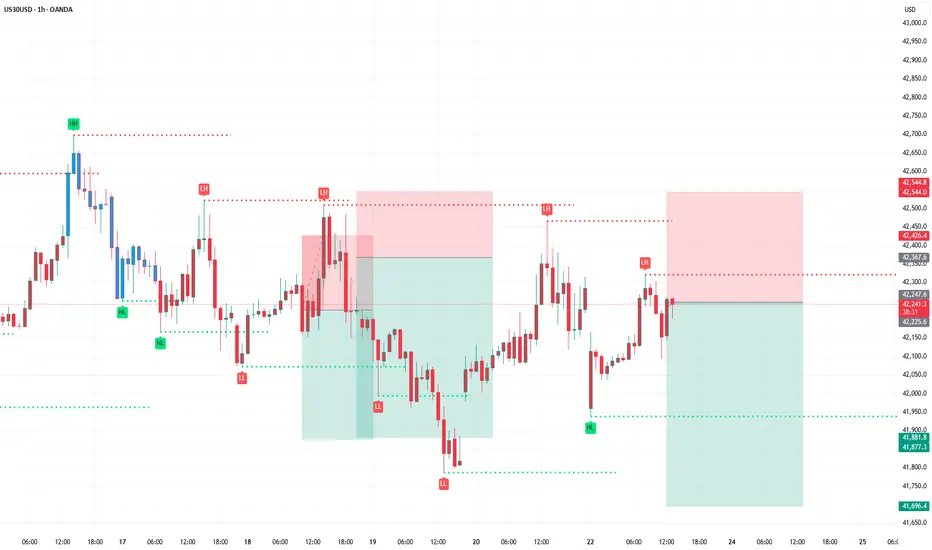
US30 TodayUS30 Today is still bearish
My SSM structure is still down
I'm waiting to open US and looking good entry
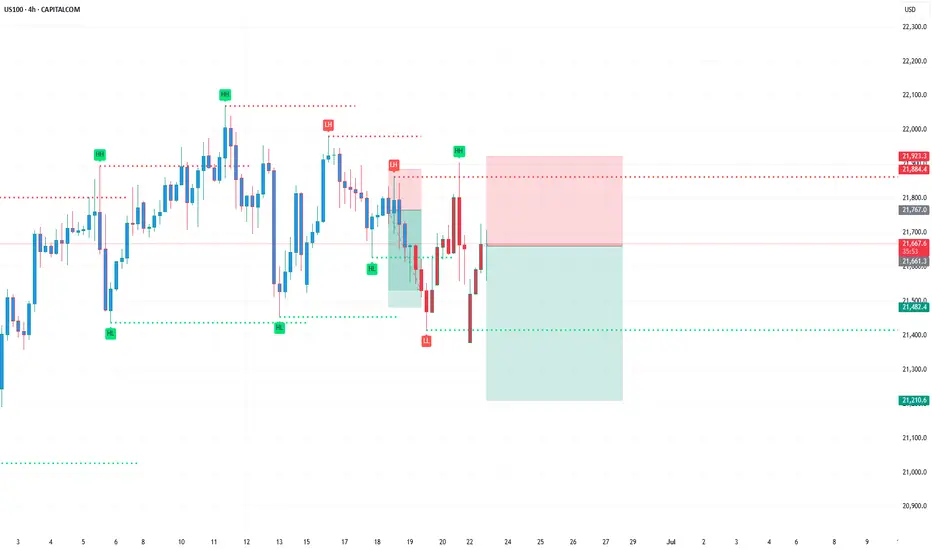
US100 / NASDAQ TodayUS100 Today is still bearish
My SSM structure is still down
I'm waiting to open US and looking good entry
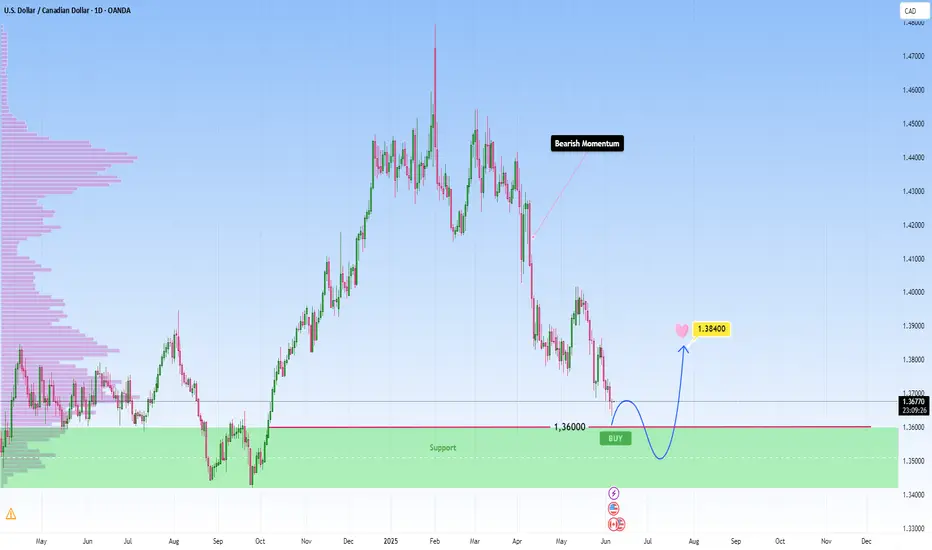
Bearish momentum to meet support on USDCAD: Looking for a bounceEvening, just wanted to share what I’m seeing on the USDCAD chart
Price on USDCAD has been in clear bearish momentum, but we’re now approaching a strong support zone, that’s held firm multiple times before, as I marked it on my chart. Price is approaching the zone again and I am taking it into account for a potential bounce.
I’ll be watching for bullish confirmation as usual requirement before entering. If that support holds, I’m targeting 1.38400 , totally achievable if momentum shifts.
BUT, if this zone breaks with momentum, I’ll reassess it and stay flexible.
💡 Reminder: Patience is power, no entry until price shows me something worth reacting to. This is not financial advice.
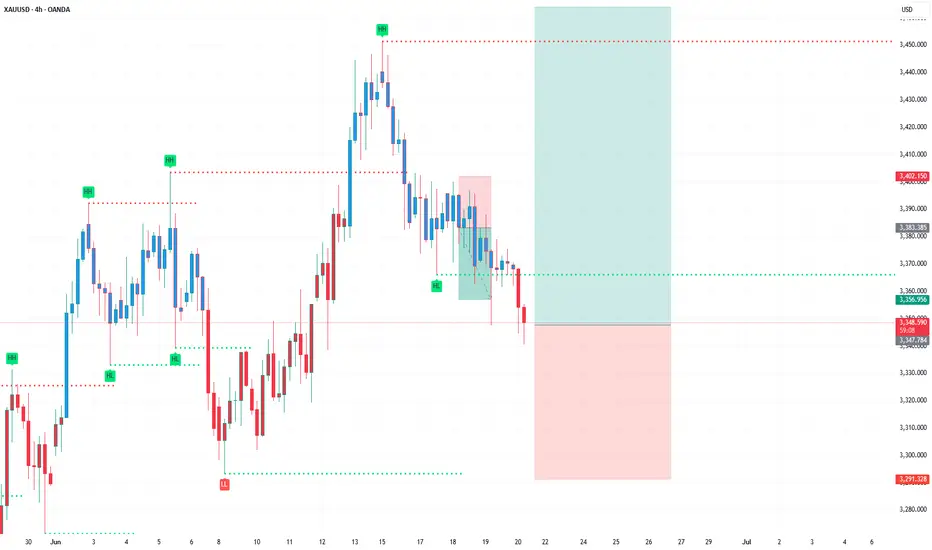
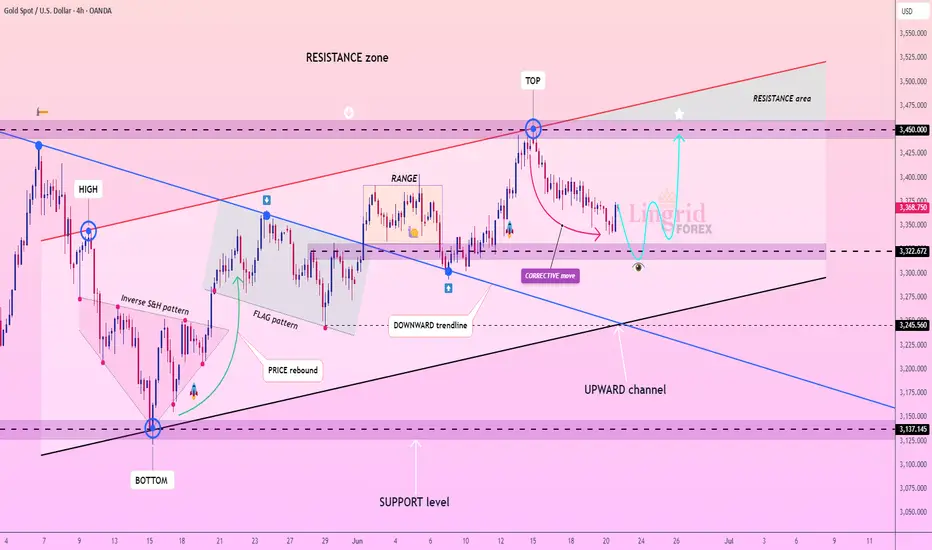
Lingrid | GOLD Weekly Outlook: Corrective Phase Tests SupportOANDA:XAUUSD experienced a notable pullback this week, retreating from the $3,450 resistance zone as profit-taking emerged following the recent geopolitical rally. The market appears to be entering a healthy corrective phase after the strong upward momentum driven by Middle Eastern tensions and safe-haven demand.
The 4H chart reveals gold testing the critical $3,320 support level, which coincides with the lower boundary of the established upward channel. This corrective move was anticipated after the sharp rally to the resistance area marked as "TOP" on the chart. The current price action suggests a natural retracement within the broader bullish structure.
Technically, the downward trendline from the recent high is being respected, indicating the correction may continue toward the $3,240-$3,270 range before finding stronger support. The flag pattern that previously drove the rally now serves as a reference point for this pullback phase.
Key levels to monitor include the $3,320 immediate support and the more substantial $3,200 level below. A decisive break below these supports could extend the correction further, while a bounce from current levels would reinforce the underlying bullish bias. The market remains within the broader upward channel, suggesting this correction is likely temporary before the next leg higher toward the resistance zone above $3,450.
Traders, if you liked this idea or if you have your own opinion about it, write in the comments.
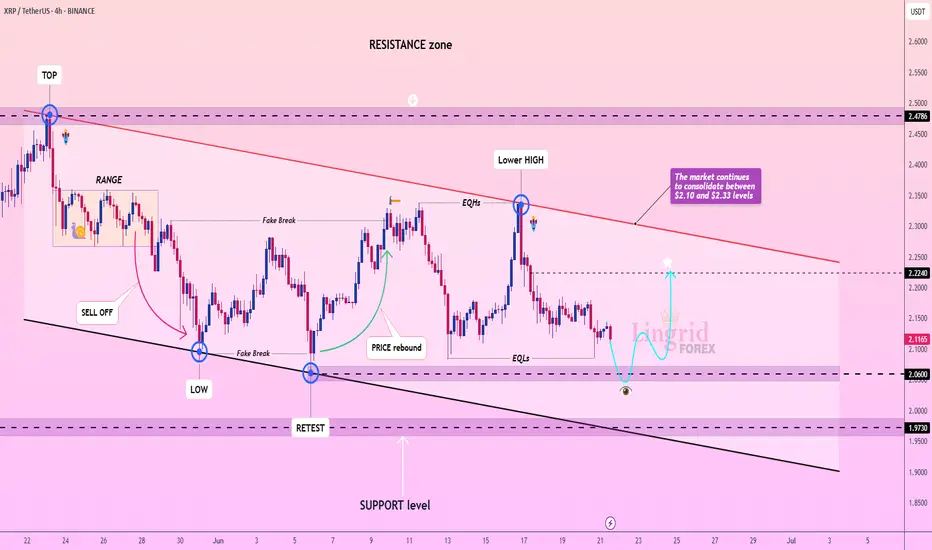
Lingrid | XRPUSDT sideways MOVEMENT ContinuesBINANCE:XRPUSDT is consolidating within a defined horizontal channel, currently sitting just above the 2.06 support after multiple fake breaks and failed attempts at a higher high. A bullish rebound from this zone could launch price back toward the descending resistance trendline. The 2.2240 level marks a key reaction point that may cap any breakout attempt short-term.
📈 Key Levels
Buy zone: 2.05–2.10
Sell trigger: breakdown below 2.05
Target: 2.22
Buy trigger: confirmation bounce above 2.10
💡 Risks
Sideways consolidation may extend, delaying breakout
Strong rejection near 2.22 trendline could trigger reversal
Break below 1.9730 confirms bearish continuation
Traders, if you liked this idea or if you have your own opinion about it, write in the comments. I will be glad 👩💻
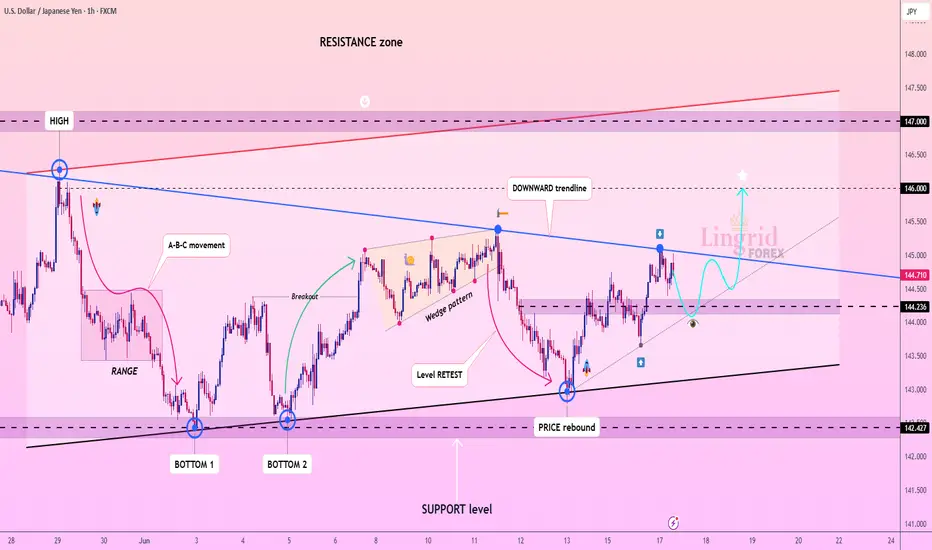
Lingrid | USDJPY Breakout Could Trigger Strong Bullish RallyFX:USDJPY is approaching a retest of the 144.20–144.30 support band after rebounding from a wedge breakdown and reclaiming structure within a broader ascending formation. Price remains under the downward trendline, but a successful bounce here could fuel another push toward 146. A higher low above 144.20 would confirm bullish intent.
📈 Key Levels
Buy zone: 144.20–144.40
Sell trigger: breakdown below 144.00
Target: 146.00
Buy trigger: breakout and hold above 145.00
💡 Risks
Rejection at the downward trendline limits upside potential
Failure to hold the 144.20 base could reverse the bullish structure
JPY strength from macro news could suppress breakout attempts
Traders, if you liked this idea or if you have your own opinion about it, write in the comments. I will be glad 👩💻
Hellena | GOLD (4H): LONG to resistance area of 3500 (Wave 3).Colleagues, the correction did take place and was quite deep, as I wrote earlier.
However, I am leaving my target unchanged—the resistance area and the maximum of wave “3” of the higher order at 3500.
The waves remain in their previous places, because none of the rules of wave analysis have been violated.
Manage your capital correctly and competently! Only enter trades based on reliable patterns!

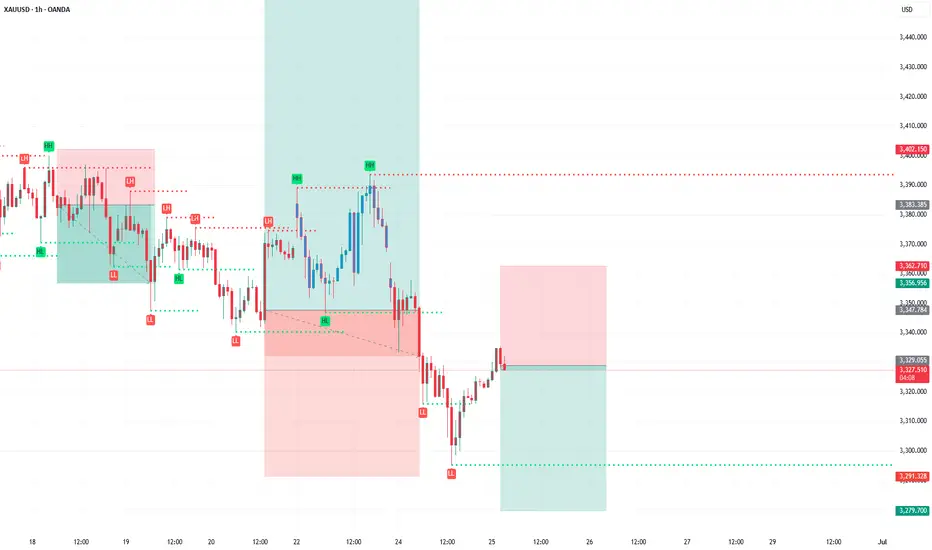
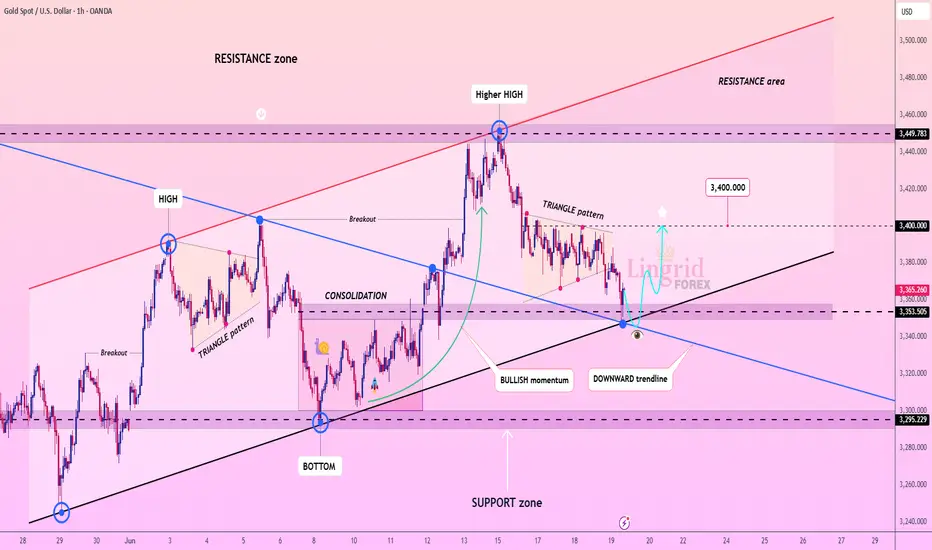
Lingrid | GOLD Post-FOMC Price Creates Trading OpportunityOANDA:XAUUSD is pulling back into the confluence zone between the black trendline and the 3,353–3,355 support, aligning with the breakout zone of a previous triangle pattern. Despite the drop, the overall structure remains bullish, especially if this retest holds. A bounce here would confirm the upward channel continuation toward the 3,400 key level.
📈 Key Levels
Buy zone: 3,350–3,355
Sell trigger: breakdown below 3,353
Target: 3,400
Buy trigger: clear bullish reversal from trendline support
💡 Risks
Break below 3,353 may shift bias to neutral or bearish
Sharp dollar strength could weigh on gold's recovery
Failure to break above the triangle again may trap early buyers
Traders, if you liked this idea or if you have your own opinion about it, write in the comments. I will be glad 👩💻
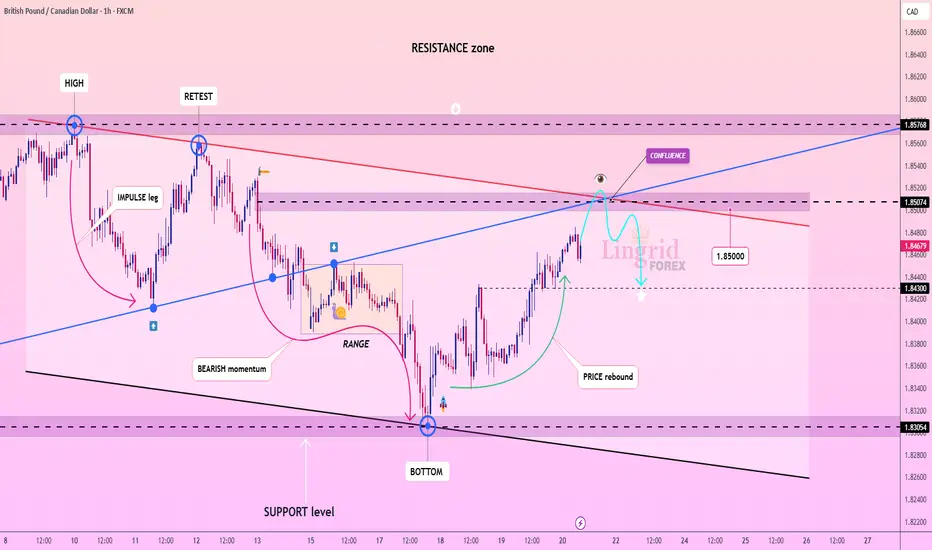
Lingrid | GBPCAD Bearish Opportunity at Confluence ZoneFX:GBPCAD is rebounding from the bottom of its support zone, forming a rounded recovery toward a confluence of resistance levels near 1.8507. Price is nearing the intersection of a downtrend line and a horizontal key level, creating a high-risk rejection zone. A failure to break above this confluence could initiate a bearish swing toward 1.8430 or lower.
📈 Key Levels
Buy zone: 1.8430–1.8460
Sell trigger: bearish rejection at 1.8507
Target: 1.8305
Buy trigger: strong close above 1.8576
💡 Risks
Breaking 1.8507 could lead to extended upside
Economic news or CAD volatility may disrupt pattern
Price may stall in the resistance cluster before choosing direction
Traders, if you liked this idea or if you have your own opinion about it, write in the comments. I will be glad 👩💻
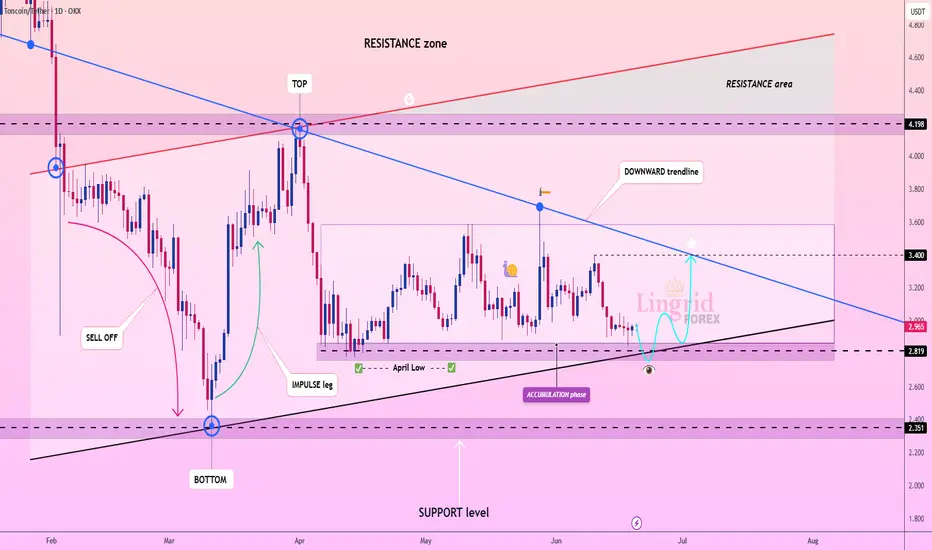
Lingrid | TONUSDT Mid-Term Market Structure AnalysisOKX:TONUSDT is holding just above the 2.82 support level while compressing into the apex of the downtrend and ascending support. Price action remains locked within a long accumulation range, but the bullish reaction near the black trendline hints at a potential reversal. A breakout above the downward trendline would expose 3.40 as the next resistance target.
📈 Key Levels
Buy zone: 2.80–2.83
Sell trigger: close below 2.81
Target: 3.40
Buy trigger: bullish breakout from descending trendline
💡 Risks
Rejection from the trendline may trigger a new test of 2.35
Market-wide weakness could delay breakout
Sideways range may persist if momentum fails to build
Traders, if you liked this idea or if you have your own opinion about it, write in the comments. I will be glad 👩💻
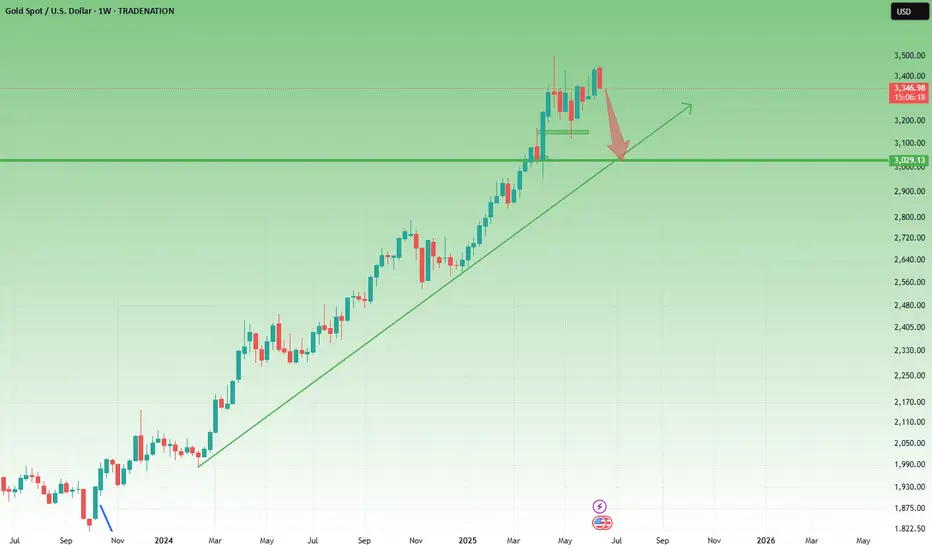
Choppy Gold Action Hides a Bigger Drop on Weekly Chart?After Monday’s correction, Gold continued lower – but the drop has been extremely choppy, making swing trading nearly impossible in this environment.
🔄 Short-term vs. Weekly Picture
On the 1H chart, price action is messy and directionless. However, the weekly chart tells a clearer story – which is not bullish at this moment.
❗ Let’s not rush into the “new ATH” narrative
Last week, I pointed out around the 3360 zone that we may get a rise above 3400. That move happened – but it seems more driven by Middle East tensions than by any structural strength in Gold itself.
📉 Why I’m leaning bearish on higher timeframes at this moment:
• This week’s price action almost fully negates last week’s strong green candle
• A close near the bottom of the range could form a Dark Cloud Cover pattern – a strong bearish signal
• Unless we see a reversal above 3400, downside remains the higher probability
📌 Next Target?
If the weekly close confirms this bearish setup, a drop to 3150 is not only possible – it’s becoming likely.
Disclosure: I am part of TradeNation's Influencer program and receive a monthly fee for using their TradingView charts in my analyses and educational articles.
US30 TodayUS30 Today is still bearish
My SSM Reversal Pattern is comming.
This is just my view of course