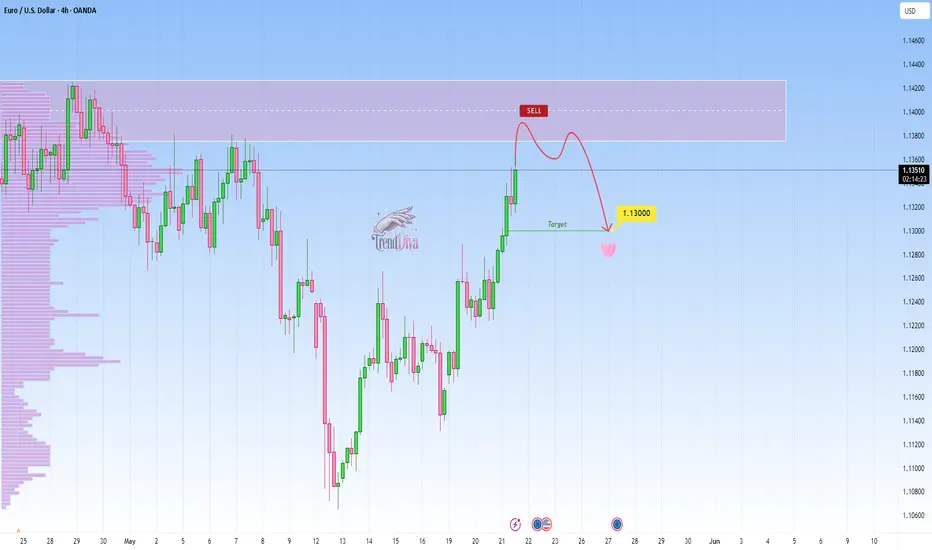
EURUSD: at key resistance: Will price rebound to 11300?Quick recap on EURUSD, seriously déjà vu of my previous analysis on EURUSD - once again we see the price coming towards the same resistance level. This is a level where it has struggled to break through and reversed nicely to the downside as expected. For me it's definitely one to monitor, especially for anyone considering short trades.
If we start seeing signs that the price is getting rejected here: like long wicks, bearish candles, or buyers starting to lose momentum, I think we could see a move down toward the 1.11300 level. I am targeting a slight bounce like before, nothing major. But if price cleanly breaks out, that would rule out the bearish outlook and suggest even further upside will follow.
This area is pretty important and could give us a better idea of where price is headed next.
Just sharing my thoughts on support and resistance, this isn’t financial advice. Always confirm your setups and manage your risk properly.
Signalservice
$LDO PUMP TO $1.20📊 1. Trend Analysis
HTF (Higher Time Frame) Bullish: Long-term trendline shows sustained upside momentum with 3 clean touches, indicating trend strength.
LTF (Lower Time Frame) Bearish: Short-term structure broke down from the trendline but is now showing signs of reversal with a falling wedge breakout.
📈 2. Chart Pattern
Falling Wedge: Classic bullish reversal setup. Price has broken out with strong momentum.
OBV (On-Balance Volume) shows bullish divergence—volume is rising while price was falling, signaling accumulation during the downtrend.
🔄 Market Structure
Swing Highs and Lows are respected—showing healthy structure.
Recent swing low held near the demand zone.
Break and retest of key levels and trendlines indicate potential continuation to the upside.
🟪 Supply & Demand
Demand Zone (~$0.65): Provided strong support, origin of latest move.
Supply Zone (~$1.15): Likely to offer resistance; aligns with upper FVG and volume gap.
🔵 Fair Value Gaps (FVGs)
Filled/Partial Below: $0.65–$0.68 – already mitigated.
Unfilled Above: Around $0.98–$1.05 – may act as a magnet for price.
🧠 Psychological Levels
$0.90 and $1.00: Price magnets due to trader behavior. Expect increased reaction or consolidation at these levels.
🔴 Volume Profile
High Volume Node (HVN) around $0.85–$0.95: Indicates acceptance zone where price may consolidate.
Low Volume Gap above $1.10: If price clears this, a fast move to $1.20+ is likely.
✅ Bullish Confluences
Falling wedge breakout confirms reversal potential.
OBV divergence supports accumulation narrative.
Price bounced from demand zone and reclaimed broken structure.
Room to move into FVG and low-resistance areas above.
❌ Bearish Risks
Rejection at $1.00–$1.05 psychological/FVG level.
Breakdown below $0.86–$0.88 invalidates bullish setup.
Heavy supply at $1.20 could cap upside.
📌 Summary
Bias: Bullish. Expect move toward $1.00–$1.15.
Confirmation: Clean break and hold above $1.00.
Invalidation: Break back below $0.86 swing low.

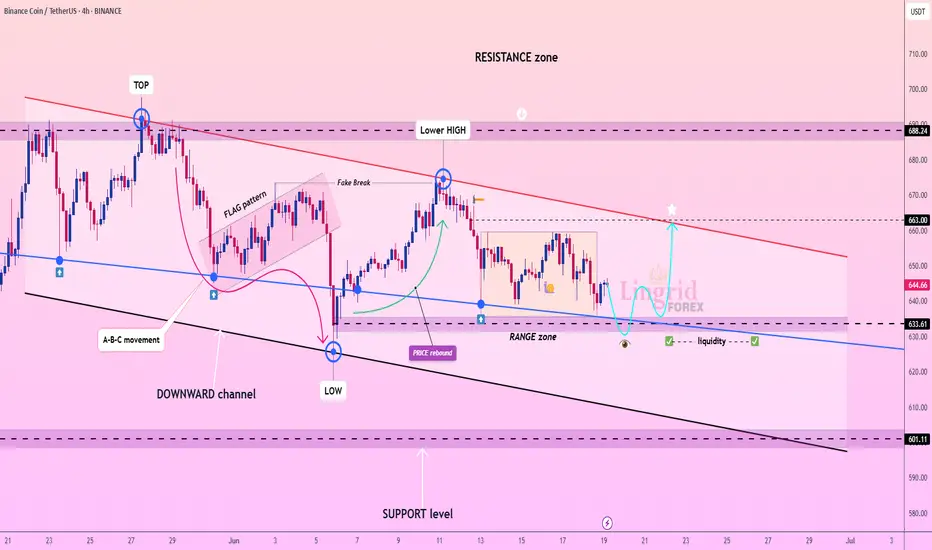
Lingrid | BNBUSDT buying Opportunity in Consolidation PhaseBINANCE:BNBUSDT is forming a reactive base inside the lower boundary of its descending channel, just above the 633 support zone. The current range structure suggests consolidation, with a potential for a false breakdown before an upward move. A breakout through the red descending trendline could target the 663 liquidity area.
📈 Key Levels
Buy zone: 633–638
Sell trigger: sustained move below 633
Target: 663
Buy trigger: bullish engulfing near support + breakout above range
💡 Risks
Failure to hold the 633 level could resume the channel downtrend
Rejection from the red trendline may reinforce bearish pressure
Broader market weakness could invalidate the upward scenario
Traders, if you liked this idea or if you have your own opinion about it, write in the comments. I will be glad 👩💻
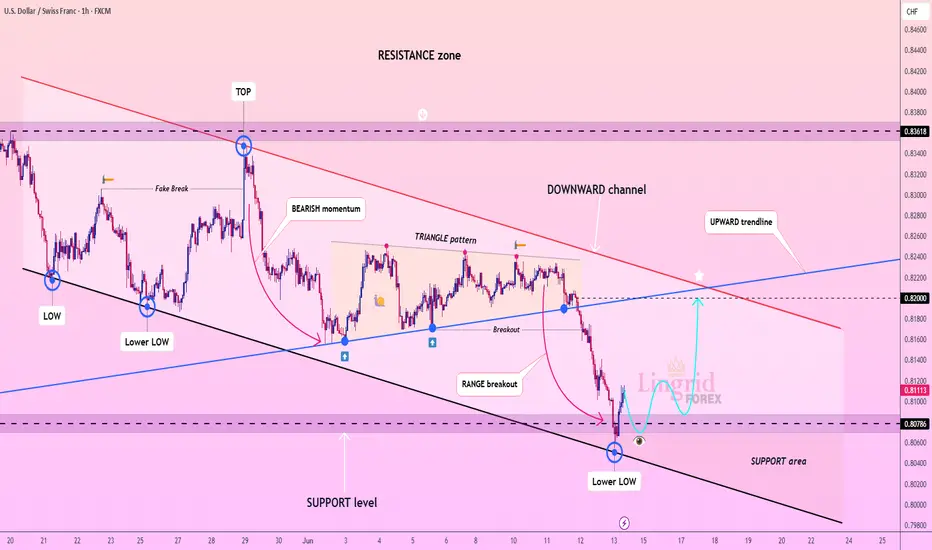
Lingrid | USDCHF long Trading Opportunity from Strong SupportThe price perfectly fulfills my previous idea . FX:USDCHF just printed a new lower low at the bottom of a wide downward channel, completing a textbook bearish leg from the triangle breakdown. The price is showing signs of local accumulation with a possible double bottom forming near 0.8078 support. If a bullish bounce holds, the next target lies near the confluence of the upward trendline and 0.8200 zone.
📈 Key Levels
Buy zone: 0.8060–0.8080
Sell trigger: breakdown below 0.8050
Target: 0.8200
Buy trigger: strong bullish engulfing above 0.8125
💡 Risks
Break below 0.8050 reopens path to 0.7980
Weak recovery could form another lower high
Downward channel remains dominant until confirmed breakout
Traders, if you liked this idea or if you have your own opinion about it, write in the comments. I will be glad 👩💻
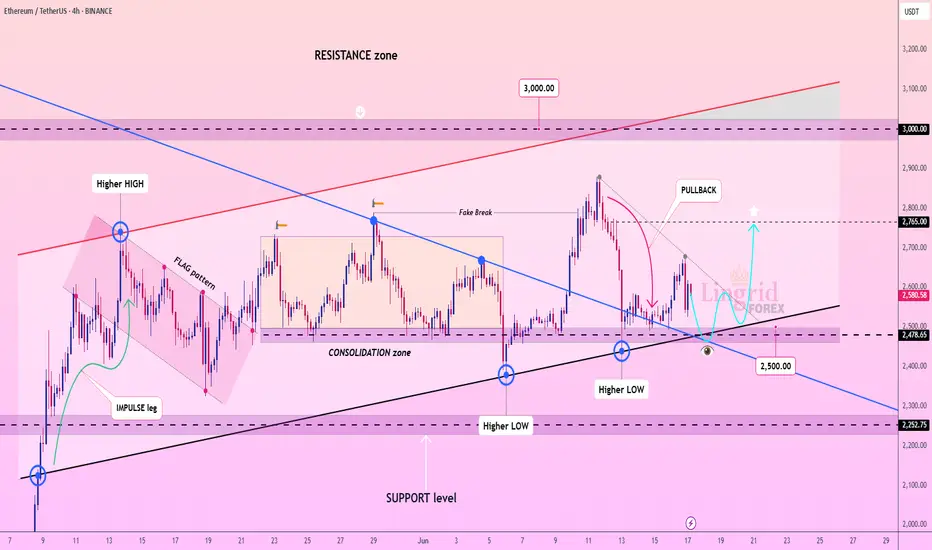
Lingrid | ETHUSDT potential Bullish Trade from the ConfluenceBINANCE:ETHUSDT is retesting a key support area near 2500 following a deep pullback from the 2765 rejection zone, while holding above a multi-week ascending trendline. The recent bounce has not yet invalidated the bullish structure, and the confluence with the downward breakout level adds significance to this zone. A higher low above 2480 could trigger a sharp reversal back toward the 2765 resistance.
📈 Key Levels
Buy zone: 2475–2520
Sell trigger: breakdown below 2450
Target: 2765
Buy trigger: breakout above 2620
💡 Risks
A breakdown below 2475 would cancel the bullish setup
Lack of volume on bounce attempts may signal weakness
Macro events or BTC drop could drag ETH lower regardless of setup
Traders, if you liked this idea or if you have your own opinion about it, write in the comments. I will be glad 👩💻
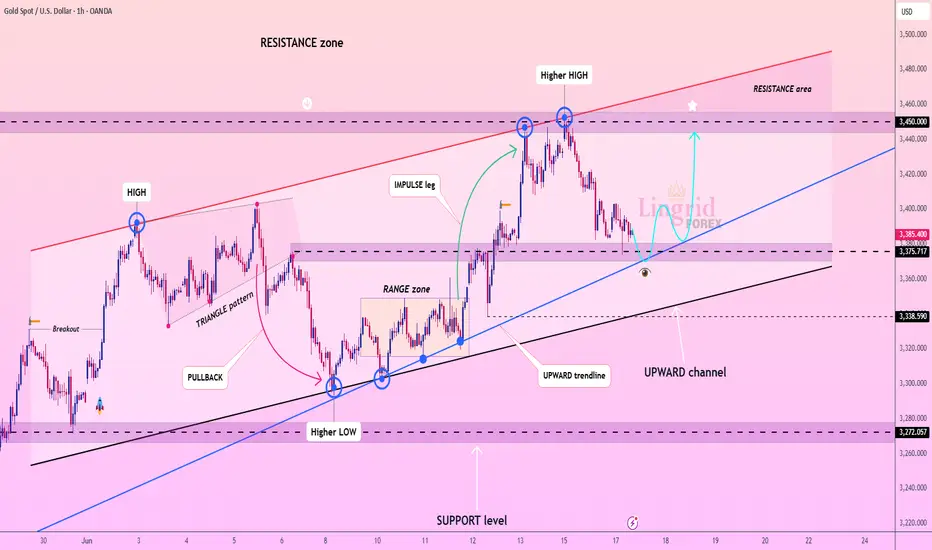
Lingrid | GOLD corrective Pullback Presents Potential Long EntryOANDA:XAUUSD is retracing from a double top inside the resistance area near 3450 but remains above the key 3375 support and the ascending channel structure. Price is testing the confluence of the upward trendline and prior breakout level, creating a possible bullish rebound setup. A successful bounce here could ignite momentum toward the 3450–3470 zone.
📈 Key Levels
Buy zone: 3370–3375
Sell trigger: loss of 3360 support
Target: 3450
Buy trigger: breakout above 3400 and hold with strong candle close
💡 Risks
A close below the upward channel could trigger deeper sell-off
Failure to reclaim 3400 may trap bulls in consolidation
Macro catalysts (Fed, CPI) could override local structure
Traders, if you liked this idea or if you have your own opinion about it, write in the comments. I will be glad 👩💻
Lingrid | PEPEUSDT buying Opportunity from Support ZoneBINANCE:PEPEUSDT has extended its decline within the broader downtrend, recently forming a new local lower low at the support zone around 0.000000947. Price action is now testing the lower boundary of the descending channel and support level with potential for a short-term bounce. A break above the 0.00000102–0.00000107 resistance cluster could ignite a rally back toward the key trendline and upper range near 0.00000117.
📈 Key Levels
Buy zone: 0.00000094–0.00000100
Sell trigger: loss of 0.00000094 support
Target: 0.00000117
Buy trigger: bullish breakout above 0.00000105 with volume
💡 Risks
Rejection from the trendline may push price into new lows
Continuation of lower lows signals trend pressure
Weak volume may stall breakout above 0.00000105
Traders, if you liked this idea or if you have your own opinion about it, write in the comments. I will be glad 👩💻

Lingrid | EURUSD continuation Following Key Level BreakoutOANDA:EURUSD has completed a bullish breakout above the triangle pattern and is now consolidating above the key 1.14990 support level. The price structure shows a series of higher lows, with recent action forming a tight range just above trendline support. If bulls defend this area, a move toward the 1.17000 resistance becomes increasingly likely.
📈 Key Levels
Buy zone: 1.14990–1.15200
Sell trigger: break below 1.14800
Target: 1.17000
Buy trigger: break above 1.16000 with bullish volume
💡 Risks
Failure to hold 1.14990 could trigger a move toward 1.12100
DXY strength could suppress EUR upside
ECB or Fed policy shocks could increase volatility
Traders, if you liked this idea or if you have your own opinion about it, write in the comments. I will be glad 👩💻

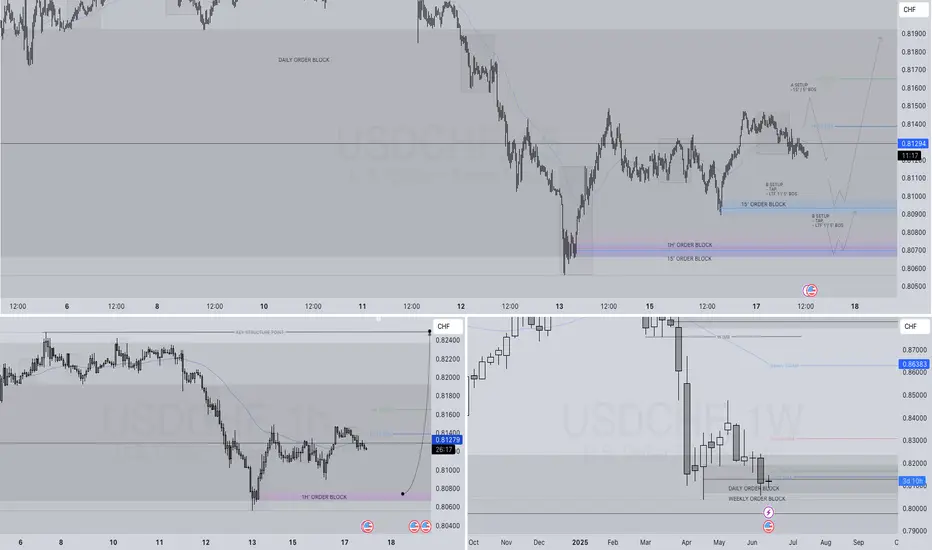
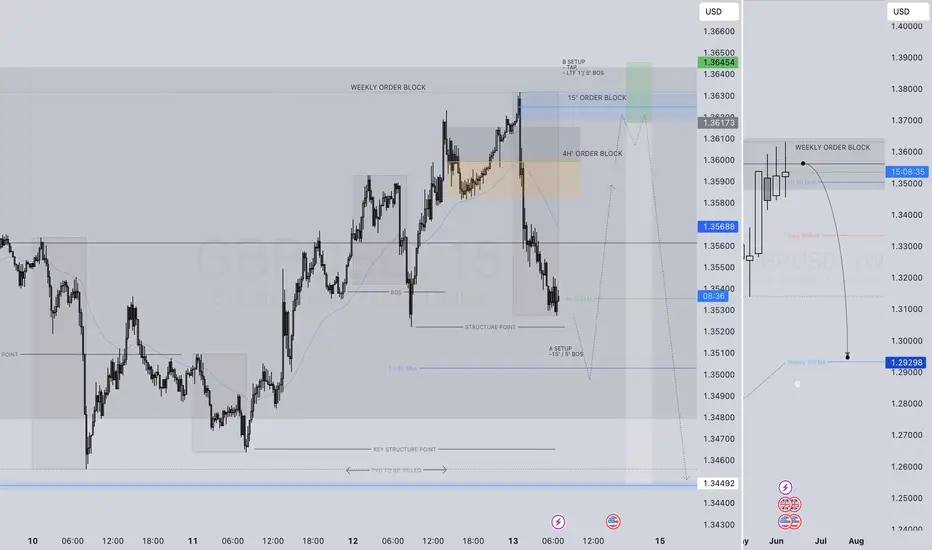
USDCHF LONG FORECAST Q2 W25 D17 Y25USDCHF LONG FORECAST Q2 W25 D17 Y25
Professional Risk Managers👋
Welcome back to another FRGNT chart update📈
Diving into some Forex setups using predominantly higher time frame order blocks alongside intraday confirmation & breaks of structure.
Let’s see what price action is telling us today! 🔥
💡Here are some trade confluences📝
✅Weekly order block rejection
✅Daily order block rejection
✅15’ order block
✅Intraday bullish breaks of structure
🔑 Remember, to participate in trading comes always with a degree of risk, therefore as professional risk managers it remains vital that we stick to our risk management plan as well as our trading strategies.
📈The rest, we leave to the balance of probabilities.
💡Fail to plan. Plan to fail.
🏆It has always been that simple.
❤️Good luck with your trading journey, I shall see you at the very top.
🎯Trade consistent, FRGNT X
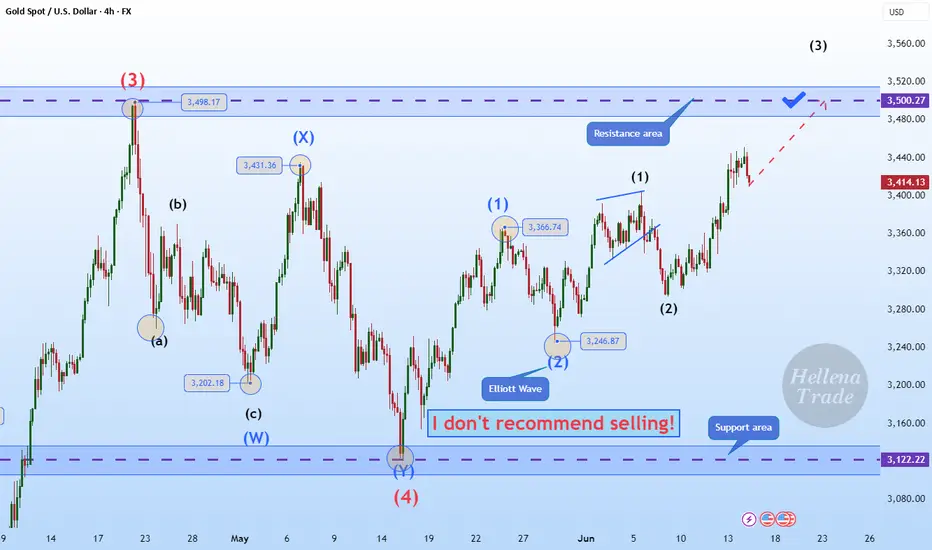
Hellena | GOLD (4H): LONG to resistance area of 3500.Colleagues, I believe that, as with the euro, the upward five-wave impulse is not yet over. At the moment, I see the formation of wave “3” of the lower order and wave ‘3’ of the middle order, which means that the upward movement will continue at least to the resistance area of 3500 — this is the maximum of wave “3” of the higher order, which means that a correction is possible at this level.
Manage your capital correctly and competently! Only enter trades based on reliable patterns!
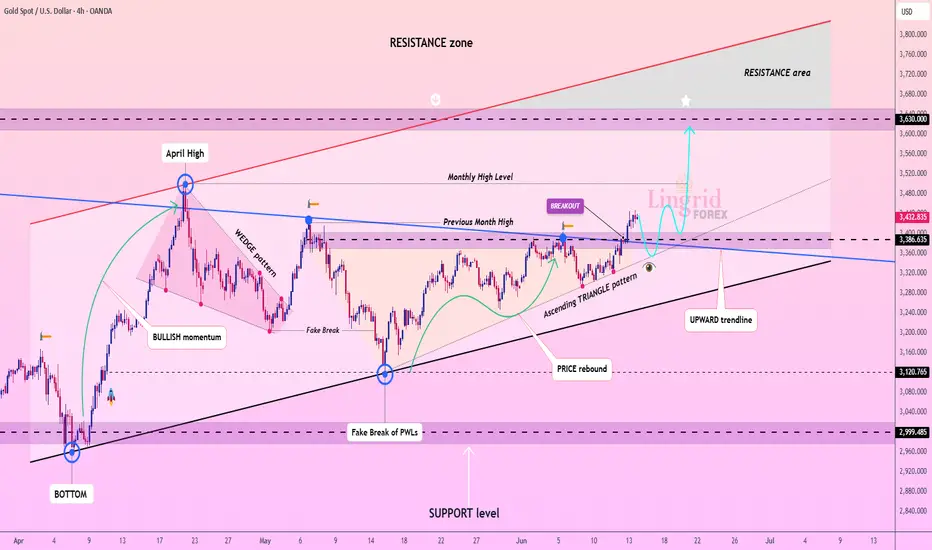
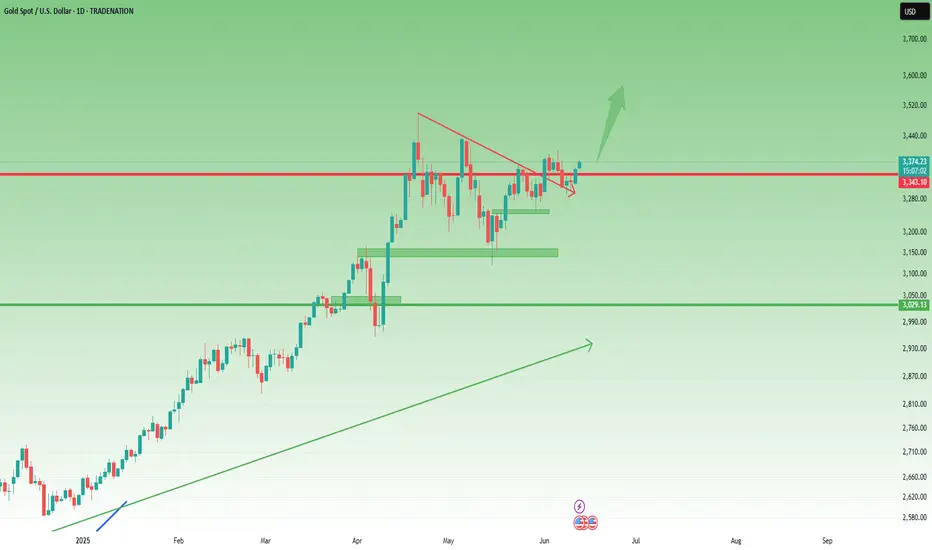
Lingrid | GOLD Weekly Analysis: Geopolitical Safe-Haven RallyOANDA:XAUUSD demonstrated exceptional strength this week as geopolitical tensions from Israeli-Iranian conflicts drove massive safe-haven demand. The metal successfully broke above the critical 3,360 resistance level, confirming the completion of an inverse head and shoulders pattern that has been forming since April.
The 4H chart reveals the market appears to be forming an ascending triangle pattern within a broader upward trendline, suggesting continued bullish momentum. The recent breakout above the monthly high resistance zone indicates strong institutional buying pressure.
The daily chart presents an even more compelling picture with the completion of an inverse head and shoulders pattern, a classic bullish reversal formation. This technical setup, combined with the massive flag pattern completion, projects potential targets toward $3,650-$3,700 levels. The right shoulder formation confirms the pattern's validity, while sustained buying above previous resistance zones validates the upward trajectory.
We should monitor the $3,430-$3,450 resistance area closely, as a decisive break could accelerate momentum toward the projected targets. The combination of geopolitical risk premiums and technically sound chart patterns creates a favorable environment for continued gold appreciation in the mid-term.
Traders, if you liked this idea or if you have your own opinion about it, write in the comments. I will be glad 👩💻
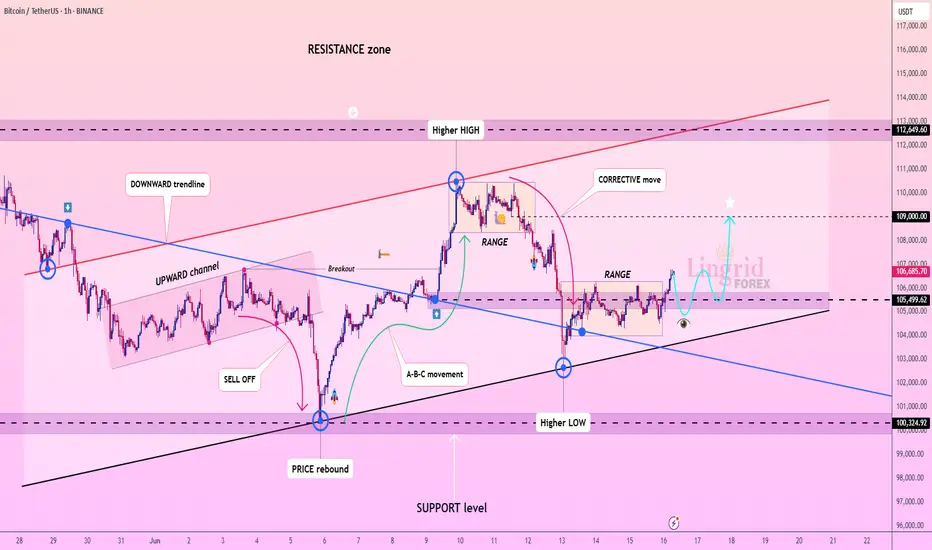
Lingrid | BTCUSDT potential Bullish Continuation After PullbackThe price perfectly fulfilled my last idea . BINANCE:BTCUSDT has formed a higher low after rebounding from the trendline near $104K and is attempting to stabilize within a minor range just above $105.5K. The broader structure shows a clean breakout from the downward trendline, followed by consolidation, suggesting accumulation. A bounce from the $105K–$105.5K support area would favor a continuation toward the $109K resistance level.
📈 Key Levels
Buy zone: 105,000–105,500
Sell trigger: break below 104,800
Target: 109,000
Buy trigger: close above 106,800 with strong volume
💡 Risks
Breakdown of support could retest the $100K region
False breakout may trap bulls above $106K
External macro news could trigger short-term volatility
Traders, if you liked this idea or if you have your own opinion about it, write in the comments. I will be glad 👩💻
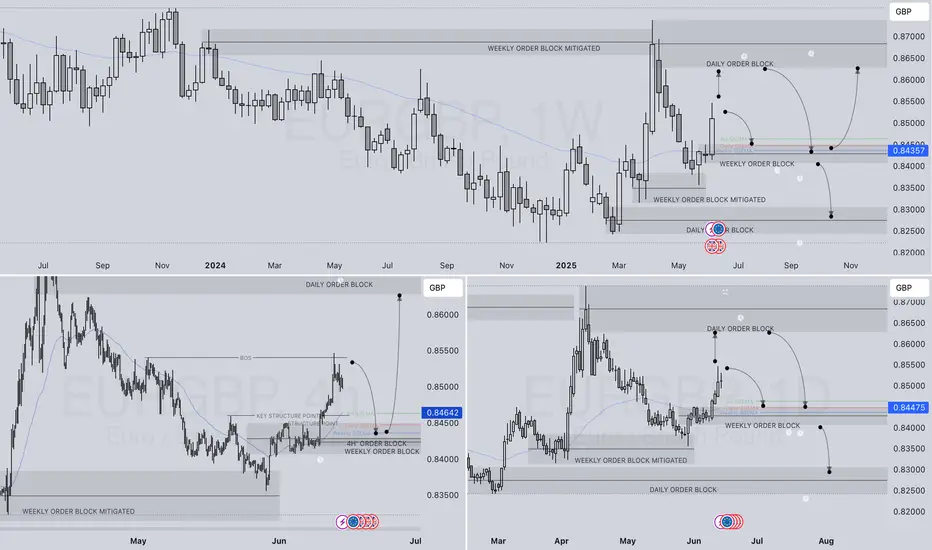
EURGBP WEEKLY HTF FORECAST Q2 W25 Y25EURGBP WEEKLY HTF FORECAST Q2 W25 Y25
Professional Risk Managers👋
Welcome back to another FRGNT chart update📈
Diving into some Forex setups using predominantly higher time frame order blocks alongside confirmation breaks of structure.
🔑 Remember, to participate in trading comes always with a degree of risk, therefore as professional risk managers it remains vital that we stick to our risk management plan as well as our trading strategies.
📈The rest, we leave to the balance of probabilities.
💡Fail to plan. Plan to fail.
🏆It has always been that simple.
❤️Good luck with your trading journey, I shall see you at the very top.
🎯Trade consistent, FRGNT X
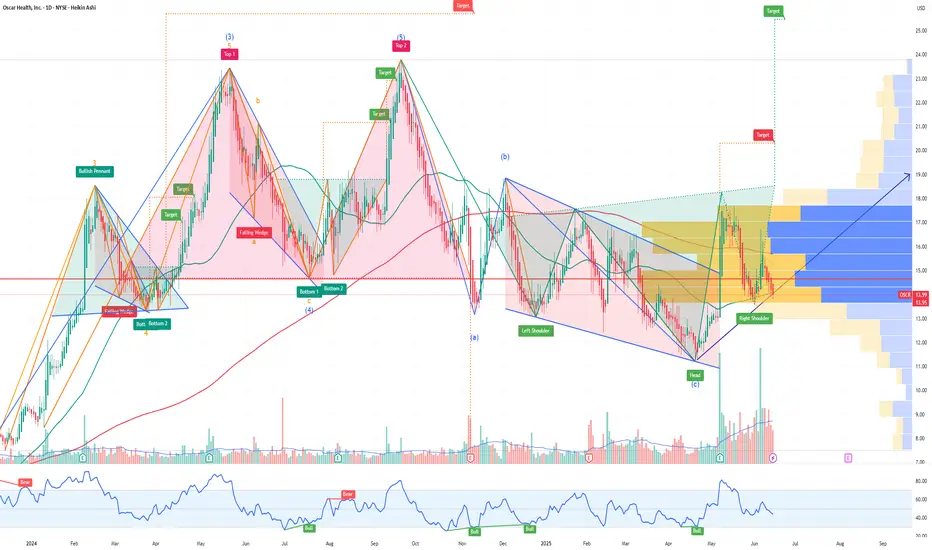
Bullish Thesis: Why Oscar Health OSCR Could Rally Strong in 2025Oscar Health, OSCR, a technology-driven health insurance company, is positioned for a significant stock price appreciation in 2025. Despite some mixed short-term sentiment, the long-term outlook and recent analyst forecasts suggest a potential rally that could more than double the current share price. Here’s why OSCR could be a compelling bullish opportunity this year:
1. Strong Analyst Price Targets Indicate Upside of Over 125%
According to recent forecasts, OSCR is expected to reach an average price of $31.40 in 2025, with some analysts projecting highs as much as $41.31—a potential upside exceeding 125% from the current price near $13.95.
Monthly forecasts show a steady upward trajectory, with July 2025 targets around $37.24 and December 2025 targets near $34.67, highlighting sustained bullish momentum throughout the year.
The average 12-month price target is around $34.40, representing a 146% upside, signaling strong confidence in OSCR’s growth prospects.
2. Innovative Business Model and Growth Potential
Oscar Health leverages technology and data analytics to offer user-friendly, transparent health insurance plans, differentiating itself in a traditionally complex industry.
Its focus on member engagement, telemedicine, and cost-effective care management positions it well to capture market share as healthcare consumers increasingly demand digital-first solutions.
The company’s expanding footprint in both individual and Medicare Advantage markets provides multiple growth avenues.
3. Long-Term Vision and Market Opportunity
Beyond 2025, forecasts remain highly bullish, with OSCR projected to reach $53.77 by 2027 and nearly $100 by 2030, reflecting strong secular growth potential in the health insurance and digital health sectors.
Analysts see Oscar as a disruptive force with the potential to reshape healthcare delivery, driving substantial long-term shareholder value.
4. Improving Financial Metrics and Operational Execution
Oscar has been improving its loss ratios and operating efficiencies, which are critical for sustainable profitability.
The company’s investments in technology infrastructure and data-driven care management are expected to translate into better margins and revenue growth over time.
5. Market Sentiment and Analyst Ratings
While some platforms show mixed short-term sentiment, the dominant analyst consensus is a "Buy" or "Moderate Buy," supported by strong price targets and growth forecasts.
The stock’s current undervaluation relative to its growth potential creates a favorable risk-reward profile for investors.
GBPJPY WEEKLY HTF FORECAST Q2 W25 Y25GBPJPY WEEKLY HTF FORECAST Q2 W25 Y25
Professional Risk Managers👋
Welcome back to another FRGNT chart update📈
Diving into some Forex setups using predominantly higher time frame order blocks alongside confirmation breaks of structure.
🔑 Remember, to participate in trading comes always with a degree of risk, therefore as professional risk managers it remains vital that we stick to our risk management plan as well as our trading strategies.
📈The rest, we leave to the balance of probabilities.
💡Fail to plan. Plan to fail.
🏆It has always been that simple.
❤️Good luck with your trading journey, I shall see you at the very top.
🎯Trade consistent, FRGNT X
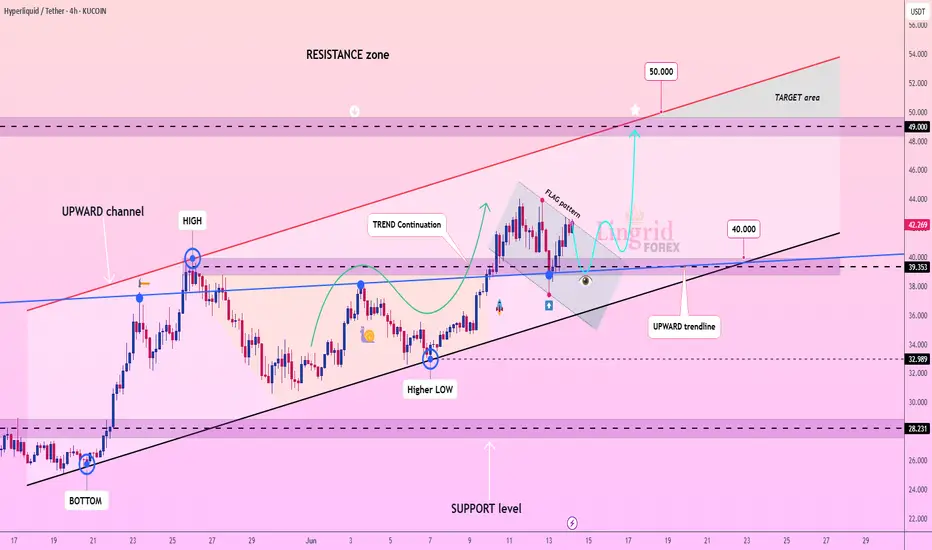
Lingrid | HYPEUSDT bullish Momentum Continuation LikelyKUCOIN:HYPEUSDT is consolidating after a breakout and forming a flag pattern, riding an established upward channel. Price has consistently respected the dynamic support from the trendline and the key horizontal level near 40.00. The recent higher low suggests momentum is intact for a bullish continuation toward the 49–50 target zone.
📈 Key Levels
Buy zone: 39.3–40.0
Sell trigger: breakdown below 39.0
Target: 50.0
Buy trigger: breakout above 43.0 with volume
💡 Risks
Failure to hold above 39.3 could invalidate bullish setup
Divergence signs may emerge on lower timeframes
Overall market sentiment could disrupt the clean trend formation
Traders, if you liked this idea or if you have your own opinion about it, write in the comments. I will be glad 👩💻
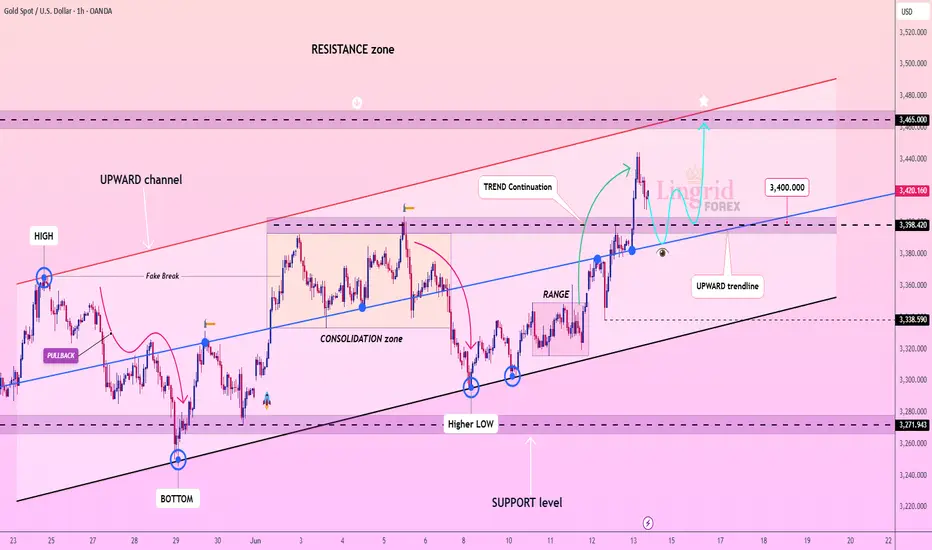
Lingrid | GOLD bullish Extension from the KEY Support ZoneOANDA:XAUUSD is climbing within a clean upward channel after rebounding strongly from the 3338 zone and forming higher lows. The recent breakout above the 3398.4 area signals a trend continuation setup toward the resistance line near 3465. Price is now testing the broken trendline from above, which could act as a launchpad for the next leg up.
📈 Key Levels
Buy zone: 3380–3390
Sell trigger: drop below 3380
Target: 3465
Buy trigger: bounce from 3400 zone with strong volume
💡 Risks
Rejection near 3440 may trigger a false breakout trap
Gold’s momentum may stall if it loses the 3380 trendline
Broader macro data could override technicals near resistance
Traders, if you liked this idea or if you have your own opinion about it, write in the comments. I will be glad 👩💻
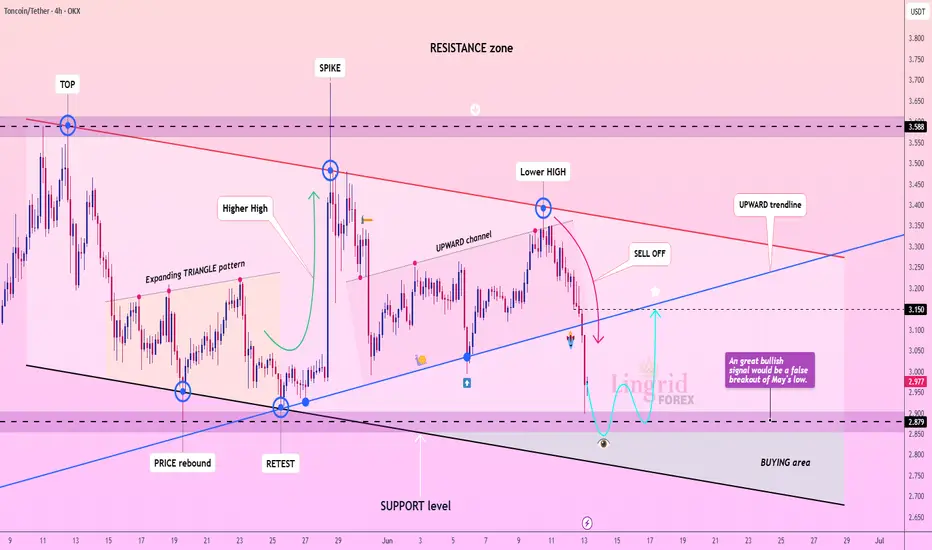
Lingrid | TONUSDT monthly Low Bounce OpportunityOKX:TONUSDT is undergoing a significant correction after forming a lower high near the 3.40 level, right under the red resistance trendline. The price has now broken below the upward channel, accelerating the sell-off toward the key support at 2.87. A false breakout below May’s low could act as a bullish trap and trigger a rebound back toward the 3.15 zone.
📈 Key Levels
Buy zone: 2.85–2.89
Sell trigger: confirmed breakdown below 2.87
Target: 3.15
Buy trigger: reclaim of 2.95 with bullish engulfing
💡 Risks
Continuation below 2.85 may invalidate bullish structure
Weak rebound could result in a lower high and further downtrend
Resistance at 3.15 remains firm and may cap upside potential
Traders, if you liked this idea or if you have your own opinion about it, write in the comments. I will be glad 👩💻
GBPUSD SHORT FORECAST Q2 W24 D13 Y25GBPUSD SHORT FORECAST Q2 W24 D13 Y25
Professional Risk Managers👋
Welcome back to another FRGNT chart update📈
Diving into some Forex setups using predominantly higher time frame order blocks alongside confirmation breaks of structure.
Let’s see what price action is telling us today!
💡Here are some trade confluences📝
✅Weekly order block
✅15' order block
✅Intraday 15' break of structure
✅Tokyo ranges to be filled
🔑 Remember, to participate in trading comes always with a degree of risk, therefore as professional risk managers it remains vital that we stick to our risk management plan as well as our trading strategies.
📈The rest, we leave to the balance of probabilities.
💡Fail to plan. Plan to fail.
🏆It has always been that simple.
❤️Good luck with your trading journey, I shall see you at the very top.
🎯Trade consistent, FRGNT X
Fakeout or Takeoff? Gold Retakes 3350 Before NY Close1. Recap of Yesterday's Move
Yesterday was a volatile day for Gold. Price initially broke above the key 3340–3350 resistance zone, only to drop back below it—but intriguingly, it closed above it on the New York session. That close is the detail that changes everything.
2. Key Question: Will Gold Stay Above 3400 and Push Toward New ATHs?
Let’s split this into two scenarios:
________________________________________
🟢 Bullish Scenario – Buy the Dip?
• The short-term structure is undeniably bullish.
• The reclaim of 3340–3350 is not a fakeout, but a clean signal of strength.
• If momentum holds, we can expect price to push toward 3405 and then 3435.
• As such, the strategy remains: buy dips, targeting those key levels.
________________________________________
🟡 Long-Term Breakout? Not So Fast
• Yes, the higher lows at 3120, 3250, and 3295 suggest that the correction from 3500 may be over.
• A clean breakout and stabilization above 3400, ideally near 3430, could signal a path toward a new all-time high.
• ❗ However, volatility remains wild, and if geopolitical tensions de-escalate or trade tariffs get resolved, Gold could see a sharp drop of 1500–2000 pips, as part of a broader risk-off unwind. Peace and stability could hurt safe-haven demand.
________________________________________
📌 Trading Plan
• Short-term: Buy dips while above 3340-3350 (ideally on a re-test), aiming for 3405 and 3435.
• Long-term: Stay flexible. Wait for confirmation above 3430 before going for the ATH narrative.
________________________________________
💡 Conclusion
Technically, Gold is bullish in both the short and long term. But with global uncertainty in play, don't ignore the fundamentals. Trade the chart, but respect the world around it. 🚀
Disclosure: I am part of TradeNation's Influencer program and receive a monthly fee for using their TradingView charts in my analyses and educational articles.
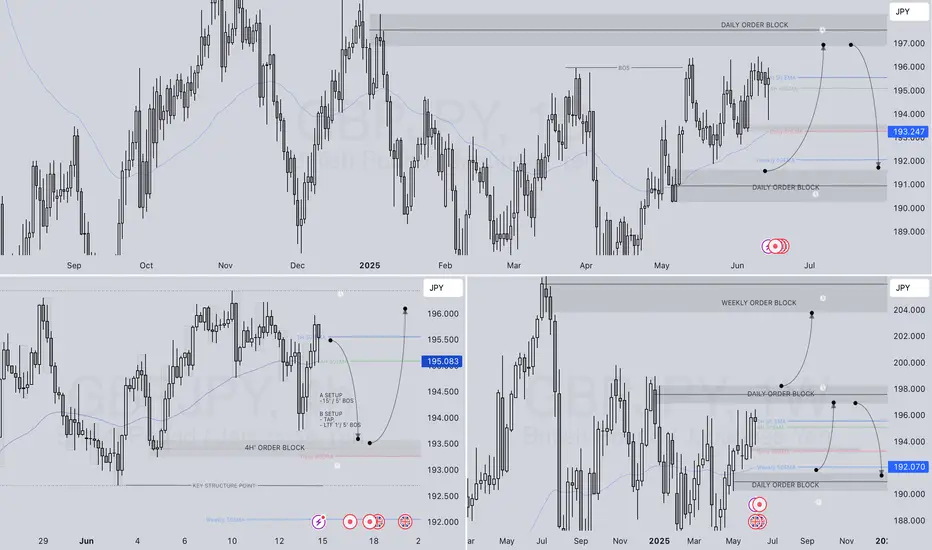
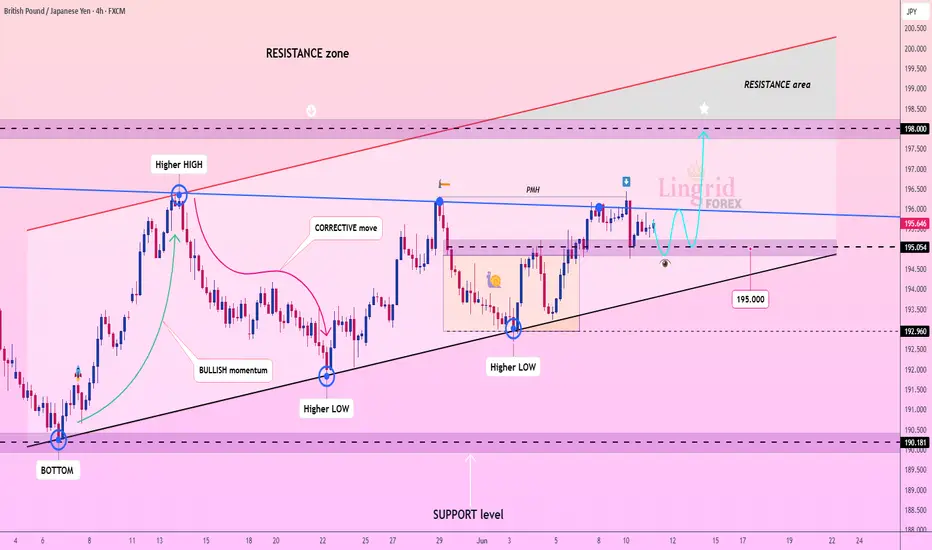
Lingrid | GBPJPY potential Extension after Bullish BreakoutOANDA:GBPJPY is consolidating just above the key support around 195.05 after bouncing from a higher low and failing to hold the recent breakout above PMH. The bullish structure remains intact within the upward channel, but the pair is currently lacking momentum. If price holds above 195.00 and forms a new bullish wave, a push toward 198.00 remains likely.
📈 Key Levels
Buy zone: 194.80–195.20
Buy trigger: bullish confirmation above 195.60
Target: 198.00
Sell trigger: break below 194.80 with strong volume
💡 Risks
Failure to hold 195 could shift structure to neutral
Extended range may lead to choppy conditions
Yen strength could trigger sudden reversals from resistance
Traders, if you liked this idea or if you have your own opinion about it, write in the comments. I will be glad 👩💻
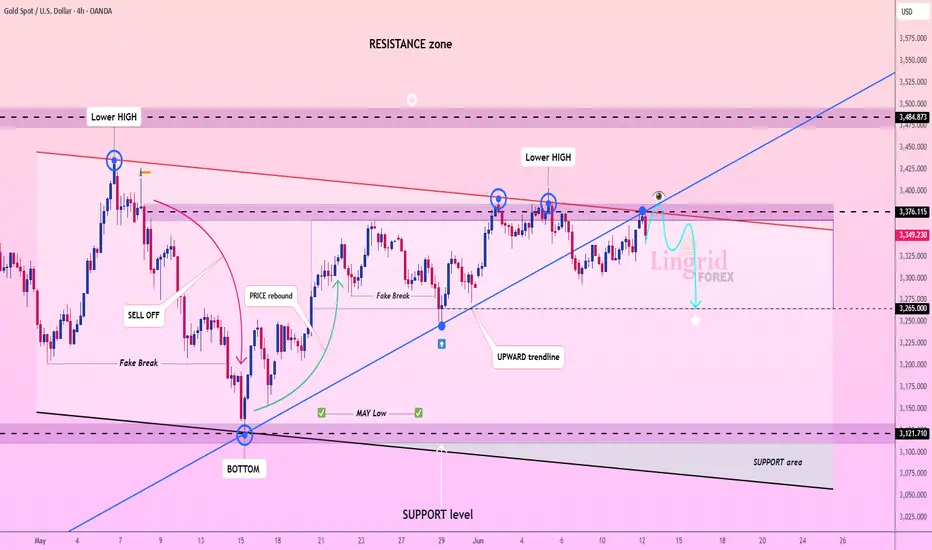
Lingrid | GOLD Consolidation ZONE: Possible SHORT SetupOANDA:XAUUSD has formed multiple lower highs near the 3376–3380 zone, consistently rejecting the descending red trendline within the resistance area. Despite a strong rebound from the May low, price is now testing the underside of this multi-touch resistance and stalling just under 3376. A rejection from this region may trigger a drop toward the support level at 3265.
📈 Key Levels
Sell zone: 3370–3376
Sell trigger: breakdown below 3340
Target: 3265
Buy trigger: breakout above 3385 with momentum
💡 Risks
Breaking above 3385 would invalidate the bearish thesis
False breakout patterns are present, so wicks above may trap sellers
Trendline support around 3300 must hold to avoid further downside momentum
Traders, if you liked this idea or if you have your own opinion about it, write in the comments. I will be glad 👩💻
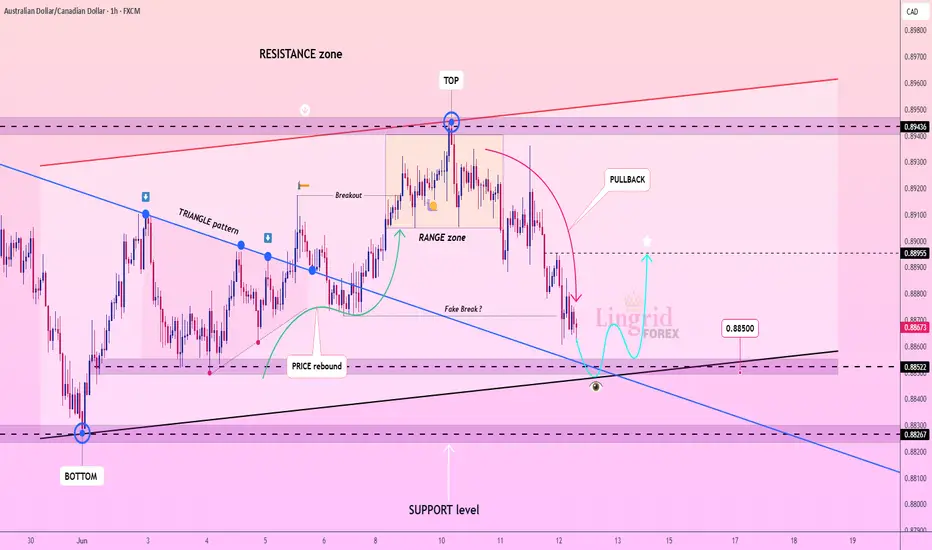
Lingrid | AUDCAD buying Opportunity at Channel Support BorderThe price perfectly fulfilled my last idea . OANDA:AUDCAD has pulled back sharply after forming a top at 0.8943 and is now approaching confluence support near the intersection of an upward trendline and horizontal zone around 0.8850. Price is showing early signs of stabilization, suggesting potential for a bullish reaction if the zone holds. A rebound from here could target the 0.8895 resistance level.
📈 Key Levels
Buy zone: 0.88500–0.88600
Buy trigger: bullish engulfing above 0.88650
Target: 0.88955
Sell trigger: break below 0.88260
💡 Risks
Loss of trendline support opens downside to 0.88260
Price may retest lower support before rebounding
Resistance near 0.8895 could cap recovery bounce
Traders, if you liked this idea or if you have your own opinion about it, write in the comments. I will be glad 👩💻