USDCHF LONG FORECAST Q2 W24 D12 Y25USDCHF LONG FORECAST Q2 W24 D12 Y25
Professional Risk Managers👋
Welcome back to another FRGNT chart update📈
Diving into some Forex setups using predominantly higher time frame order blocks alongside intraday confirmation & breaks of structure.
Let’s see what price action is telling us today! 🔥
💡Here are some trade confluences📝
✅Weekly order block rejection
✅Daily order block rejection
✅15’ order block
✅Intraday bullish breaks of structure
🔑 Remember, to participate in trading comes always with a degree of risk, therefore as professional risk managers it remains vital that we stick to our risk management plan as well as our trading strategies.
📈The rest, we leave to the balance of probabilities.
💡Fail to plan. Plan to fail.
🏆It has always been that simple.
❤️Good luck with your trading journey, I shall see you at the very top.
🎯Trade consistent, FRGNT X
Signalservice

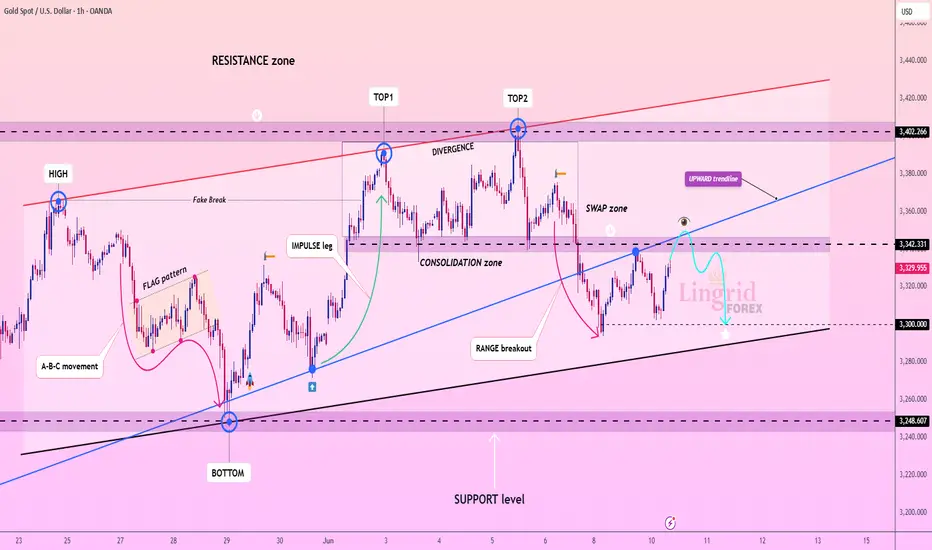
Lingrid | GOLD resistance Swap Zone Shorting OpportunityOANDA:XAUUSD is approaching a critical retest of the broken upward trendline and swap zone near 3342 after failing to maintain resistance above the 3400 area. The prior double top pattern and bearish divergence signal weakening momentum. If the price is rejected at the retest level, a move toward 3300 becomes likely.
📉 Key Levels
Sell trigger: rejection from 3340-3350 with lower high
Buy zone: 3295–3300
Target: 3300 and potentially 3245
Buy trigger: reclaim of 3342 with strong bullish candle
💡 Risks
Breakout above 3342 could reverse structure
Support at 3300 may hold firm on the first test
Weak volume could lead to fake moves in tight consolidation
Traders, if you liked this idea or if you have your own opinion about it, write in the comments. I will be glad 👩💻
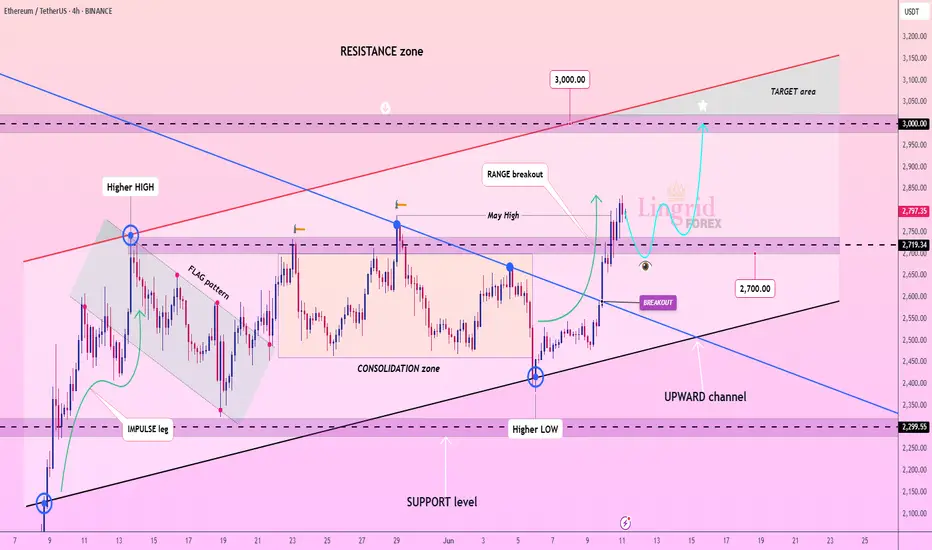
Lingrid | ETHUSDT May High Test - Continuation SetupThe price perfectly fulfilled my last idea . BINANCE:ETHUSDT has broken out of a long-standing consolidation zone and is now retesting the breakout area near 2719, which aligns with the May high and the downward trendline. Price is maintaining its position above the upward channel, showing a bullish structure with potential for continuation. A successful retest here may launch the next leg toward the 3000 resistance.
📈 Key Levels
Buy zone: 2680–2720
Buy trigger: bounce from 2719 with bullish engulfing
Target: 3000
Sell trigger: drop back below 2680
💡 Risks
Failure to hold the breakout could trap longs
Low volume during retest increases breakdown chances
3000 psychological resistance may cause premature rejection
Traders, if you liked this idea or if you have your own opinion about it, write in the comments. I will be glad 👩💻
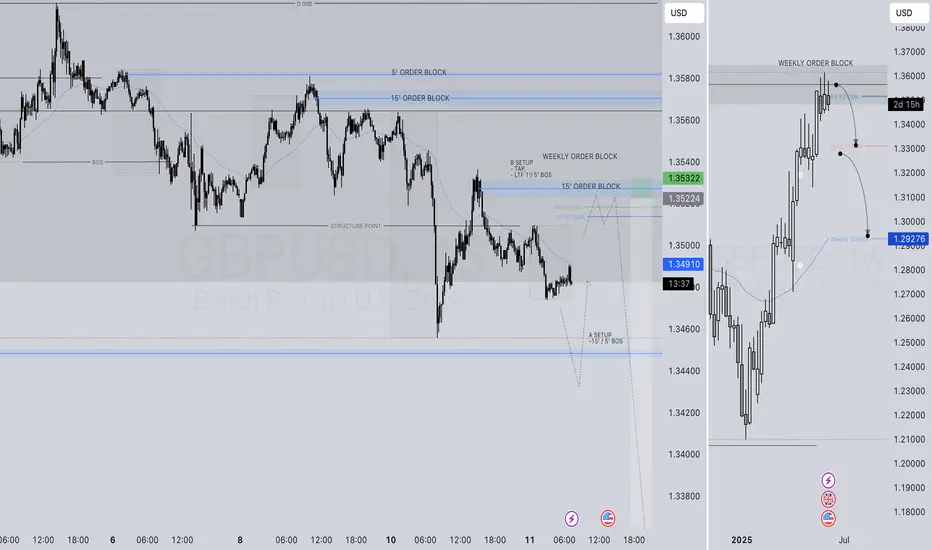
GBPUSD SHORT FORECAST Q2 W24 D11 Y25GBPUSD SHORT FORECAST Q2 W24 D11 Y25
Professional Risk Managers👋
Welcome back to another FRGNT chart update📈
Diving into some Forex setups using predominantly higher time frame order blocks alongside confirmation breaks of structure.
Let’s see what price action is telling us today!
💡Here are some trade confluences📝
✅Weekly order block
✅15' order block
✅Intraday 15' break of structure
✅Tokyo ranges to be filled
🔑 Remember, to participate in trading comes always with a degree of risk, therefore as professional risk managers it remains vital that we stick to our risk management plan as well as our trading strategies.
📈The rest, we leave to the balance of probabilities.
💡Fail to plan. Plan to fail.
🏆It has always been that simple.
❤️Good luck with your trading journey, I shall see you at the very top.
🎯Trade consistent, FRGNT X
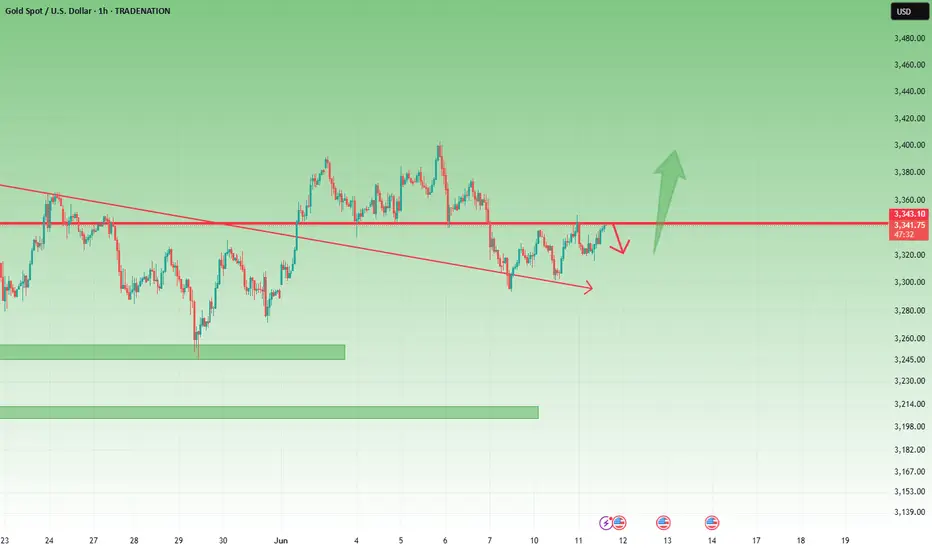
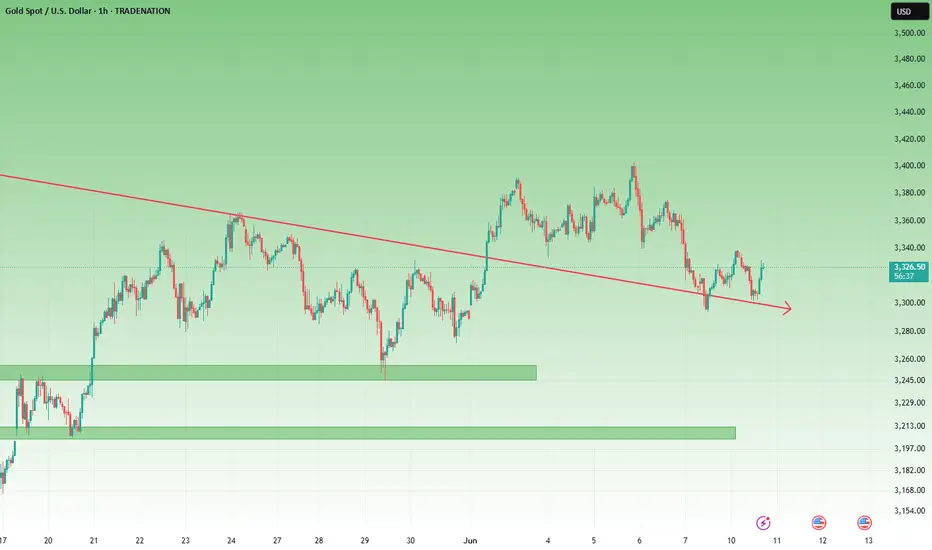
XAUUSD Builds Higher Floors – 3350 Under Pressure1. Recap of Yesterday’s View
In yesterday’s analysis, I noted that Gold appeared to have built a strong floor around 3300, and while the 3340–3350 resistance zone was still capping the upside, the structure hinted at a potential breakout.
2. What Happened Since?
✅ Price once again rallied into resistance and was rejected.
But here’s the key shift:
🔹 This time, the drop only reached 3315, and it was quickly bought back.
🔹 A new higher base around 3320 is now visible.
🔹 Gold is already back into the resistance zone.
3. Technical Implication
This evolving structure signals bullish pressure is building.
Every dip is being bought higher than the last — a classic sign of demand stepping in.
We are now closer than ever to a confirmed breakout.
4. Trading Strategy
📌 A clear break and close above 3350 = breakout confirmed
🎯 Target: 3400 and above
📉 Until then, buying dips into 3315–3320 remains my preferred strategy.
5. Final Thoughts
The yellow metal is coiling tightly under resistance.
The higher floors are shouting one thing: buyers are in control.
Disclosure: I am part of TradeNation's Influencer program and receive a monthly fee for using their TradingView charts in my analyses and educational articles.
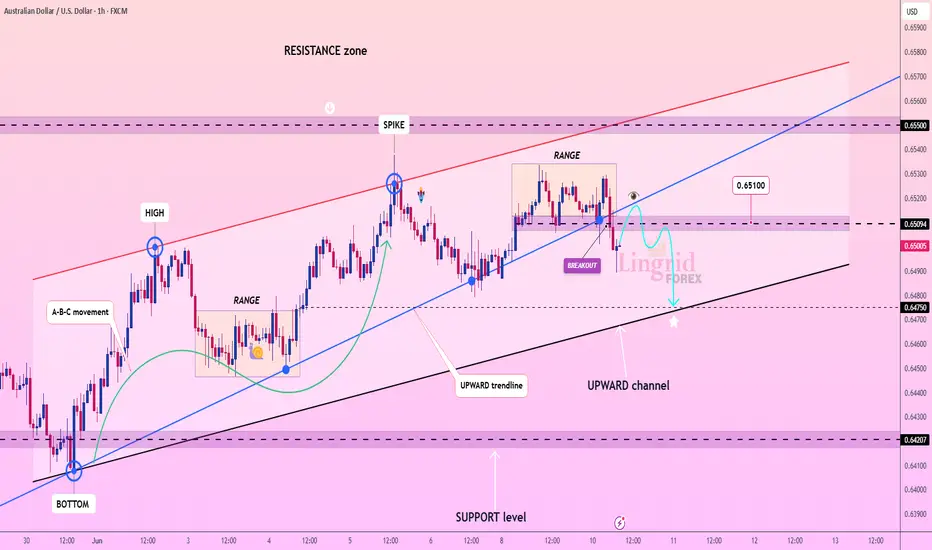
Lingrid | AUDUSD sideways Action at Monthly ResistanceThe price perfectly fulfilled my previous idea . OANDA:AUDUSD has broken below the short-term range and upward trendline near 0.6510, suggesting weakness after failing to hold the breakout. The price is now testing support from the lower boundary of the broader upward channel. A breakdown below 0.6475 may confirm a bearish swing toward deeper support levels.
📉 Key Levels
Sell trigger: confirmed rejection from 0.6510
Buy zone: 0.6460–0.6475 for rebound attempt
Target: 0.6475
Buy trigger: recovery and hold above 0.6510 with bullish momentum
💡 Risks
Reclaiming 0.6510 invalidates breakdown thesis
Channel support bounce could trap sellers
Upcoming macro data may trigger whipsaws in either direction
Traders, if you liked this idea or if you have your own opinion about it, write in the comments. I will be glad 👩💻
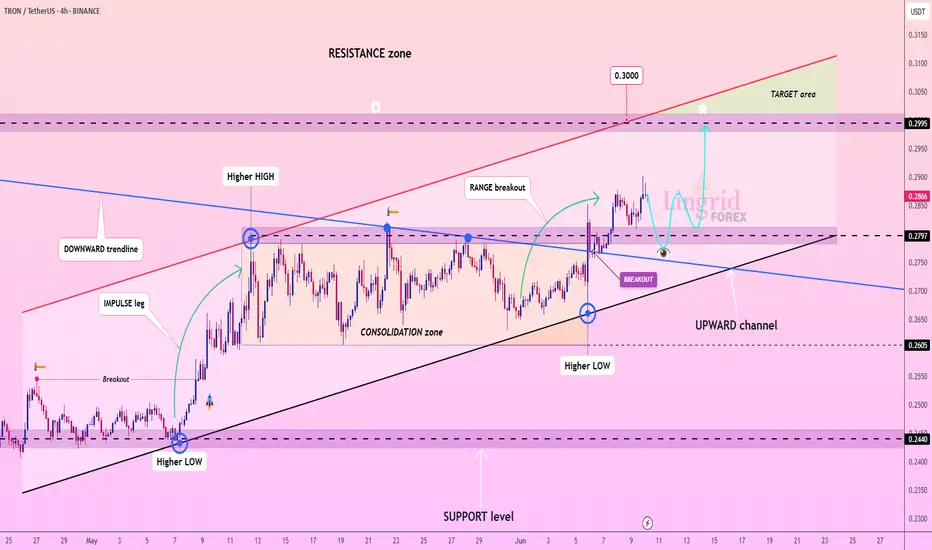
Lingrid | TRXUSDT continuation Pattern Setup. Potential LongThe price perfectly fulfilled my last idea . BINANCE:TRXUSDT has broken out above a long-term consolidation range and is retesting the breakout zone near 0.2797. Price action remains within a strong upward channel, and a successful retest here could launch a rally toward the 0.2995–0.3000 target area. Maintaining higher lows supports a bullish continuation.
📈 Key Levels
Buy zone: 0.2750–0.2800
Buy trigger: bounce with bullish confirmation near 0.2797
Target: 0.2995–0.3000
Sell trigger: breakdown below 0.2750 and upward channel
💡 Risks
Breakdown of 0.2750 could shift bias back to neutral
Rising wedge risk if momentum stalls below 0.3000
Rejection at resistance may trigger a retest of 0.2605 support
Traders, if you liked this idea or if you have your own opinion about it, write in the comments. I will be glad 👩💻
Gold Outlook: From Resistance Rejection to Bullish Revival1. Recap of Yesterday's Expectations
In my previous analysis, I highlighted the 3340–3350 zone as key resistance and suggested that any rise into that area could give sellers a better entry.
✅ Indeed, price rallied into that zone and was rejected, validating the plan.
2. What Happened Next?
After rejecting the resistance, gold touched 3300 again, but again, the bulls stepped in:
🔹 A higher low formed compared to the previous day.
🔹 This suggests the market is now shifting its structure from down to potential up.
3. Why 3300 Looks Like the New Floor
Several bullish clues:
- The quick bounce back to 3330 shows buying power.
- Price structure is developing a series of higher lows.
- This suggests growing confidence from buyers.
4. Trading Plan
🔸 A break above 3340 would confirm bullish momentum and open the door toward 3400 again.
🔸 Any dives toward 3300 should now be viewed as potential buying opportunities.
5. Final Thoughts
The market is telling a story of bullish pressure building under 3340 and potential break back above.
Disclosure: I am part of TradeNation's Influencer program and receive a monthly fee for using their TradingView charts in my analyses and educational articles.
Lingrid | BTCUSDT support Bounce After Flag Pattern BreakoutBINANCE:BTCUSDT recently rebounded from the intersection of the upward channel and horizontal support near 103,705 after a false breakdown from the flag pattern. The price is now challenging the downward trendline from above, hinting at a potential breakout. A sustained move above this zone may open the path toward the 108,800 resistance.
📈 Key Levels
Buy zone: 103,500–104,000
Buy trigger: breakout and close above 105,600
Target: 108,800
Sell trigger: close below 103,000
💡 Risks
Rejection from the downward trendline could revive bearish pressure
Sideways consolidation under resistance weakens momentum
A break below the channel base may invalidate the bullish setup
Traders, if you liked this idea or if you have your own opinion about it, write in the comments. I will be glad 👩💻

Lingrid | GOLD Weekly Market Analysis: Consolidation ContinuesTVC:GOLD has developed a double top pattern, marking a significant shift from the previous consolidation phase. The recent rejection from the $3,400 resistance zone has created a bearish reversal structure that's now testing critical support levels. 4H chart reveals a clear double top formation with peaks around $3,400, followed by a decisive breakout below the flag pattern that previously suggested continuation. This technical deterioration represents a major shift in market structure, with the upward trendline now serving as resistance rather than support.
Current price action at $3,309 sits dangerously close to the key support level at $3,245. A break below this zone would likely trigger accelerated selling toward the major support area around $3,120, representing the bottom of the recent consolidation range. Previous weekly highs (PWHs) around $3,354 now serve as immediate resistance, with the double top peaks at $3,400 representing the more significant barrier. Any recovery attempts will likely face selling pressure at these levels, creating a challenging environment for bullish momentum.
The upward trendline breach is another bearish development, as this line had provided support throughout the entire rally from the cycle lows. Its violation suggests a potential shift in the primary trend structure, though the major support at $3,120 remains intact. However, the major support confluence around $3,120 could provide a lifeline for bulls. This level represents multiple technical factors including previous significant lows and the bottom of the recent consolidation range, making it a natural area for buying interest to emerge.
The current setup suggests gold is entering a more challenging phase where rallies may be sold rather than bought. The shift from continuation to reversal patterns indicates a potential change in market sentiment that could persist until major support levels are tested and either hold or break decisively.
Traders, if you liked this idea or if you have your own opinion about it, write in the comments. I will be glad 👩💻

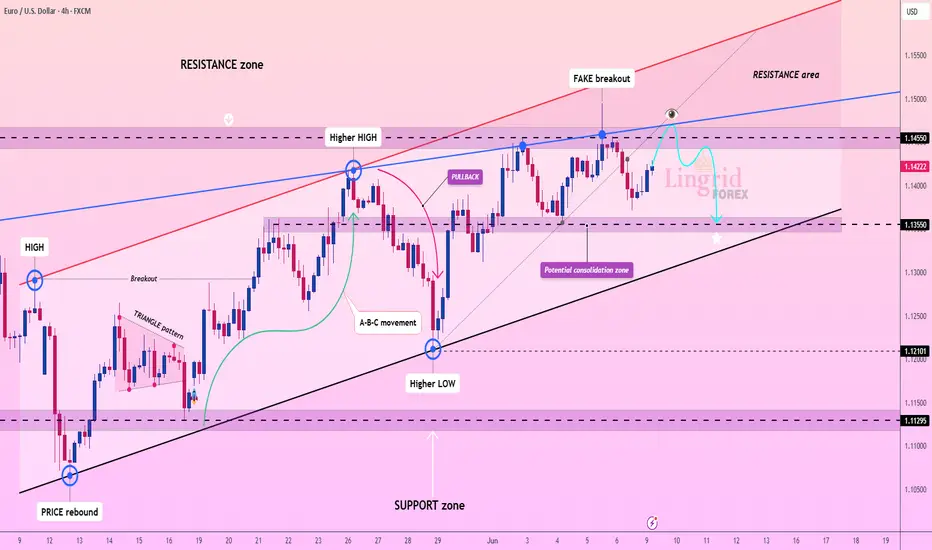
Lingrid | EURUSD potential Sideways Consolidation PhaseFX:EURUSD recently tested the upper boundary of the resistance zone near 1.14550 and produced a fake breakout above the trendline. The pair is now showing signs of hesitation below that level, suggesting a potential move toward the consolidation area. A breakdown below 1.14000 may trigger a decline back to 1.13550 support.
📈 Key Levels
Buy zone: 1.13550–1.13800
Buy trigger: bounce from support with bullish engulfing pattern
Target: 1.14550
Sell trigger: confirmed close below 1.14000
💡 Risks
Prolonged consolidation weakens bullish momentum
Failure to reclaim 1.14550 may lead to deeper pullback
Breakdown of trendline support would shift bias bearish
Traders, if you liked this idea or if you have your own opinion about it, write in the comments. I will be glad 👩💻
Lingrid | AUDJPY possible WEEKLY High BreakoutThe price perfectly fulfilled my last idea . FX:AUDJPY is holding above its upward trendline after rebounding off support near 93.34, forming a higher low structure. The pair is consolidating just below the resistance zone, suggesting a potential continuation toward the 94.15 target. A break above the recent local high could reignite bullish momentum.
📈 Key Levels
Buy zone: 93.34–93.45
Buy trigger: breakout above 93.80
Target: 94.15
Sell trigger: breakdown below 93.30
💡 Risks
Rejection from 93.80 weakens the upward setup
Drop below trendline support may signal a shift to downside
False breakout above 94.00 could trap early buyers
Traders, if you liked this idea or if you have your own opinion about it, write in the comments. I will be glad 👩💻

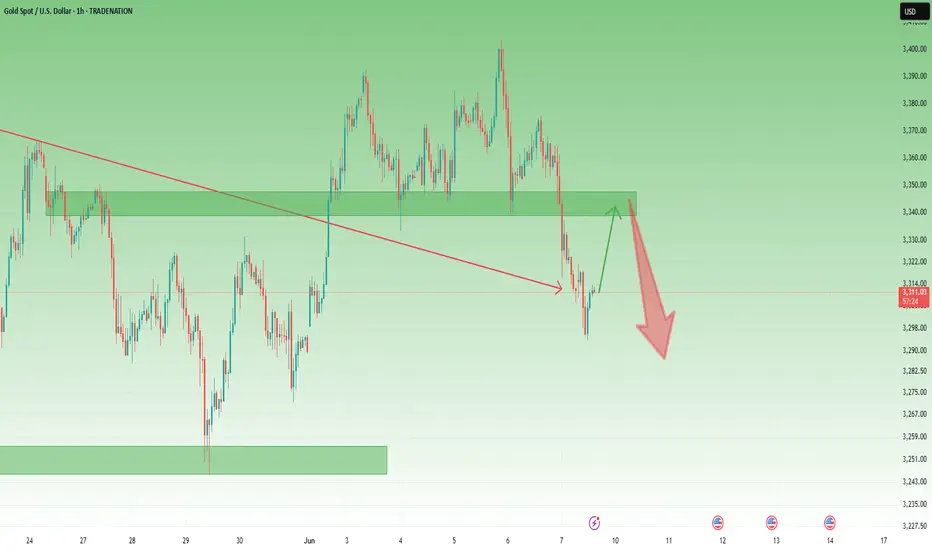
Gold is vulnerable under 3340-3350 zone1. What happened last week?
As expected, Gold broke below the key 3340–3350 support zone and even slipped under 3300 during the Asian session this Monday, briefly reaching new short-term lows. The bearish pressure continues to dominate.
2. Key question now:
Is the drop over?
3. Why I expect the correction to end soon:
- The recent decline totaled nearly 1100 pips – a strong impulse move.
- Price is now undergoing a typical retracement after a steep sell-off.
- The previous support zone at 3340–3350 is now acting as resistance – a textbook role reversal.
- I expect this zone to attract sellers again.
4. My trading plan:
I remain bearish and plan to sell rallies, especially if the price shows rejection signs in the 3340–3350 area. This correction could offer an ideal re-entry for shorts at better risk/reward levels.
5. Final thoughts 🚀
The trend is still bearish. I’m waiting for the market to confirm resistance around 3340–3350 before executing my next move.
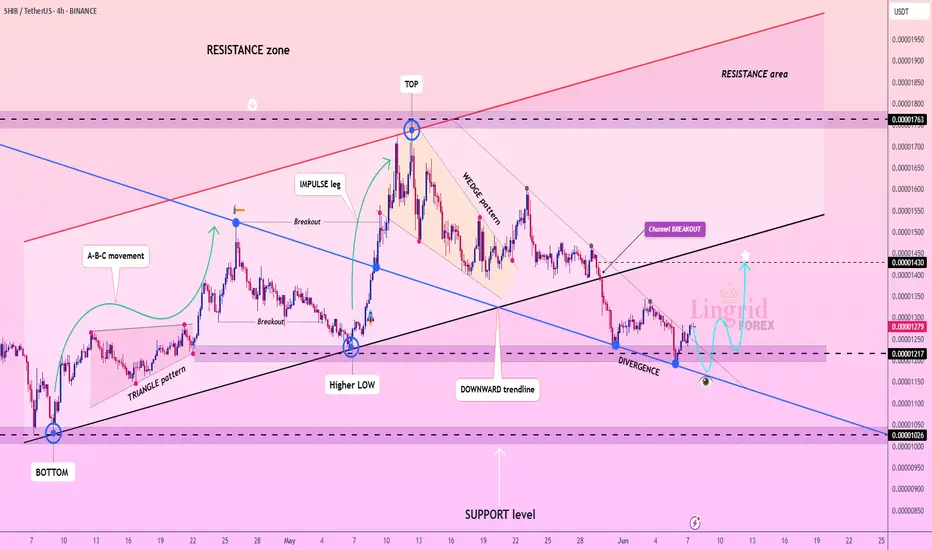
Lingrid | SHIBUSDT Bullish Divergence at Support ZoneBINANCE:SHIBUSDT is attempting to recover from a structural divergence near the key 0.00001217 support area. The recent breakout above the descending channel suggests bullish intent, though price is now retesting the breakout level. If buyers hold this zone, SHIB could rally toward 0.00001430.
📈 Key Levels
Buy zone: 0.00001205–0.00001230
Buy trigger: strong bounce above 0.00001250
Target: 0.00001430
Sell trigger: break below 0.00001200
💡 Risks
Failure to hold above 0.00001200 would invalidate the divergence setup
Rejection near the downward trendline could trigger renewed downside
Market-wide weakness may cap follow-through beyond resistance
Traders, if you liked this idea or if you have your own opinion about it, write in the comments. I will be glad 👩💻
Lingrid | GOLD trend Continuation Targets April High RetestOANDA:XAUUSD has reclaimed the 3,350 level following a successful retest of the upward trendline, sustaining a bullish channel structure. After multiple breakouts and a clean consolidation above previous resistance, price is setting up for a potential move toward the 3,500 mark. A pullback and bounce near 3,330 would reinforce this bullish continuation scenario.
📈 Key Levels
Buy zone: 3,338–3,345
Buy trigger: strong bullish candle above 3,365
Target: 3,500
Sell trigger: break below 3,338 with volume
💡 Risks
Rejection near 3,365 could delay breakout
Breakdown below 3,338 weakens bullish trend
Consolidation flattening may reduce momentum burst potential
Traders, if you liked this idea or if you have your own opinion about it, write in the comments. I will be glad 👩💻

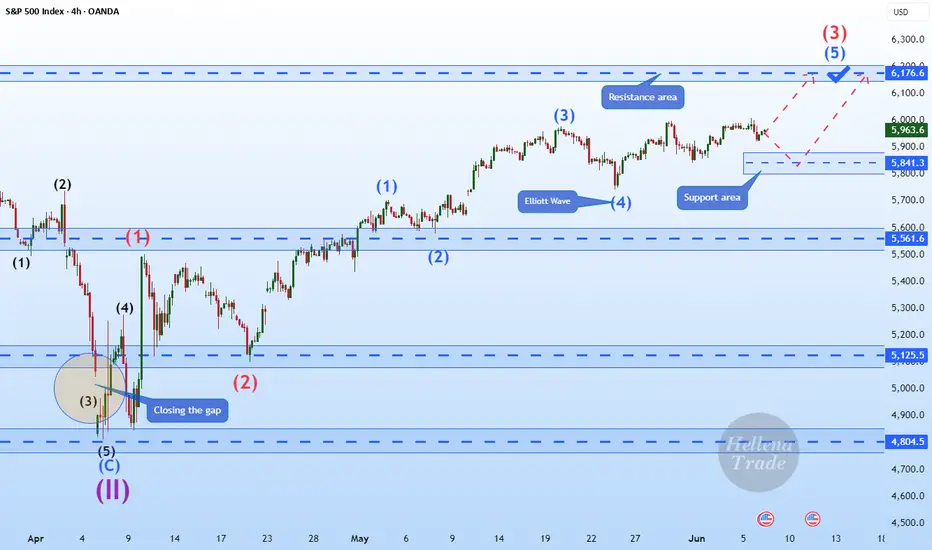
Hellena | SPX500 (4H): LONG resistance area of 6176.6.Colleagues, it appears that price has not yet completed the upward movement in a five-wave move.
At the moment I expect the continuation of wave “3” and reaching the target in the resistance area of 6176.6.
Manage your capital correctly and competently! Only enter trades based on reliable patterns!
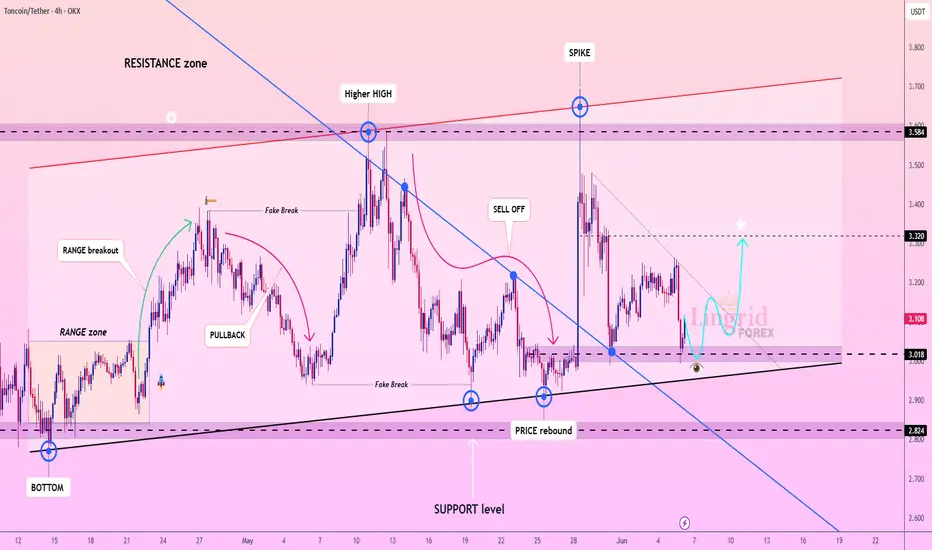
Lingrid | TONUSDT Consolidating Within Defined Trading RangeOKX:TONUSDT is attempting a rebound from key support near 3.00$ after a sharp sell-off from the upper resistance area. The chart shows a higher low structure forming just above trendline support, hinting at a bullish reversal setup. If price holds this zone, a breakout through the descending trendline could trigger a run toward 3.320.
📈 Key Levels
Buy zone: 3.010–3.050
Buy trigger: breakout and close above 3.140
Target: 3.320
Sell trigger: drop below 3.000
💡 Risks
Failure to reclaim 3.140 keeps bearish pressure active
Breakdown of trendline may retest 2.824
Repeated rejections below 3.120 could delay breakout attempt
Traders, if you liked this idea or if you have your own opinion about it, write in the comments. I will be glad 👩💻
Gold Update – The Reversal Is Still in PlayYesterday’s price action confirmed what we’ve been discussing in recent updates: the upside is vulnerable, and the real move could be lower.
Gold did push toward the 3400 zone, as expected — but that test was short-lived. Sellers stepped in aggressively, and price dropped back toward the 3350 support zone, closing the day with a bearish engulfing candle on the daily chart.
Will we have a new leg down?
That’s the big question now. While bulls are hoping for continuation, the current rebound is weak and seems to be shaping into a bear flag.
Why I Expect More Downside:
- Strong rejection from 3400 key level
- Daily chart printed a bearish engulfing
- Rebound structure looks corrective, not impulsive
Trading Plan:
I continue to look for selling opportunities on spikes, especially near resistance levels like 3375–3385.
If the 3340-3350 zone falls, I expect down acceleration and a drop even to 3200 zone.
Disclosure: I am part of TradeNation's Influencer program and receive a monthly fee for using their TradingView charts in my analyses and educational articles.

GOLD Today3 Scenarios
1 - Waiting for Strong Bearish H1 after London and entry sell
2. Wait for break structure on H4 (on screen) entry sellstop
3. Break yesterday Daily above - looking buy setup

Lingrid | EURCAD long OPPORTUNITY in Consolidation ZoneFX:EURCAD has formed a double bottom at the intersection of the support level and upward trendline after a steep correction from the 1.57201 high. The price is consolidating just above 1.56000, showing signs of reversal as it tries to reclaim the bullish structure. A confirmed breakout above minor resistance may open a path toward the 1.56760 level.
📈 Key Levels
Buy zone: 1.55800–1.56050
Buy trigger: close above 1.56200
Target: 1.56760
Sell trigger: drop below 1.55800
💡 Risks
Failure to hold above the upward trendline could invite bearish continuation
Extended rejection from the swap zone limits upward momentum
Lower highs forming may signal weakening bullish strength
Traders, if you liked this idea or if you have your own opinion about it, write in the comments. I will be glad 👩💻

GOLD Today - Strong UPToday Gold give me a hugh profit.
50% account is done
100% Win rate, every order has profit.
Of course not all days is this same, but today was very clear.

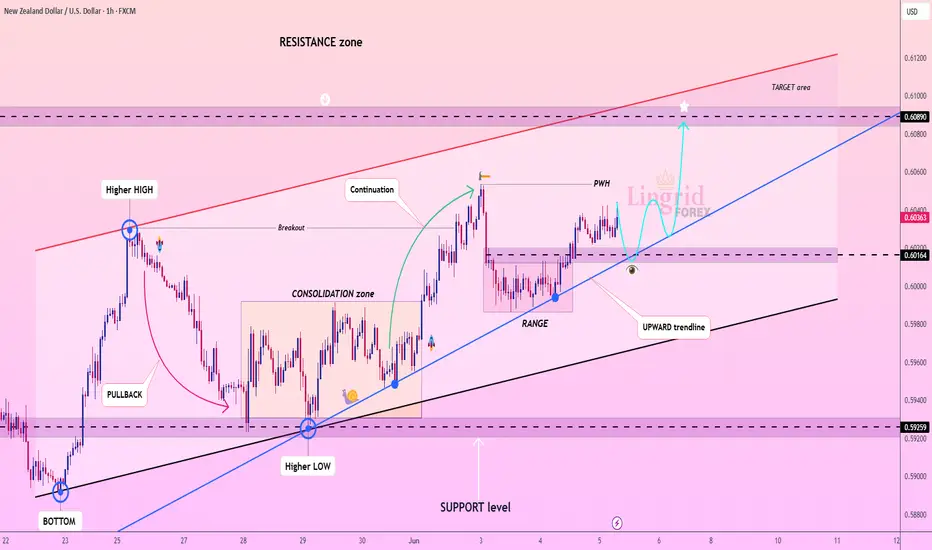
Lingrid | NZDUSD Uptrend Trend Continuation Trade FX:NZDUSD is trending within a clean upward channel, recently bouncing off the trendline near 0.60164. After consolidating in a narrow range, the pair is showing signs of upward continuation toward the 0.60890 resistance zone. A retest of the trendline followed by a bullish reaction could confirm the breakout move.
📈 Key Levels
Buy zone: 0.60160–0.60220
Buy trigger: breakout above 0.60400 with momentum
Target: 0.60890
Sell trigger: breakdown below 0.60100
💡 Risks
False breakout above 0.60400 may trap buyers
Close below trendline invalidates bullish structure
Range-bound price action may delay breakout follow-through
Traders, if you liked this idea or if you have your own opinion about it, write in the comments. I will be glad 👩💻
Lingrid | BNBUSDT channel Consolidation Sets Stage for Next MoveBINANCE:BNBUSDT is pulling back toward the 647–650 support area after forming a higher high inside its upward channel. Price remains above the long-term trendline, and consolidation within this zone hints at potential accumulation. A confirmed bounce from this zone could send price toward the 715 resistance target.
📈 Key Levels
Buy zone: 647–652
Buy trigger: breakout above 668 with volume
Target: 715
Sell trigger: breakdown below 640
💡 Risks
Failure to hold the channel support may trigger a deeper correction
Sideways chop below trendline weakens bullish structure
Volume divergence could signal short-term buyer exhaustion
Traders, if you liked this idea or if you have your own opinion about it, write in the comments. I will be glad 👩💻
