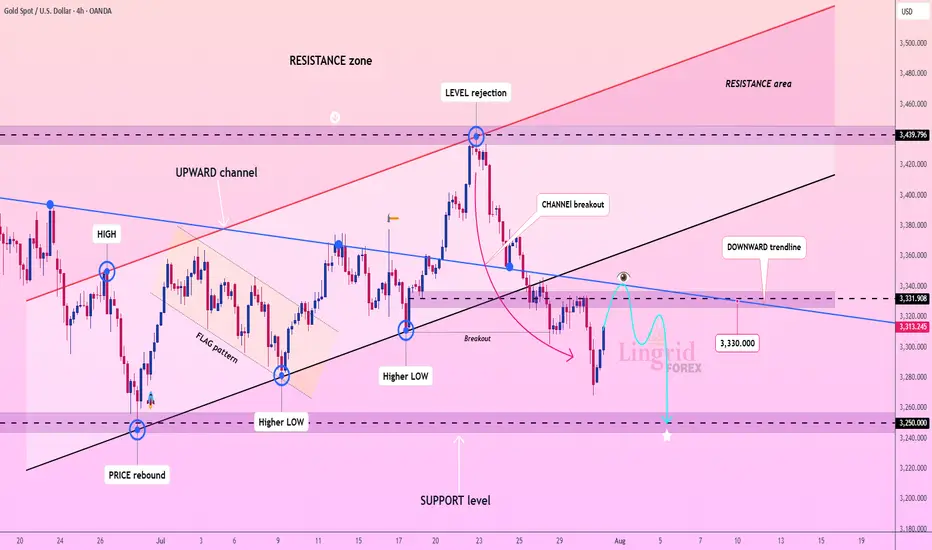
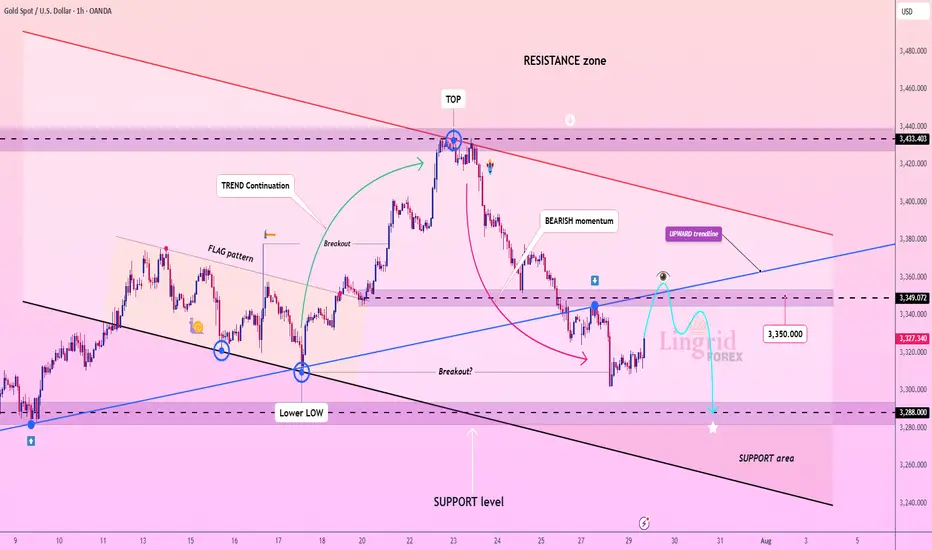
Lingrid | GOLD Possible Retest of the Major Support ZoneThe price perfectly fulfilled my previous idea . OANDA:XAUUSD is bouncing from recent lows but remains under pressure below the key resistance at 3,331.90 and the downward trendline. The prior rejection near 3,440 led to a steep selloff with a clean break below the upward channel. Current action shows a potential lower high forming near the broken trendline. A rejection there could send gold tumbling toward the 3,250.00 support zone.
📌 Key Levels
Sell trigger: Failure to reclaim 3,331.90
Sell zone: 3,330 – 3,340
Target: 3,250.00
Invalidation: Strong bullish breakout above 3,340 and descending trendline
💡 Risks
Bullish reversal breaking above downward trendline
Dovish Fed news boosting gold
Unexpected macroeconomic shocks increasing safe-haven demand
If this idea resonates with you or you have your own opinion, traders, hit the comments. I’m excited to read your thoughts!
Signalsprovider
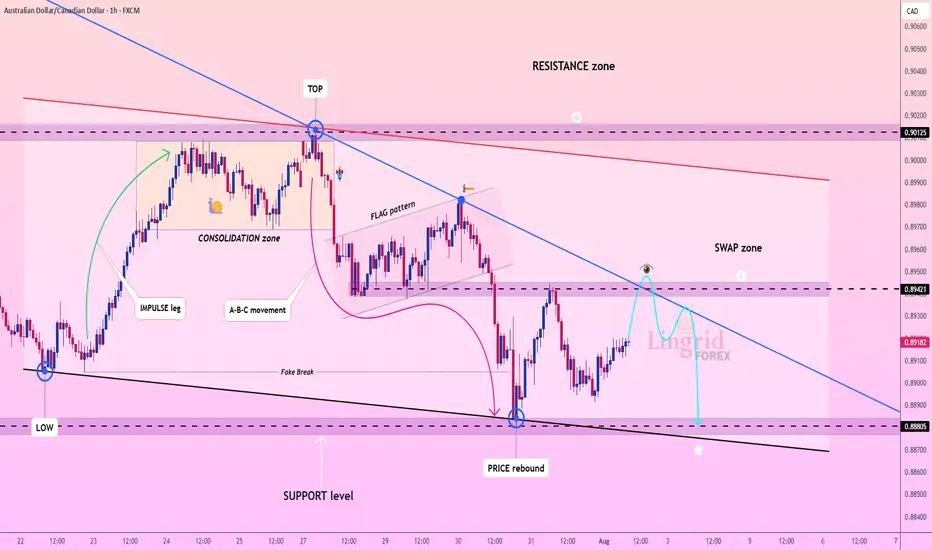
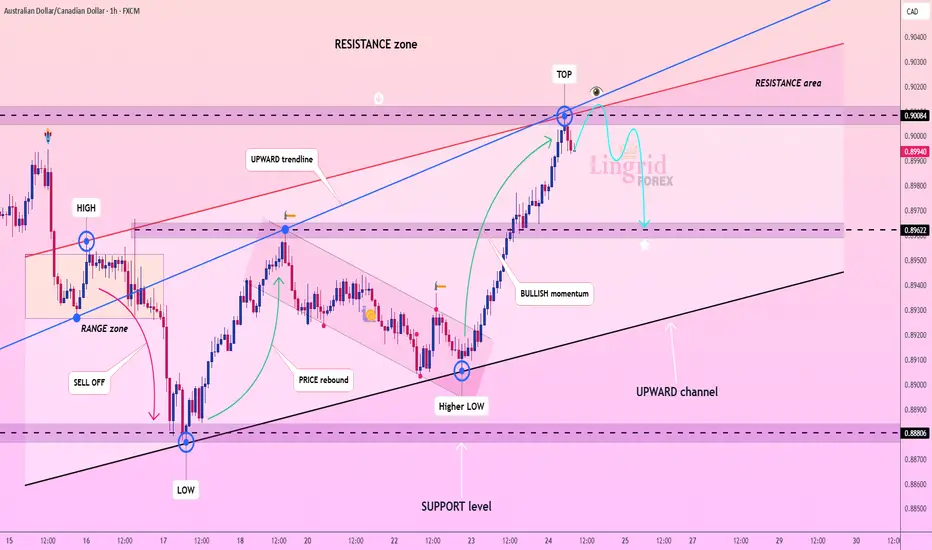
Lingrid | AUDCAD Swap Zone. Potential Selling OpportunityThe price perfectly fulfilled my last idea . FX:AUDCAD is rebounding from a strong support area after a fake break below 0.88805 and is now moving toward the descending trendline. The price is expected to test the swap zone near 0.89421, where prior support may flip to resistance. This setup favors a SELL scenario from the lower high structure within the flag and downtrend. A rejection from the trendline could resume the bearish continuation back toward support.
📌 Key Levels
Sell zone: 0.89421 – 0.89500
Buy zone: 0.88805 – 0.88600
Target: 0.88805
Invalidation: Break and close above 0.89550
💡 Risks
Bullish breakout through the descending trendline
Sharp reversal from macroeconomic news
Short-term consolidation above 0.89100 weakening momentum
If this idea resonates with you or you have your own opinion, traders, hit the comments. I’m excited to read your thoughts!
Lingrid | TONUSDT Potential Long From the KEY ZoneThe price perfectly fulfilled my last idea . OKX:TONUSDT is pulling back from a fake breakout above 3.590 but holding within the boundaries of an upward channel. The price is approaching strong confluence support near 3.250, where both the trendline and horizontal zone align. A rebound from this level could launch a new bullish leg toward the resistance zone. Buyers will look for confirmation at the bounce area to aim for 3.590 and beyond.
📌 Key Levels
Buy zone: 3.250 – 3.300
Sell trigger: Break below 3.250
Target: 3.590 – 3.700
Buy trigger: Bullish engulfing or breakout from local consolidation near 3.300
💡 Risks
Loss of support at 3.250 trendline
Bearish pressure from broader market sentiment
Another fakeout or choppy move around 3.300–3.400 zone
If this idea resonates with you or you have your own opinion, traders, hit the comments. I’m excited to read your thoughts!

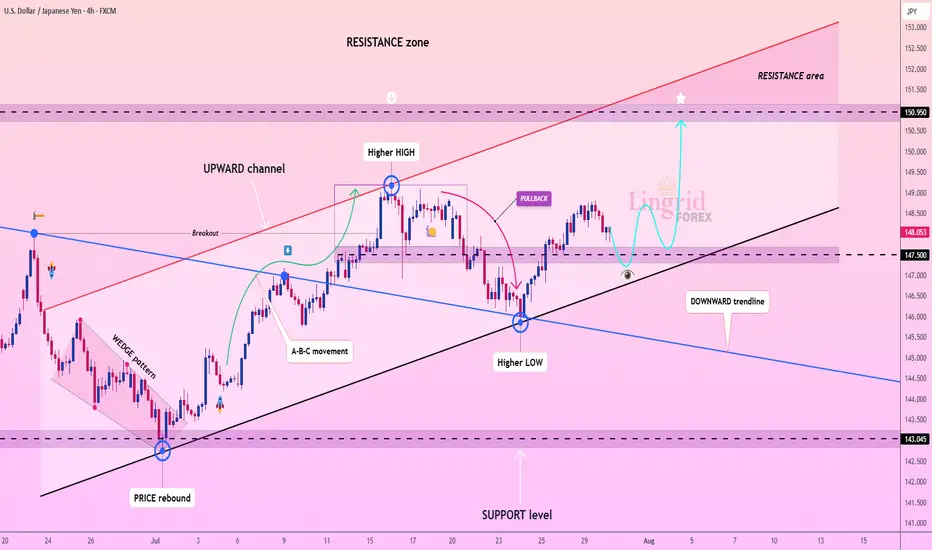
Lingrid | USDJPY Possible Strong Bullish RallyThe price perfectly fulfilled my previous idea . FX:USDJPY is trading within an upward channel after forming a higher low near the 147.50 zone, bouncing from the support trendline. Price action suggests a bullish structure continuation toward the 150.95 resistance, especially if the recent consolidation breaks higher. The overall formation aligns with a healthy correction phase before a potential push into the resistance area. Confirmation above 148.60 would likely accelerate the bullish move.
📌 Key Levels Buy zone: 147.50–147.25
Sell trigger: Below 147.00
Target: 150.95
Buy trigger: Break above 148.80
⚠️ Risks
Break below 147.50 may shift sentiment bearish
Strong resistance awaits near 150.00
Broader market volatility could invalidate pattern
If this idea resonates with you or you have your own opinion, traders, hit the comments. I’m excited to read your thoughts!
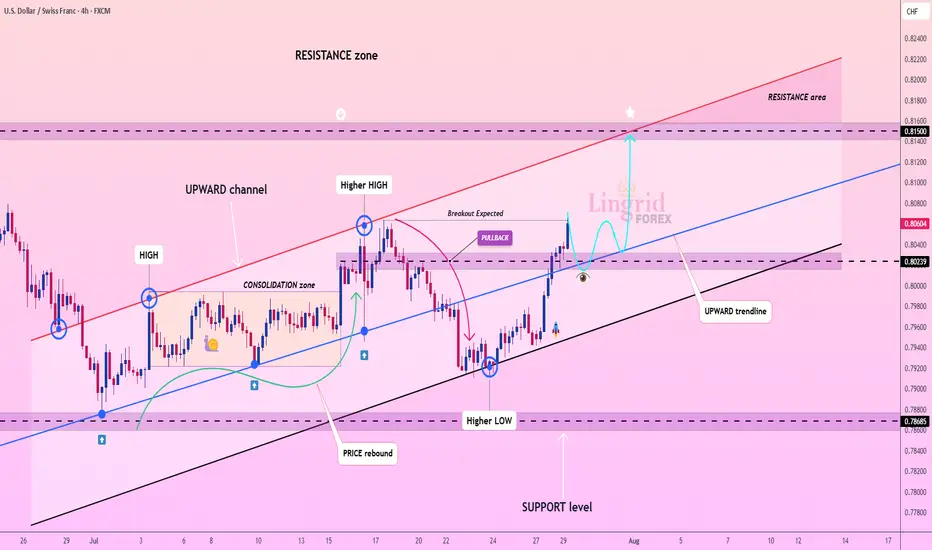
Lingrid | USDCHF Potential Bullish Move Following Level BreakoutFX:USDCHF surged from a higher low and is now retesting the broken structure near 0.802, maintaining its position within the broader upward channel. A clean bounce from this zone would confirm the bullish structure, targeting the upper channel resistance near 0.815. Pullback and higher low structure support continued upside movement with short-term consolidation possible. A breakout from the consolidation box could accelerate momentum toward the resistance area.
📈 Key Levels
Buy zone: 0.802 – 0.805
Buy trigger: Bullish confirmation above 0.805
Target: 0.815
Invalidation: Drop below 0.796
💡 Risks
False breakout near 0.805 may lead to rejection
Failure to form higher high would invalidate bullish sequence
Momentum divergence could slow rally near resistance
If this idea resonates with you or you have your own opinion, traders, hit the comments. I’m excited to read your thoughts!
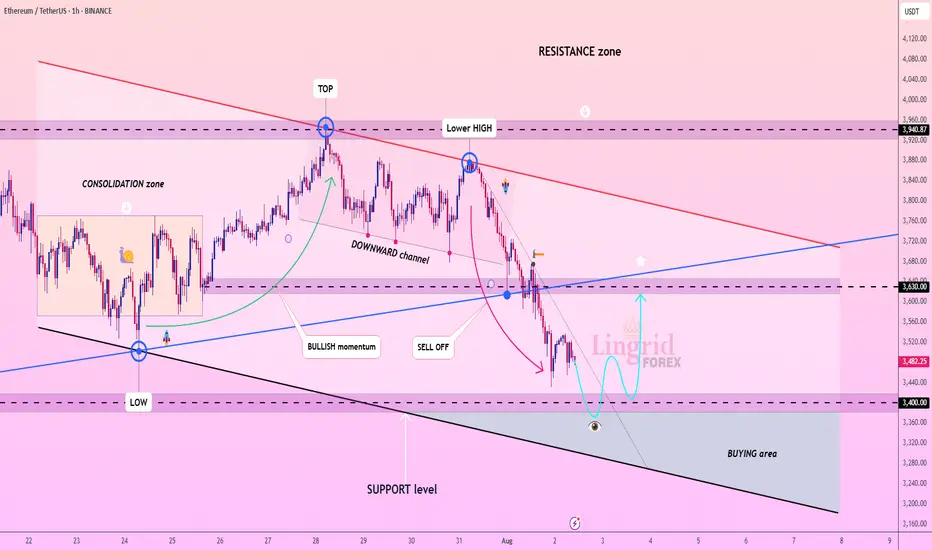
Lingrid | ETHUSDT Short-Term Move: Buying Opportunity at SupportThe price perfectly fulfilled my last idea . BINANCE:ETHUSDT is attempting a bounce after dipping into the lower boundary of its channel near the $3,400 support level. Price action has followed a descending structure with lower highs inside a broad downward channel. As long as the $3,400 zone holds, a rebound toward the mid-range resistance at $3,630 remains viable. Current positioning inside the "BUYING area" suggests momentum may flip bullish if a reversal structure forms.
📉 Key Levels
Buy trigger: Break above $3,630
Buy zone: $3,250 – $3,400
Target: $3,630 – $3,720
Invalidation: Break below $3,250
💡 Risks
Momentum still favors sellers from the recent sell-off
Failure to reclaim mid-range resistance could cap upside
Broader trend remains within a bearish channel structure
If this idea resonates with you or you have your own opinion, traders, hit the comments. I’m excited to read your thoughts!
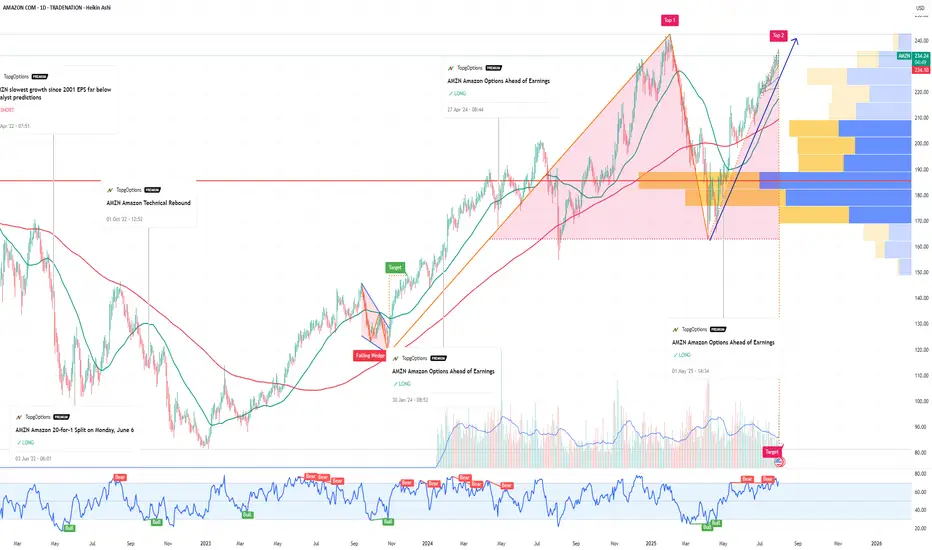
AMZN Amazon Options Ahead of EarningsIf you ahven`t bought the recent dip on AMZN:
Now analyzing the options chain and the chart patterns of AMZN Amazon prior to the earnings report this week,
I would consider purchasing the 245usd strike price Calls with
an expiration date of 2025-9-19,
for a premium of approximately $7.02.
If these options prove to be profitable prior to the earnings release, I would sell at least half of them.
Disclosure: I am part of Trade Nation's Influencer program and receive a monthly fee for using their TradingView charts in my analysis.
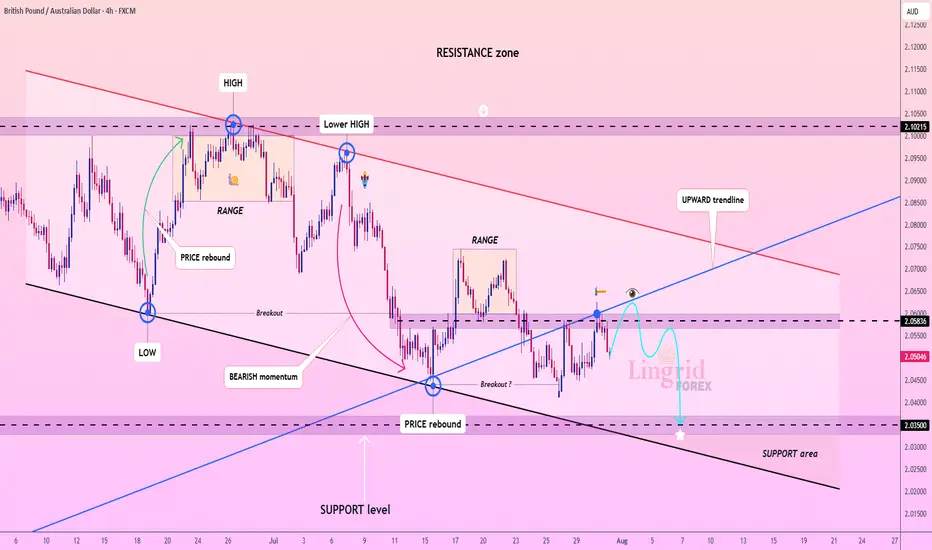
Lingrid | GBPAUD Bearish Pressure. Potential ShortThe price perfectly fulfilled my previous idea . FX:GBPAUD rebounded from support and has climbed into a tight resistance zone near 2.05836, but momentum remains weak near the downward trendline. The price structure shows a sequence of lower highs and a tight range below resistance, suggesting sellers are still in control. A rejection at this level would confirm another failed breakout attempt. If confirmed, the pair could revisit the 2.03500 support area with bearish continuation pressure.
📌 Key Levels
Sell trigger: Rejection at 2.05836 and break of 2.05000
Sell zone: 2.05800–2.06000
Target: 2.03500
Invalidation: Strong break and close above 2.06000
💡 Risks
Bullish breakout above trendline resistance
Fundamental surprise (UK/AU economic data)
Shift in broader risk sentiment or AUD weakness
If this idea resonates with you or you have your own opinion, traders, hit the comments. I’m excited to read your thoughts!
Lingrid | DOGEUSDT Pullback and Continuation OpportunityBINANCE:DOGEUSDT is currently testing the intersection of its upward channel support and a critical horizontal zone near 0.21378, after a steep corrective decline from the 0.28628 resistance area. The recent price action formed a rounded pullback, suggesting potential accumulation near trendline confluence. A bullish bounce here could trigger a strong rally toward 0.26350 as shown by the projected upward path. Failure to hold the 0.21000 area would expose the pair to deeper downside toward the 0.15706 support.
📌 Key Levels
Buy zone: 0.21000–0.21700
Buy trigger: Break and close above 0.23000
Target: 0.26350
Invalidation: Break below 0.21000
⚠️ Risks
Breakdown of ascending trendline support
Weak volume on upward breakout
Broader market weakness impacting altcoins
If this idea resonates with you or you have your own opinion, traders, hit the comments. I’m excited to read your thoughts!

Gold Next Move Possible Hello Traders, Today I’m back with another idea.
As you know gold has changed the trend from bullish to the bearish.
The gold has fallen from the area 3438 to 3351. Now the current price is 3358.
I’m looking for the sell zone, In my view gold will drop till 3310.
I’m monitoring the sell zone 3364-3371, when the market touches the zone, I will add sell and my target will be 3310. Keep in bear my first target is 3351, second target is 3337 and the last target is 3310.
In the case if price breaks the 3377 area then we will have to wait until confirmation for another setup.
Stay Tune for every update.
Kindly share your ideas and leave positive comments. Thanks Everybody.

Lingrid | GOLD shorting Opportunity at Confluence ZoneThe price perfectly fulfilled my previous idea . OANDA:XAUUSD broke down sharply after forming a local top at the 3433 resistance zone, with clear bearish momentum dominating recent candles. Price is now consolidating below the broken trendline and previous structure at 3349, setting up for a possible retest and rejection. If price confirms rejection under this resistance, continuation toward the 3288 support area becomes highly likely. A lower high formation below the blue upward trendline would validate the bearish thesis.
📉 Key Levels
Sell trigger: Rejection near 3349–3350
Sell zone: 3345–3355
Target: 3288
Invalidation: Break above 3355 and trendline recovery
💡 Risks
Sudden bullish breakout could reclaim upward trendline
Support near 3288 may create a rebound
Thin liquidity could exaggerate short-term wicks
If this idea resonates with you or you have your own opinion, traders, hit the comments. I’m excited to read your thoughts!
Lingrid | SUIUSDT Approaching Key Level for Potential LongBINANCE:SUIUSDT has pulled back from the 4.44 resistance but remains within a well-defined upward channel, holding above the 3.60 support zone. The structure shows higher lows with price hovering around the blue upward trendline, indicating ongoing bullish momentum. As long as 3.60 holds, buyers may regain control and push price back toward the 4.44 resistance and beyond. Momentum favors continuation as the consolidation phase near support suggests accumulation.
📉 Key Levels
Buy trigger: Break and close above 3.85
Buy zone: 3.60–3.70
Target: 4.44
Invalidation: Drop below 3.26
💡 Risks
Failure to hold above 3.26 could trigger deeper pullback.
Resistance near 4.44 may cause rejection.
Low market volume could delay breakout attempts.
If this idea resonates with you or you have your own opinion, traders, hit the comments. I’m excited to read your thoughts!
Lingrid | HYPEUSDT Potential Continuation After PullbackKUCOIN:HYPEUSDT is bouncing from a higher low near the 42.070 zone after breaking a descending flag pattern. Price action remains above the ascending support trendline while pressing into a key structure retest. As long as GETTEX:HYPE stays above 42, a bullish leg toward the 49.700 resistance remains likely. Structure suggests a resumption of the impulse phase within the broader uptrend.
📉 Key Levels
Buy trigger: Clean breakout above 45.00
Buy zone: 41.5 – 43.0 (support + flag bottom)
Target: 49.700
Invalidation: Close below 40.00
💡 Risks
Breakdown below the ascending support would weaken the bullish setup
Failure to reclaim mid-flag resistance may lead to deeper consolidation
Broader market weakness in altcoins could delay breakout momentum
If this idea resonates with you or you have your own opinion, traders, hit the comments. I’m excited to read your thoughts!

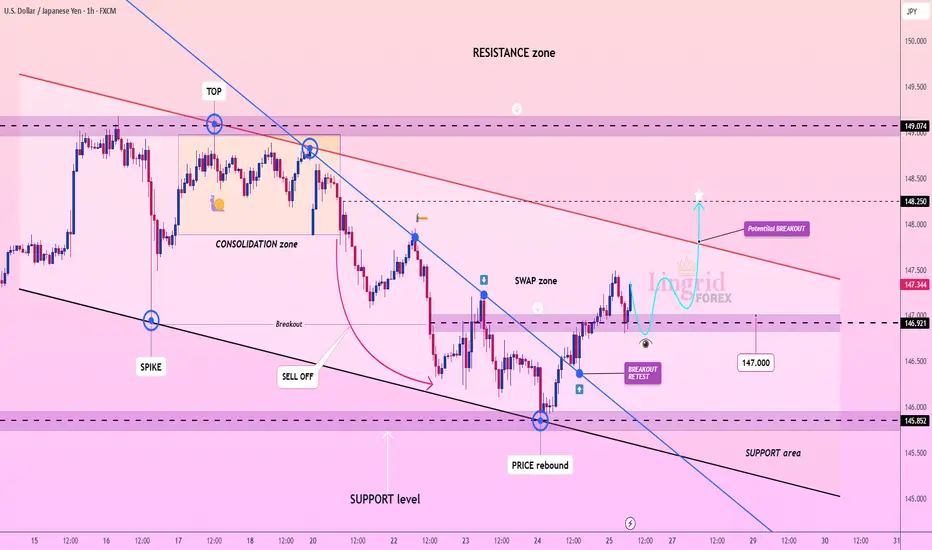
Lingrid | USDJPY Potential Channel Breakout. LongFX:USDJPY is retesting the breakout zone after reclaiming support from a prior swap area near 146.9. Price action has broken above a downward trendline and is forming a bullish retest structure. As long as USDJPY holds above 146.920 zone, the setup favors a continuation toward the resistance barrier. A breakout above the red descending trendline could accelerate upside momentum.
📉 Key Levels
Buy trigger: Break and hold above 147.500
Buy zone: 146.900 – 147.000
Target: 148.250
Invalidation: Break below 146.000
💡 Risks
Failure to break the descending red trendline may trigger renewed selling
Consolidation below resistance could signal buyer exhaustion
Break below 146.000 would invalidate bullish retest setup
If this idea resonates with you or you have your own opinion, traders, hit the comments. I’m excited to read your thoughts!
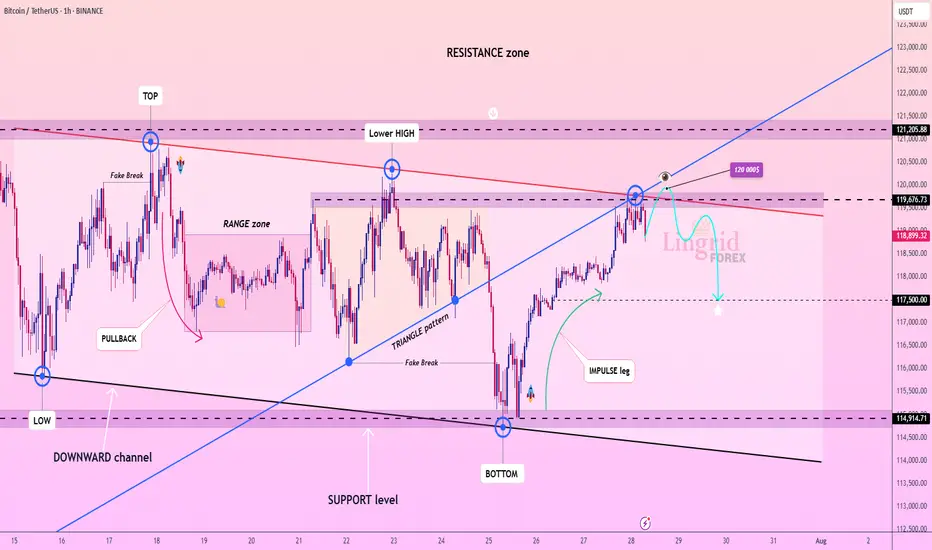
Lingrid | BTCUSDT Range-Bound Market: Short-Term Bearish MoveBINANCE:BTCUSDT has failed to break through the descending resistance near 120,000 and is now forming a lower high within the broader resistance zone. The price action follows an impulsive leg up and is currently tracing a potential reversal pattern under key structural resistance. As long as the market remains capped below 120,000, continuation toward 117,500 is likely. The downward bias is supported by weakening momentum after the bull trap and resistance rejection.
📉 Key Levels
Sell trigger: Breakdown below 119,000
Sell zone: 119,400 – 120,000
Target: 117,500
Invalidation: Break and close above 120,500
💡 Risks
Sudden bounce from the 119,000 handle could trap late sellers
Breakout above 120,000 would shift structure to bullish
Support near 117,500 may slow or reverse bearish pressure
If this idea resonates with you or you have your own opinion, traders, hit the comments. I’m excited to read your thoughts!
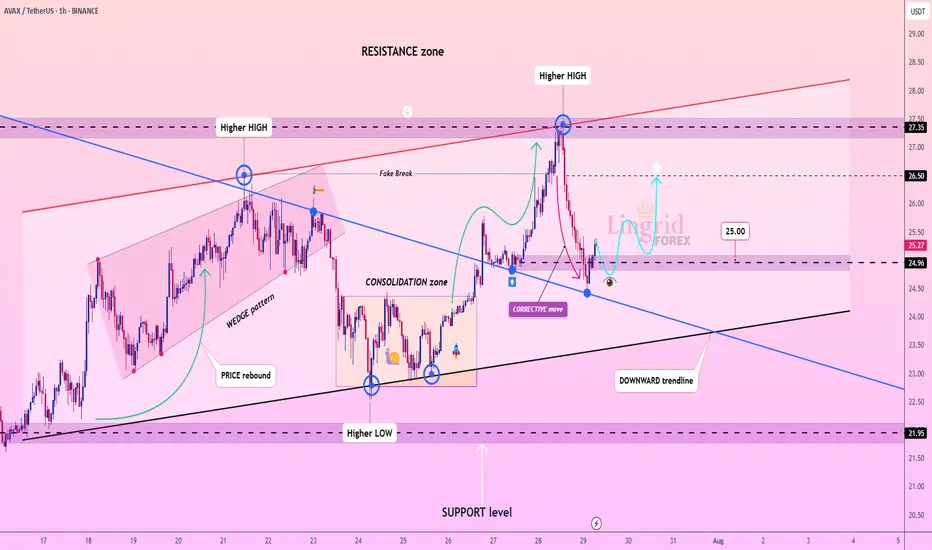
Lingrid | AVAXUSDT Corrective Move In The MarketThe price perfectly fulfilled my previous idea . BINANCE:AVAXUSDT retraced sharply from the 27.34 resistance zone after making a higher high but found support above the descending trendline. The recent corrective move has paused at a key structure level near 24.96, hinting at potential bullish continuation. A breakout above this local resistance could trigger a rally toward the 26.50–27.34 target zone. Momentum builds as long as price remains above the trendline and higher low structure.
📈 Key Levels
Buy zone: 24.80 – 25.30
Buy trigger: Break and hold above 25.30
Target: 26.50
Invalidation: Close below 24.00
💡 Risks
Downward trendline still active and could act as resistance
Potential for bearish fakeout before breakout
Failure to reclaim 25.30 quickly weakens bullish scenario
If this idea resonates with you or you have your own opinion, traders, hit the comments. I’m excited to read your thoughts!
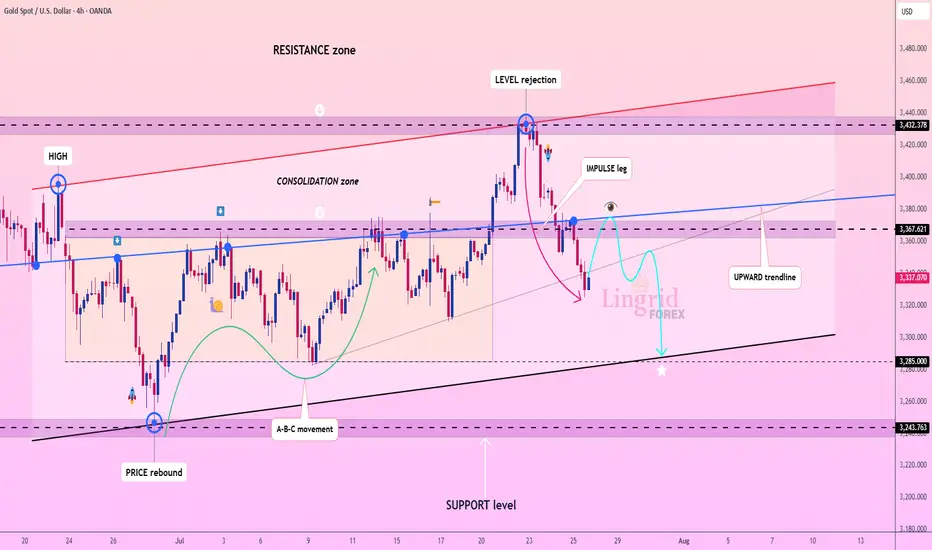
Lingrid | GOLD Weekly Market Outlook: Resistance Zone RejectionOANDA:XAUUSD markets have encountered significant resistance at the $3,450 level, resulting in a notable rejection and subsequent pullback toward support zones. The precious metal is now testing critical technical levels that will determine whether the broader bullish momentum can be sustained or if deeper correction is imminent.
The 4H chart reveals a clear level rejection at the resistance zone, followed by an impulse leg lower that has broken the upward trendline. This development suggests a potential shift in short-term momentum, with gold now trading within the consolidation zone between $3,365 and $3,285. The break of the ascending trendline is particularly significant, indicating that bulls may be losing control of the immediate price action.
The second chart provides valuable context with the weekly and 16-hour timeframe analysis. The pinbar rejection candle on the weekly chart confirms strong selling pressure at these elevated levels. The 16-hour chart shows multiple tests of the upward trendline, with the recent break potentially signaling a bearish impulse leg. However, the overall structure remains within the broader ascending channel, suggesting this could be a healthy correction within the long-term uptrend.
Critical levels to monitor include the $3,285 support zone and the broken trendline at $3,365. A decisive break below $3,285 could trigger a deeper correction toward $3,200, while reclaiming the upward trendline would restore bullish momentum toward new highs.
If this idea resonates with you or you have your own opinion, traders, hit the comments. I’m excited to read your thoughts!
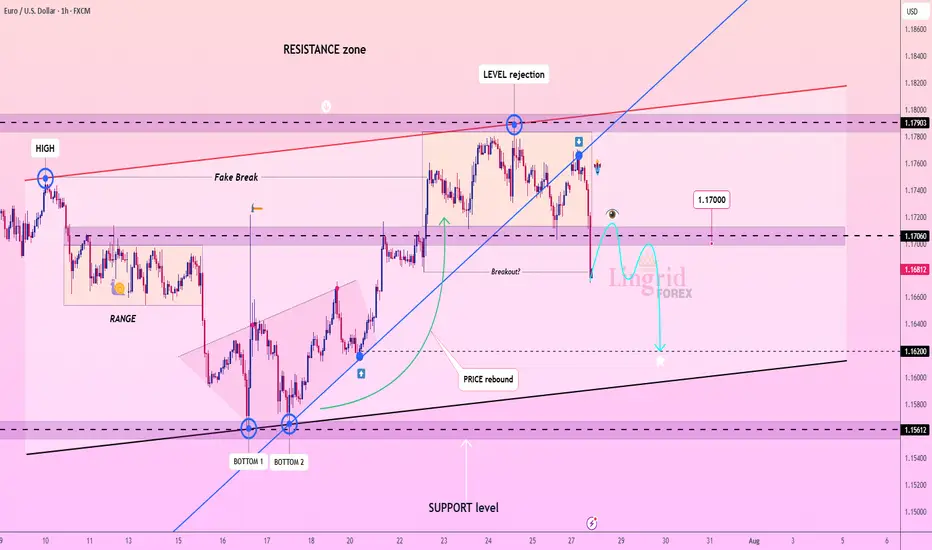
Lingrid | EURUSD Drops from 1.18000 RESISTANCE. Possible ShortFX:EURUSD is showing strong rejection at the resistance zone near 1.1790 after multiple fake breaks and failed attempts to sustain above the key level. Price has now broken below the mid-range and is forming a bearish rejection pattern right at the edge of the breakout area. With bearish momentum accelerating and a move toward 1.1620 support appears likely. Breakdown from the consolidation channel favors trend continuation to the downside.
📉 Key Levels
Sell trigger: Breakdown below 1.1660
Sell zone: 1.1700 – 1.1730
Target: 1.1620
Invalidation: Break above 1.1750
💡 Risks
Sudden bullish engulfing near 1.1670 could negate the breakdown
Support at 1.1620 may trigger a bounce
US macro data could shift trend dynamics mid-move
If this idea resonates with you or you have your own opinion, traders, hit the comments. I’m excited to read your thoughts!
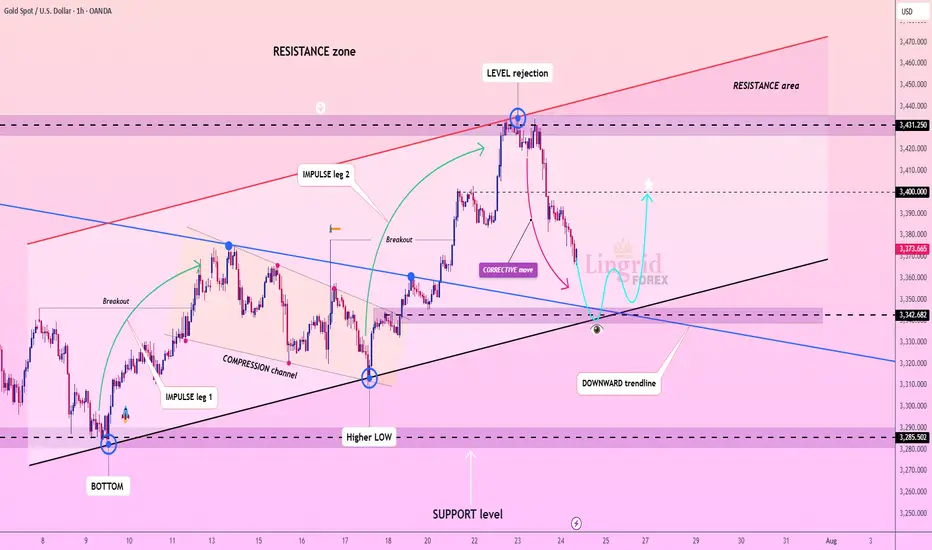
Lingrid | GOLD Corrective Move: Potential Long Trade OpportunityThe price perfectly fulfilled my last idea . OANDA:XAUUSD is pulling back sharply after facing rejection from the key resistance level at 3431, following a two-leg impulse wave. The structure shows a correction within an active uptrend, nearing confluence support from the upward trendline and horizontal level. As long as price holds above 3342, a bounce and continuation toward 3400 remain the favored scenario. Broader bullish structure and momentum buildup point to a possible resumption after the current retracement.
📉 Key Levels
Buy trigger: Break above 3350
Buy zone: 3345 – 3340
Target: 3400
Invalidation: Break below 3320
💡 Risks
Failure to hold the upward trendline could shift momentum
Weak bounce may trap buyers before real breakout
Resistance at 3400 could remain firm without stronger volume support
If this idea resonates with you or you have your own opinion, traders, hit the comments. I’m excited to read your thoughts!
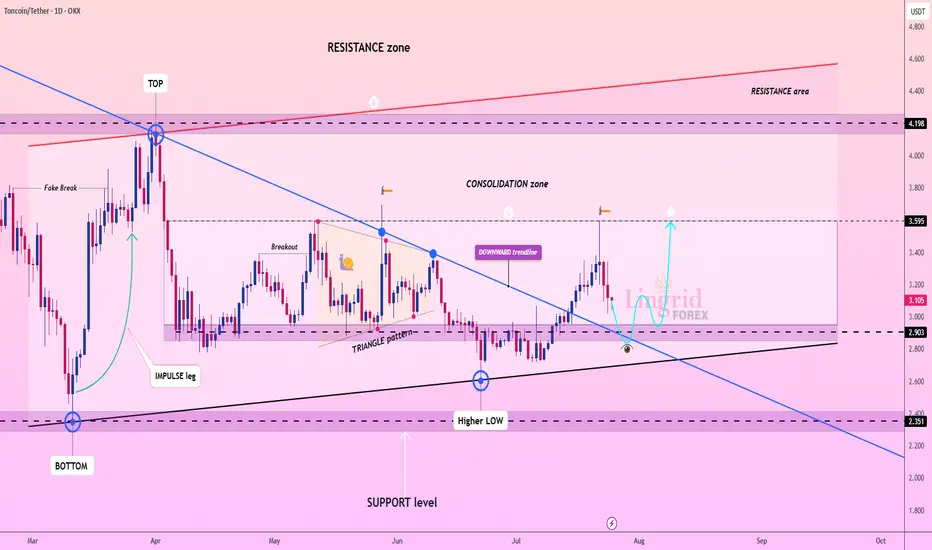
Lingrid | TONUSDT Potential Rebound from Support ZoneThe price perfectly fulfilled my last idea . OKX:TONUSDT is testing support after pulling back from the consolidation zone and forming a higher low above key structure. The chart shows a breakout from the downward trendline followed by a corrective retracement back toward confluence support. As long as price stays above 2.903, a bounce and renewed move toward 3.595 remains the base case. Structure favors bullish continuation after the retest of the breakout level.
📉 Key Levels
Buy trigger: Break and hold above 3.200
Buy zone: 2.903 – 3.050
Target: 3.595
Invalidation: Break below 2.903
💡 Risks
Failure to hold confluence of upward trendline and horizontal support
Weak follow-through above 3.2 could indicate distribution
Resistance at 3.595 may trigger renewed selling before breakout
If this idea resonates with you or you have your own opinion, traders, hit the comments. I’m excited to read your thoughts!
Lingrid | AUDCAD Short Following Resistance Fake Breakout The price perfectly fulfilled my last idea . FX:AUDCAD is rejecting from the top of the resistance zone after a strong bullish impulse and has started forming a rounded top pattern. Price remains inside an upward channel but is showing signs of exhaustion with the blue arrow projecting a pullback. As long as the price stays below 0.9008, we expect a descent toward the 0.8962 region. Momentum is cooling, and a bearish correction is likely before any bullish attempt resumes.
📉 Key Levels
Sell trigger: Break below 0.8990
Sell zone: 0.8995 – 0.9012
Target: 0.8962
Invalidation: Break and close above 0.9025
💡 Risks
Strong bullish momentum may resume if support holds
Failure to break 0.8990 could trap early sellers
Macro data from AUD/CAD region may disrupt the structure
If this idea resonates with you or you have your own opinion, traders, hit the comments. I’m excited to read your thoughts!
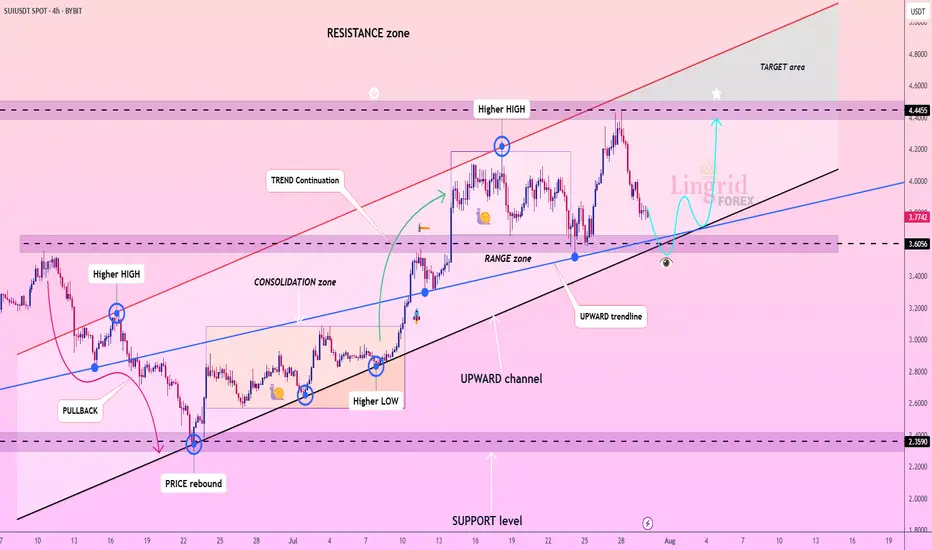
Lingrid | SUIUSDT Buying Opportunity from Support ZoneBYBIT:SUIUSDT is pulling back from the recent range top after testing the resistance zone and is approaching the key breakout area. The structure shows an upward channel with a prior consolidation breakout and an ongoing corrective retracement. As long as the price holds above the confluence zone near 3.35, the bullish structure remains intact. Broader momentum supports trend continuation toward the upper resistance boundary and the target area.
📉 Key Levels
Buy trigger: Break above 3.75 with volume
Buy zone: 3.25 – 3.35
Target: 4.24
Invalidation: Break below 3.22
💡 Risks
Breakdown below channel support would flip structure bearish
Fading volume on bounce may signal exhaustion
Broader market weakness could suppress upside momentum
If this idea resonates with you or you have your own opinion, traders, hit the comments. I’m excited to read your thoughts!

EURUSD LONG AND EDUCATIONAL BREAKDOWN ECB INTRESTRATE RELEASE The European Central Bank is expected to hold key rates for the first time in over a year on Thursday.
The Eurozone inflation rate has hit the ECB’s 2% target as the US-EU trade deal uncertainty lingers.
The EUR/USD pair could experience intense volatility following the ECB policy announcements.
The European Central Bank (ECB) is on track to leave its key interest rates unchanged after its July policy meeting, after having reduced rates at each of its last seven meetings. The decision will be announced on Thursday at 12:15 GMT.
The interest rate decision will be followed by ECB President Christine Lagarde’s press conference at 12:45 GMT.
