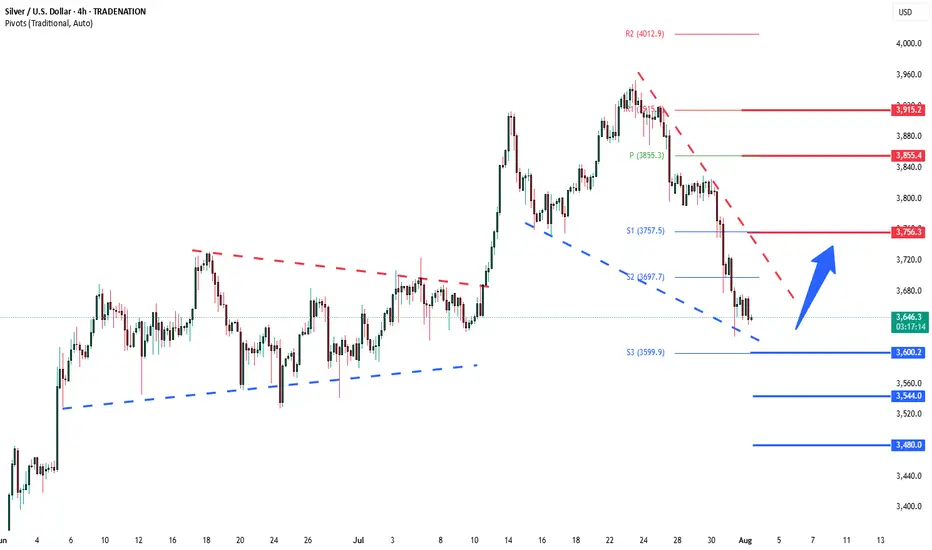
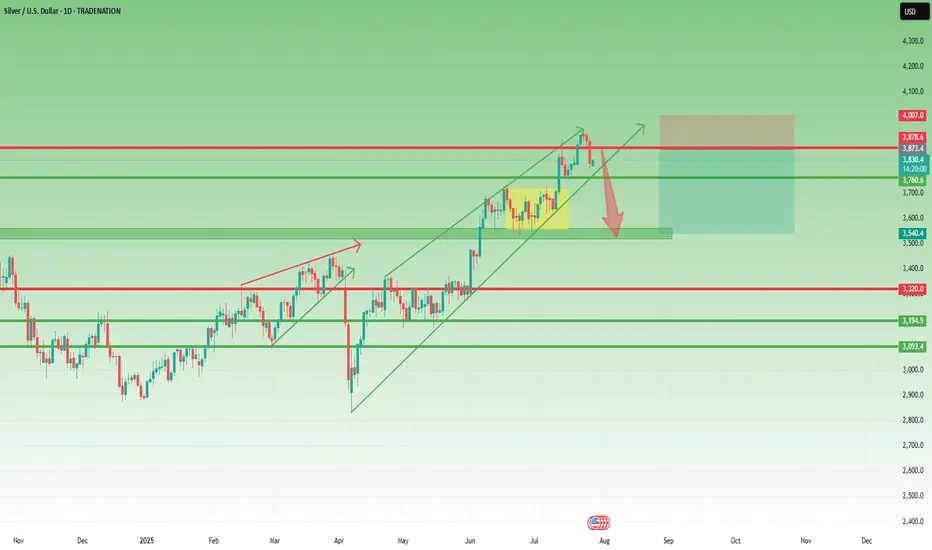
Silver coiling price action support at 3600The Silver remains in a bullish trend, with recent price action showing signs of a continuation breakout within the broader uptrend.
Support Zone: 3600 – a key level from the previous consolidation. Price is currently testing or approaching this level.
A bullish rebound from 3600 would confirm ongoing upside momentum, with potential targets at:
3756 – initial resistance
3855 – psychological and structural level
3915 – extended resistance on the longer-term chart
Bearish Scenario:
A confirmed break and daily close below 3600 would weaken the bullish outlook and suggest deeper downside risk toward:
3544 – minor support
3480 – stronger support and potential demand zone
Outlook:
Bullish bias remains intact while the Silver holds above 3600. A sustained break below this level could shift momentum to the downside in the short term.
This communication is for informational purposes only and should not be viewed as any form of recommendation as to a particular course of action or as investment advice. It is not intended as an offer or solicitation for the purchase or sale of any financial instrument or as an official confirmation of any transaction. Opinions, estimates and assumptions expressed herein are made as of the date of this communication and are subject to change without notice. This communication has been prepared based upon information, including market prices, data and other information, believed to be reliable; however, Trade Nation does not warrant its completeness or accuracy. All market prices and market data contained in or attached to this communication are indicative and subject to change without notice.
Silver
SILVER: Local Bullish Bias! Long!
My dear friends,
Today we will analyse SILVER together☺️
The recent price action suggests a shift in mid-term momentum. A break above the current local range around 36.920 will confirm the new direction upwards with the target being the next key level of 37.150 and a reconvened placement of a stop-loss beyond the range.
❤️Sending you lots of Love and Hugs❤️

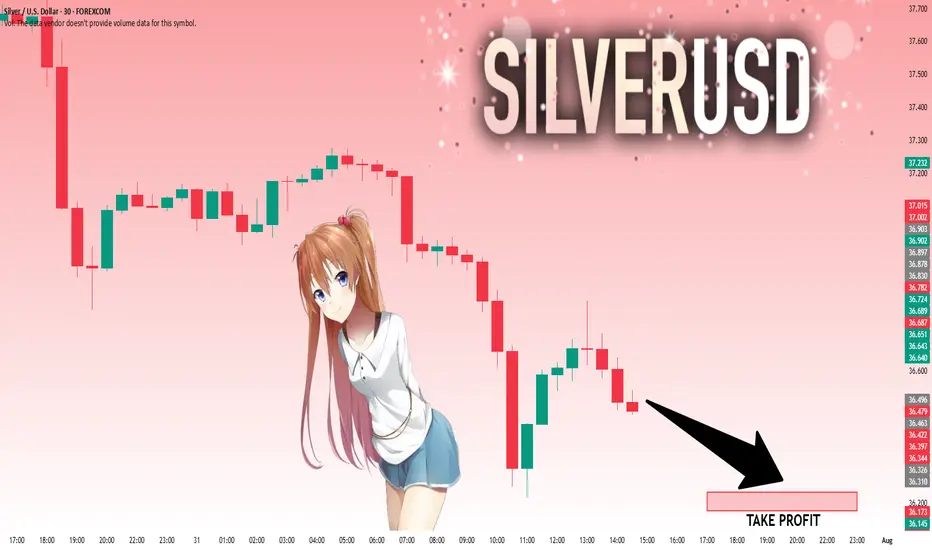
SILVER: Will Go Down! Short!
My dear friends,
Today we will analyse SILVER together☺️
The market is at an inflection zone and price has now reached an area around 36.490 where previous reversals or breakouts have occurred.And a price reaction that we are seeing on multiple timeframes here could signal the next move down so we can enter on confirmation, and target the next key level of 36.231..Stop-loss is recommended beyond the inflection zone.
❤️Sending you lots of Love and Hugs❤️
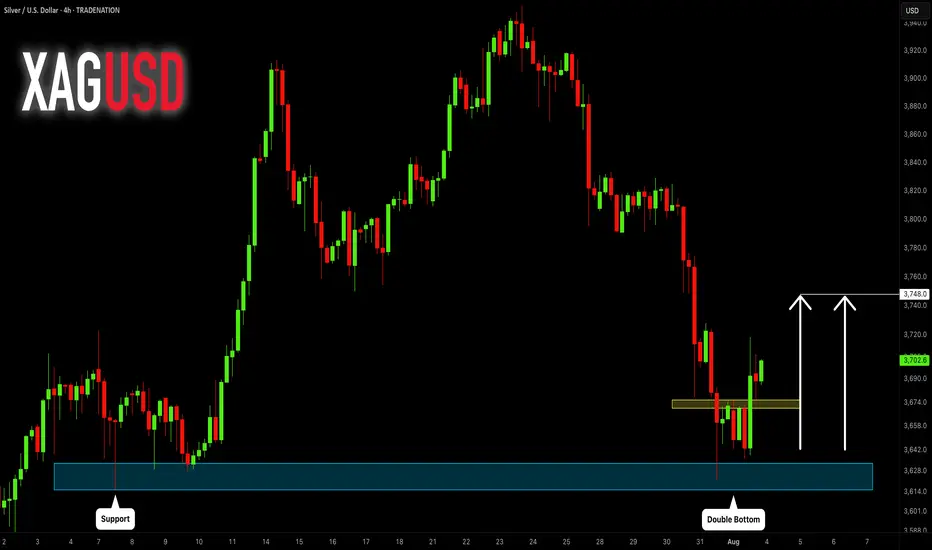
SILVER (XAGUSD): More Growth Ahead
It looks like Silver is going to continue growing next week,
following a strong bullish reaction to a key daily horizontal support.
The next strong resistance is 3748.
It will be the next goal for the buyers.
❤️Please, support my work with like, thank you!❤️
I am part of Trade Nation's Influencer program and receive a monthly fee for using their TradingView charts in my analysis.
SILVER WILL FALL|SHORT|
✅SILVER is going up now
But a strong resistance level is ahead at 37,60$
Thus I am expecting a pullback
And a move down towards the target of 36,69$
SHORT🔥
✅Like and subscribe to never miss a new idea!✅
Disclosure: I am part of Trade Nation's Influencer program and receive a monthly fee for using their TradingView charts in my analysis.
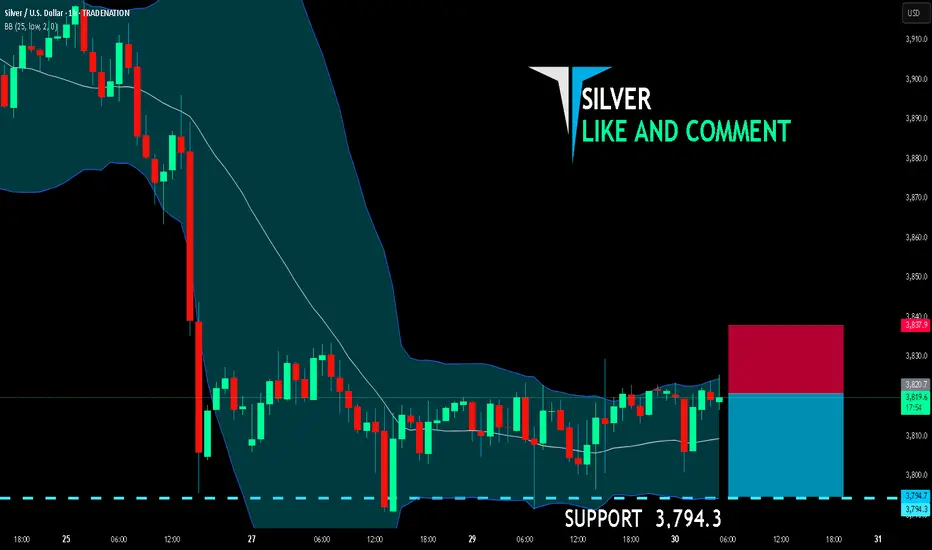
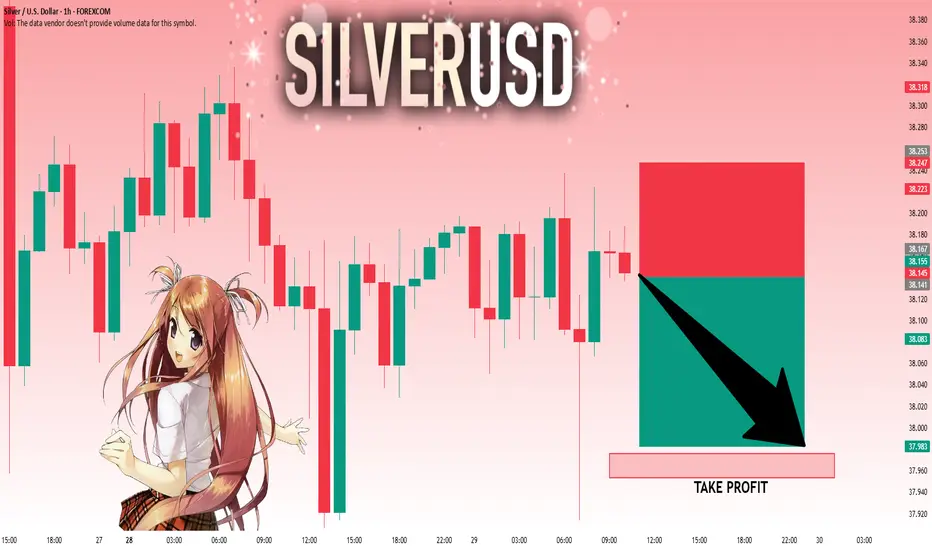
SILVER SENDS CLEAR BEARISH SIGNALS|SHORT
SILVER SIGNAL
Trade Direction: short
Entry Level: 3,820.7
Target Level: 3,794.3
Stop Loss: 3,837.9
RISK PROFILE
Risk level: medium
Suggested risk: 1%
Timeframe: 1h
Disclosure: I am part of Trade Nation's Influencer program and receive a monthly fee for using their TradingView charts in my analysis.
✅LIKE AND COMMENT MY IDEAS✅
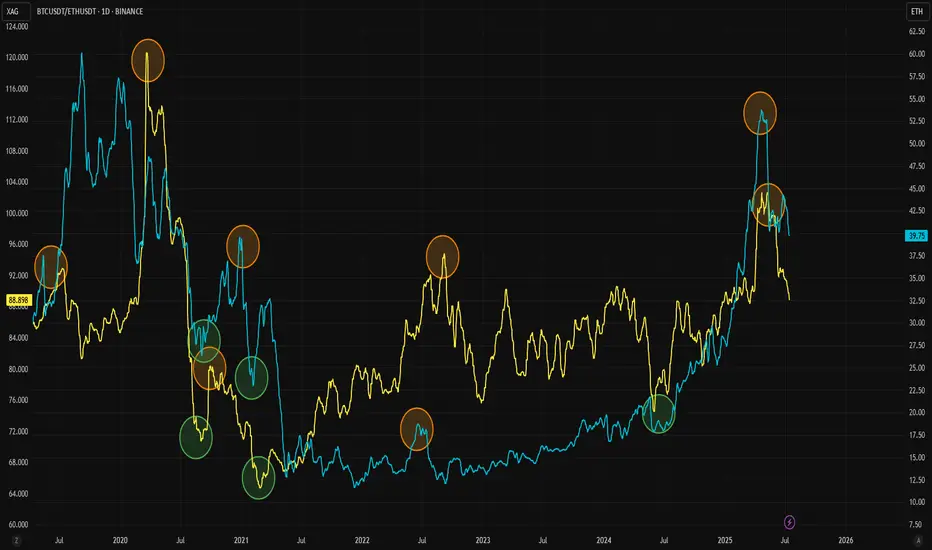
Want to Know What Happens in Crypto? Check Silver InsteadThe Gold/Silver ratio is one of the key indicators that highlights major turning points in modern economic history. Similarly, the ETH/BTC ratio is widely followed as a gauge of strength in the crypto market and the beginning of altcoin seasons. Interestingly, these two ratios also appear to correlate well with each other.
As adoption of both Ethereum and Bitcoin has grown, the Gold/Silver and BTC/ETH ratios have started to move more closely together. They often follow similar patterns, with tops and bottoms forming one after the other. For clarity, this analysis uses the BTC/ETH ratio rather than ETH/BTC.
Historically, BTC/ETH tends to lead during market tops, followed by a similar move in the Gold/Silver ratio. This pattern has been observed repeatedly since 2020. When it comes to bottoms, the timing between the two ratios is usually tighter, as seen during the 2020, 2021, and 2024 lows.
The latest signal came from a top in the BTC/ETH ratio, and the Gold/Silver ratio now appears to be following that move. Given the cyclical nature of crypto markets, both ETH and silver could be at the early stages of new upward trends. For a potential trend reversal, it may be wise to keep a closer eye on silver in the coming weeks.
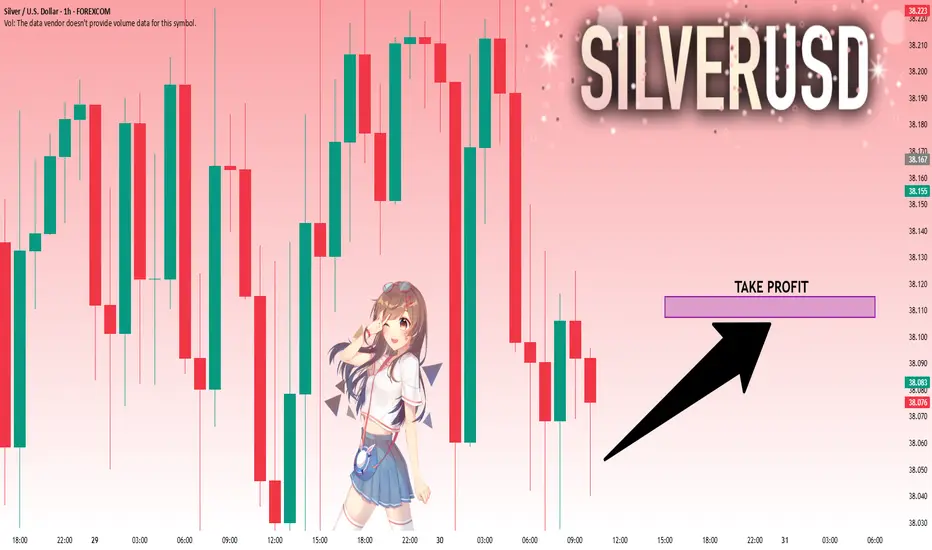
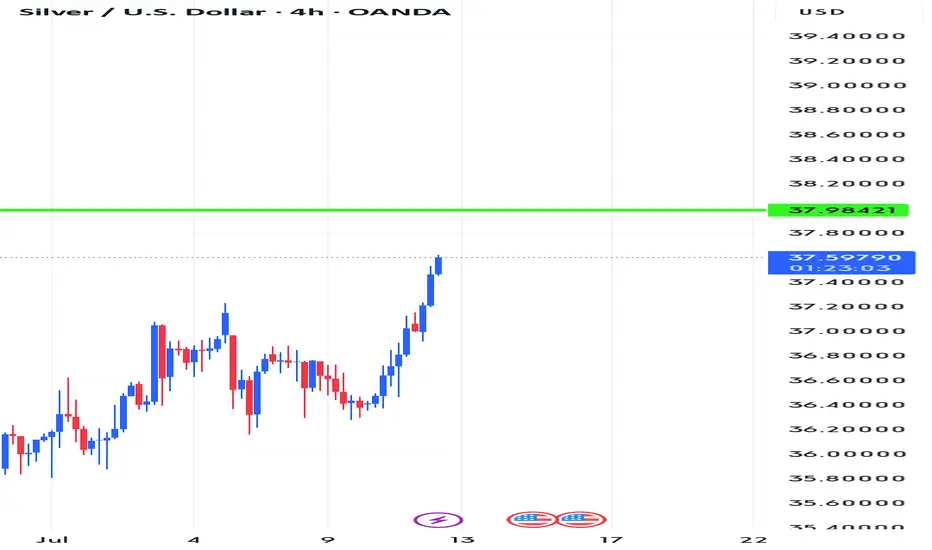
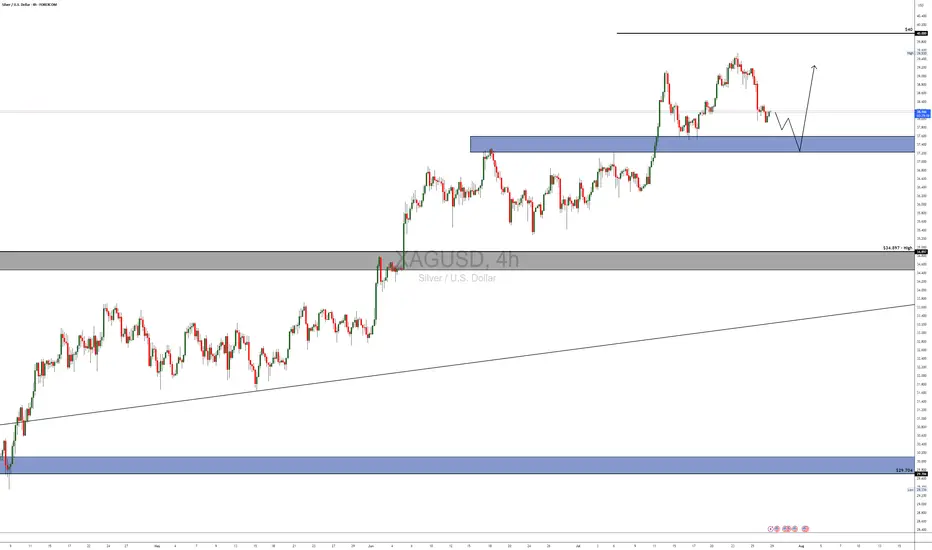
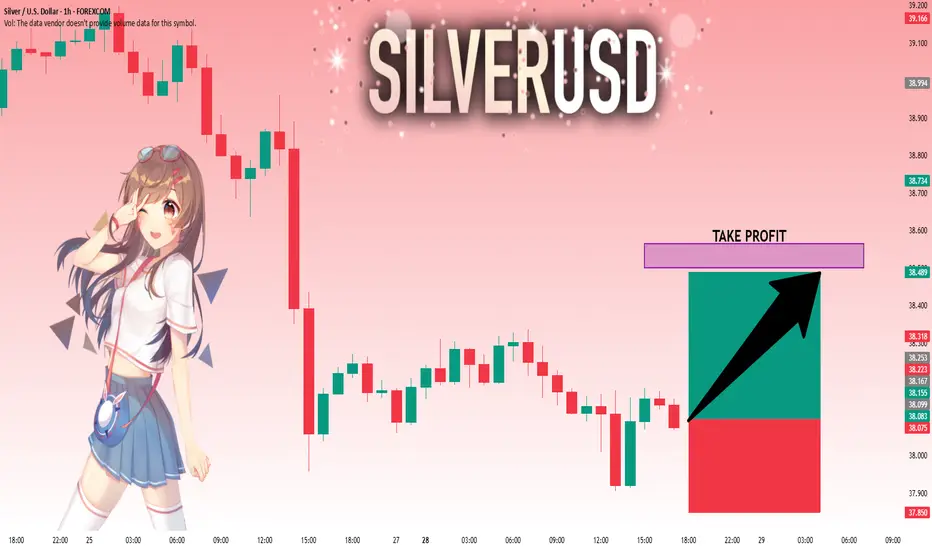
SILVER: Move Up Expected! Long!
My dear friends,
Today we will analyse SILVER together☺️
The recent price action suggests a shift in mid-term momentum. A break above the current local range around 38.054 will confirm the new direction upwards with the target being the next key level of 38.107 and a reconvened placement of a stop-loss beyond the range.
❤️Sending you lots of Love and Hugs❤️
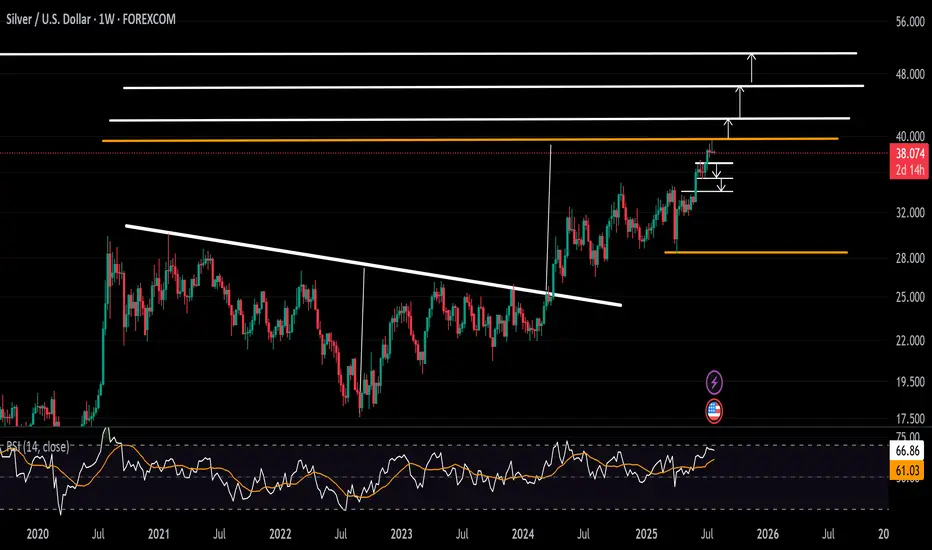
Silver Signals Pullback Risks From $40 BarrierFrom a fundamental standpoint, the strength seen in both tech and silver markets in 2025 may be supported by the structural integration of AI and innovation into global economic agendas. As AI and technology increasingly become the backbone of global infrastructure and development, demand is likely to remain strong.
Silver is currently retreating from the $40 psychological zone, the 39.50 high, which aligns with the target of an inverted head and shoulders pattern formed between August 2020 and March 2024.
• Pullback Scenario: In line with weekly overbought momentum as per the RSI indicator, a retracement may target support levels at $37, $36.20, and $35.20 before resuming its broader bullish trend.
• Breakout Scenario: A confirmed close above $40 may open the door to $42, $46, and potentially a move beyond $50.
Written by Razan Hilal, CMT
XAGUSD – Reversal Signs After the Run Toward $40Lately, I’ve been a strong advocate for a Silver rally toward $40, and indeed, we got a solid move, with price reaching as high as $39.50, not touching 40 though...
Just like with Gold, the last 3 days of last week turned bearish, and now it looks like we may be entering the early stage of a correction.
📉 Current Setup:
- The rejection from $39.50, right below the psychological $40 level, is significant
- I’ll be monitoring for a possible short entry if we get a rebound into the $38.80–$39.00 zone
- A new high above $39.50 would invalidate this setup
📌 On the downside, if price breaks below the confluence support at $37.70–$38.00, that would confirm the reversal and could lead to an acceleration toward $35.50 support
Conclusion:
The bullish narrative on Silver is pausing here. Until a new high is made, I’m looking to sell the bounce and follow the momentum if the breakdown under support is confirmed.
Let’s see how this plays out this week. 🧭
Disclosure: I am part of TradeNation's Influencer program and receive a monthly fee for using their TradingView charts in my analyses and educational articles.
Do you agree with me for XAGUSD?
Hi my friends
Do you think silver is still bullish?
I think it is bullish for now. Shall we go buy together?
#XAGUSD: A Strong Bullish Move, Possible Target at $45?Silver is currently experiencing a correction, but the overall price remains bullish. Analysing the data, we can see a potential price reversal in our area of interest. Following the recent higher high, price is poised to create another record high. We should closely monitor volume and price behaviour. A strong volume signal would indicate a potential bullish move in the future.
Good luck and trade safely.
Like and comment for more!
Team Setupsfx_
SILVER: The Market Is Looking Down! Short!
My dear friends,
Today we will analyse SILVER together☺️
The recent price action suggests a shift in mid-term momentum. A break below the current local range around 38.167 will confirm the new direction downwards with the target being the next key level of 37.976 .and a reconvened placement of a stop-loss beyond the range.
❤️Sending you lots of Love and Hugs❤️
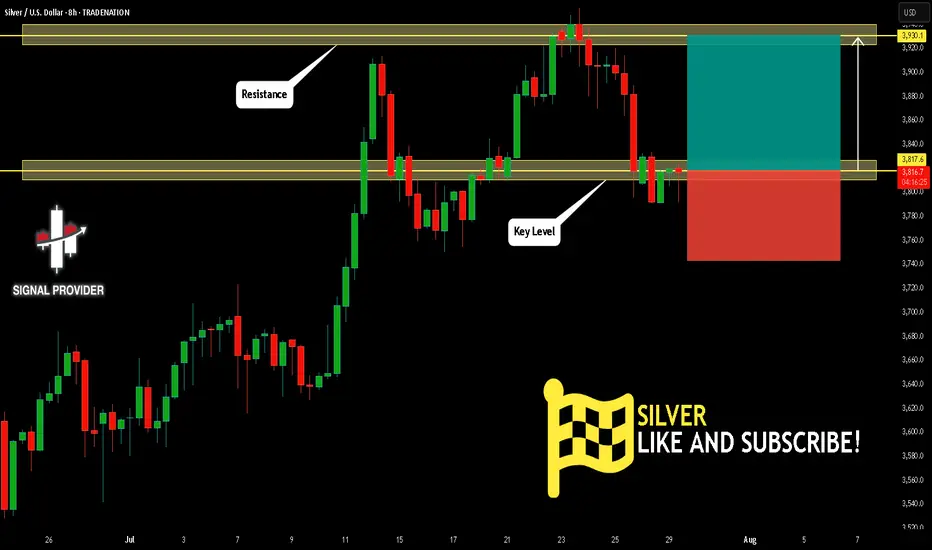
SILVER Will Grow! Buy!
Please, check our technical outlook for SILVER.
Time Frame: 8h
Current Trend: Bullish
Sentiment: Oversold (based on 7-period RSI)
Forecast: Bullish
The market is approaching a significant support area 3,817.6.
The underlined horizontal cluster clearly indicates a highly probable bullish movement with target 3,930.1 level.
P.S
The term oversold refers to a condition where an asset has traded lower in price and has the potential for a price bounce.
Overbought refers to market scenarios where the instrument is traded considerably higher than its fair value. Overvaluation is caused by market sentiments when there is positive news.
Disclosure: I am part of Trade Nation's Influencer program and receive a monthly fee for using their TradingView charts in my analysis.
Like and subscribe and comment my ideas if you enjoy them!
Silver Near $40: Deficits and Demand Fuel the RallySilver prices surged to multi-year highs in July 2025, driven by an extraordinary convergence of bullish factors, pushing prices above $39 per ounce, levels last seen in 2011.
Silver’s rally, supported by robust industrial demand and safe-haven inflows, aligns with traditional patterns as the U.S. dollar has weakened over 2.3% over the recent period.
Macroeconomic Drivers and the U.S. Dollar
Silver's rally is unfolding around shifting macro conditions. The Federal Reserve has kept interest rates at a restrictive 4.25-4.50% throughout 2025 due to persistently high inflation (2.7% YoY). However, expectations for more rate cuts are growing, with the CME FedWatch tool showing a 59.8% probability of a cut at the September meeting as of July 28.
Adding to the complexity, U.S. trade policies have triggered significant market volatility and raised concerns over a potential supply shock. The U.S. administration has imposed steep 30% tariffs on imports from Mexico, set to resume on August 1. This has heightened fears, as Mexico is the world’s largest silver producer and supplies over half of U.S. silver imports.
But macro drivers aren’t the full story. The real force behind silver’s rally lies in the physical market itself. A structural supply deficit, escalating industrial demand, and growing investor appetite from Asia and North America, are proving to be far more pivotal than shifting rates or a softer dollar.
Physical Market Dislocation and Industrial Demand
The year 2025 marks the fifth consecutive year of a structural deficit in the global silver market, and the imbalance between supply and demand shows no sign of easing.
With minimal new mining capacity expected to come online and lengthy lead times for project development, supply constraints are structural rather than temporary.
Since 2021, the cumulative shortfall has reached nearly 800 million ounces (25,000 tons), steadily drawing down available inventories and tightening the market.
Industrial demand remains the central pillar of silver’s bull market. Forecasts for 2025 project record consumption of roughly 700 million ounces, driven by rapid adoption in green technologies and digital infrastructure. The electrical and electronics sector, which includes solar photovoltaics (PV), consumer electronics, automotive electronics, power grids, and 5G networks, has increased its silver usage by 51% since 2016.
Solar PV alone consumed approximately 197.6 million ounces in 2024, a record largely driven by China’s 45% expansion in solar capacity. With global EV production expected to approach 20 million units in 2025, automotive silver demand alone could exceed 90 million ounces.
Together, persistent deficits, accelerating industrial consumption, and capital flowing into physically backed investment vehicles are creating a market where available silver is increasingly scarce, amplifying upside pressure on prices regardless of short-term macroeconomic shifts.
COMEX silver inventories peaked at 504.72 million ounces on May 11 but have since eased back to levels last seen on April 24, indicating a recovery in demand following the large accumulation in US inventories post-tariff shock.
Positioning and Ratios Favour Gains
With net inflows of 95 million ounces in the first half of 2025, silver ETP investment has already surpassed the total for all of last year. By June 30, global silver ETP holdings reached 1.13 billion ounces, just 7% below their highest level since the peak of 1.21 billion ounces in February 2021
Futures positioning has also surged , with long positions up 163% over six months. These factors have helped propel silver prices over 35% higher year-to-date, building on a 21% gain in 2024.
The iShares SLV ETF netted inflows of $1,467.5 million over the past 3 months.
Physical silver investment demand remains robust, with significant buying from Asian markets. India, the world’s leading silver importer, saw record purchases of physical bullion and silver-backed ETFs during the first six months of 2025.
The gold-to-silver ratio, currently in the late 80s, remains historically elevated, suggesting silver remains significantly undervalued compared to gold. This indicates substantial upside potential for silver, especially given persistent market deficits, rising industrial and investment demand, and gold rising at the same time.
Hypothetical Trade Set-up
The silver market’s bullish fundamentals appear increasingly robust. Investors may consider accumulating silver positions, viewing short-term consolidations as attractive buying opportunities amid the compelling long-term outlook.
Options open interest for the September contract shows a bullish bias with a put/call ratio of 0.82 and high call interest at the far out-of-the-money call strike of $45 per ounce.
To express a bullish view on silver, investors can deploy a long position in CME Silver futures expiring in September. A hypothetical trade setup for this view is described below.
● Entry: $38.00 per ounce
● Target 1: $40.00 per ounce
● Target 2 (extension): $42.00 per ounce (if Fed easing in September coincides with physical tightness)
● Stop Loss: $36.70 per ounce
● Profit at Target 1: $10,000
● Profit at Target 2: $20,000
● Loss at Stop: $6,500
● Reward-to-risk ratio: 1.54 (Target 1) and 3.08 (Target 2)
Alternatively, investors can exercise the same view using CME Micro Silver futures, which offer smaller notional positions and more flexibility. Each Micro contract is priced in USD per ounce and represents 1,000 ounces of silver, compared to 5,000 ounces for the standard contract.
MARKET DATA
CME Real-time Market Data helps identify trading set-ups and express market views better. If you have futures in your trading portfolio, you can check out on CME Group data plans available that suit your trading needs tradingview.com/cme .
DISCLAIMER
This case study is for educational purposes only and does not constitute investment recommendations or advice. Nor are they used to promote any specific products, or services.
Trading or investment ideas cited here are for illustration only, as an integral part of a case study to demonstrate the fundamental concepts in risk management or trading under the market scenarios being discussed. Please read the FULL DISCLAIMER the link to which is provided in our profile description.
BUY TRADE SETUP ON XAGUSDCheck this buy trade setup i got on SILVER.
Anticipate a retest of the demands zone at 37.45 zone and plan for a buy entry there.
A Swing Trade Plan.
SILVER: Strong Growth Ahead! Long!
My dear friends,
Today we will analyse SILVER together☺️
The in-trend continuation seems likely as the current long-term trend appears to be strong, and price is holding above a key level of 38.099 So a bullish continuation seems plausible, targeting the next high. We should enter on confirmation, and place a stop-loss beyond the recent swing level.
❤️Sending you lots of Love and Hugs❤️
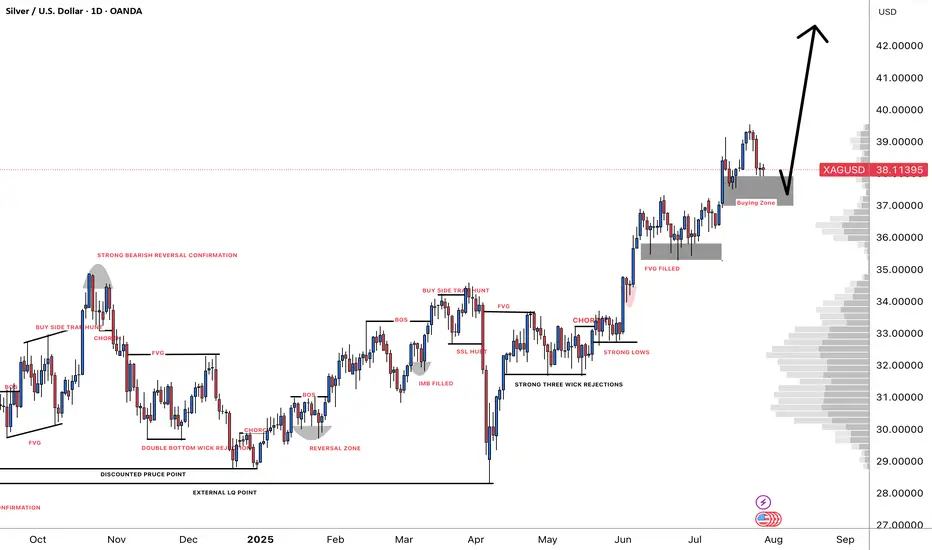
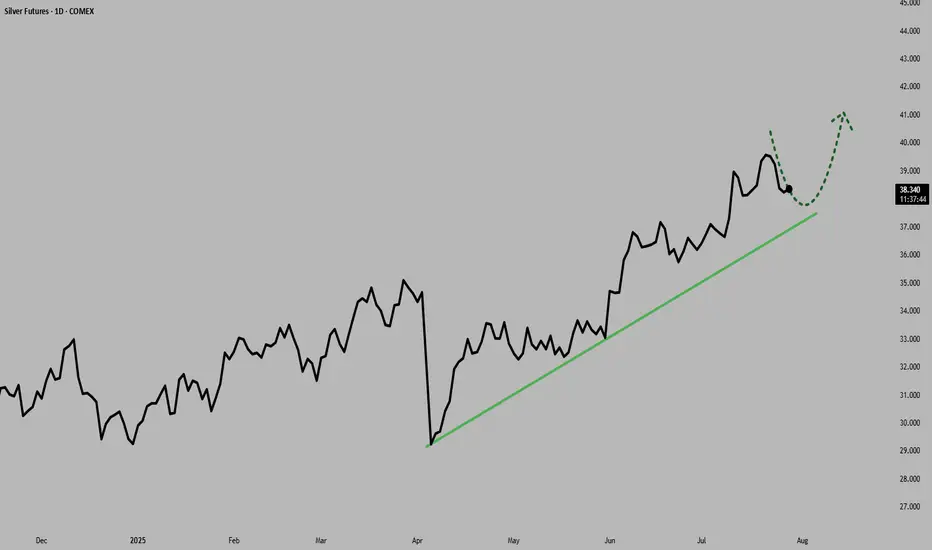
SI1!: Silver Demand Zone: Possible Bullish ContinuationI am currently observing a potential long-term continuation on SI1! Silver (XAG/USD), as the Commitment of Traders (COT) data indicates an increase in positions from both commercial and non-commercial traders. The price is approaching a demand zone on the daily chart, suggesting a possible bullish move.
The recent price action originated from an initial spike in the monthly supply zone, but there’s a possibility that the price could continue to rise further before reaching the next supply zone where a reversal might occur. Given the daily timeframe, I view this setup as suitable for a scalp trade. In my opinion, this presents an opportunity for short-term traders to capitalize on the potential upward movement.
✅ Please share your thoughts about SI1! in the comments section below and HIT LIKE if you appreciate my analysis. Don't forget to FOLLOW ME; you will help us a lot with this small contribution.

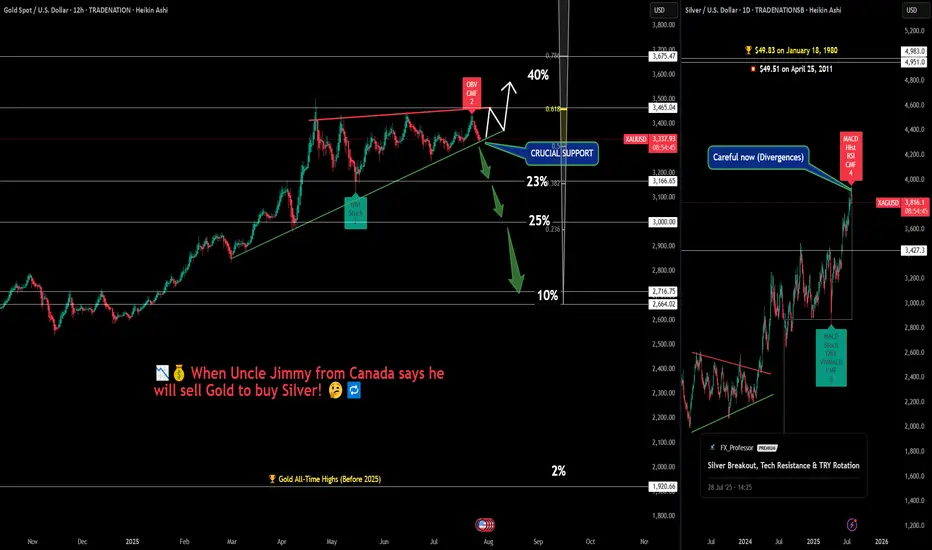
When Gold Believers Flip – Uncle Jimmy, Silver & New Safe Havens💰📉 When Gold Believers Flip – Uncle Jimmy, Silver, and the New Safe Havens 🧠🔄
Let me tell you a story that says more than any chart ever could.
📜 Meet Uncle Jimmy (from Canada) . He’s not really my uncle, but out of respect, that’s what I call him.
A true OG — early stockbroker, big mustache , 20+ apartments, a life built on commissions, charts, and one sacred truth: '' Gold never lies. ''
He's bought gold at every dip, every crisis, every whisper of war or inflation.
But now?
“I’m thinking of selling gold to buy silver.” ( WHAT?! 😳👀💥)
That’s it. That’s the moment.
📉 A gold maxi flipping into silver. A generational pivot.
And that’s the real divergence the chart doesn’t always show.
⚖️ Macro Sentiment Rotation:
📊 Gold
Sitting on crucial support. Breakout potential to $3,465+ remains — but divergences (OBV, CMF) are stacking. A breakdown? Targets stretch down to $3,000 or even $2,716.
🪙 Silver
Just hit $38.14 — now eyeing the legendary $49.83 ATH from 1980. Legacy capital rotating in. Silver’s moment? (My chart says 'wait a bit'...divergences!)
💻 NASDAQ/Tech
Some now call it the “new safe haven” — not because of bonds, but because of trust in corporate resilience vs. geopolitical chaos. When Nasdaq rises, silver often outperforms gold — risk appetite returns, and so does industrial metal demand.
₿ Bitcoin
And then there’s Bitcoin…
The safe haven that legacy minds still don’t trust.
I told Uncle Jimmy to buy it at:
→ $4,000
→ $18,000
→ $45,000
→ Even $70,000.... I stopped doing that at some point, he just wouldn't get it, or wouldn't make a move into the 'crypto unknown'. Respect!
So...He never did. Maybe Bitcoin just became what gold once was — but for the next generation. Not for Big Jimmy.
🧠 What to Watch:
Sentiment is shifting
Safe havens are evolving
Charts show structure — but stories show psychology
Whether you're long metals, crypto, or tech — the key is knowing when beliefs break and rotations begin.
Watch price. Listen to sentiment. And never underestimate Uncle Jimmy.
What would you tell Jimmy today if he was your uncle? Let me know below!
One Love,
The FX PROFESSOR 💙
Disclosure: I am happy to be part of the Trade Nation's Influencer program and receive a monthly fee for using their TradingView charts in my analysis. Awesome broker, where the trader really comes first! 🌟🤝📈
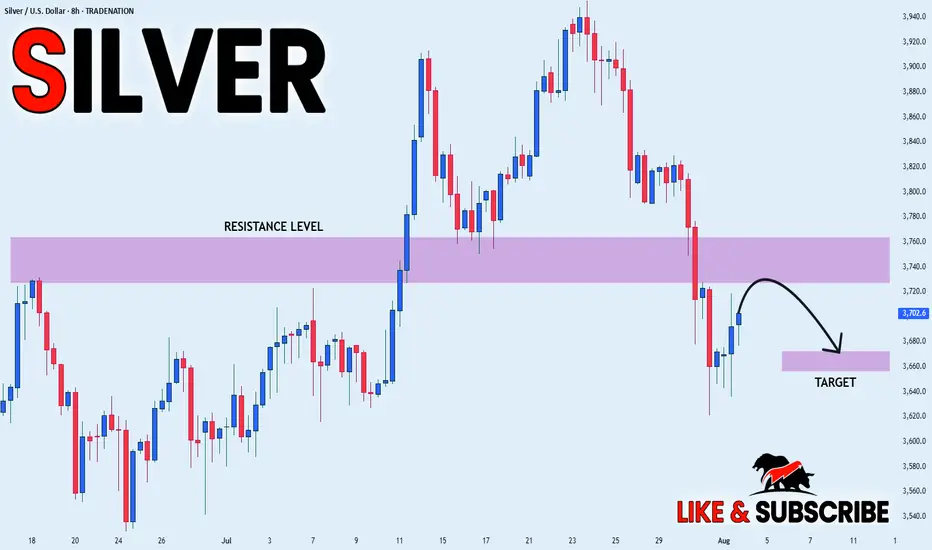
Silver bullish flag developingThe Silver remains in a bullish trend, with recent price action showing signs of a continuation breakout within the broader uptrend.
Support Zone: 3686 – a key level from previous consolidation. Price is currently testing or approaching this level.
A bullish rebound from 3686 would confirm ongoing upside momentum, with potential targets at:
3814 – initial resistance
3865 – psychological and structural level
3920 – extended resistance on the longer-term chart
Bearish Scenario:
A confirmed break and daily close below 3686 would weaken the bullish outlook and suggest deeper downside risk toward:
3645 – minor support
3590 – stronger support and potential demand zone
Outlook:
Bullish bias remains intact while the Silver holds above 3686. A sustained break below this level could shift momentum to the downside in the short term.
This communication is for informational purposes only and should not be viewed as any form of recommendation as to a particular course of action or as investment advice. It is not intended as an offer or solicitation for the purchase or sale of any financial instrument or as an official confirmation of any transaction. Opinions, estimates and assumptions expressed herein are made as of the date of this communication and are subject to change without notice. This communication has been prepared based upon information, including market prices, data and other information, believed to be reliable; however, Trade Nation does not warrant its completeness or accuracy. All market prices and market data contained in or attached to this communication are indicative and subject to change without notice.

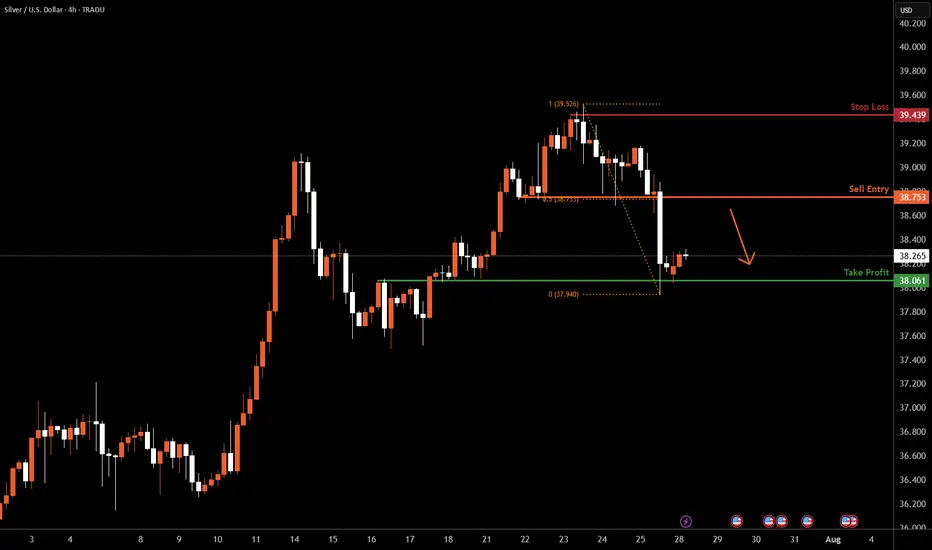
XAGUSD H4 I Bearish Reversal Based on the H4 chart analysis, we can see that the price is rising toward our sell entry at 38.75, which is a pullback resistance aligning with a 50% Fibo retracement.
Our take profit will be at 38.06, an overlap support level.
The stop loss will be placed at 39.43, a swing-high resistance level.
High Risk Investment Warning
Trading Forex/CFDs on margin carries a high level of risk and may not be suitable for all investors. Leverage can work against you.
Stratos Markets Limited (tradu.com ):
CFDs are complex instruments and come with a high risk of losing money rapidly due to leverage. 66% of retail investor accounts lose money when trading CFDs with this provider. You should consider whether you understand how CFDs work and whether you can afford to take the high risk of losing your money.
Stratos Europe Ltd (tradu.com ):
CFDs are complex instruments and come with a high risk of losing money rapidly due to leverage. 66% of retail investor accounts lose money when trading CFDs with this provider. You should consider whether you understand how CFDs work and whether you can afford to take the high risk of losing your money.
Stratos Global LLC (tradu.com ):
Losses can exceed deposits.
Please be advised that the information presented on TradingView is provided to Tradu (‘Company’, ‘we’) by a third-party provider (‘TFA Global Pte Ltd’). Please be reminded that you are solely responsible for the trading decisions on your account. There is a very high degree of risk involved in trading. Any information and/or content is intended entirely for research, educational and informational purposes only and does not constitute investment or consultation advice or investment strategy. The information is not tailored to the investment needs of any specific person and therefore does not involve a consideration of any of the investment objectives, financial situation or needs of any viewer that may receive it. Kindly also note that past performance is not a reliable indicator of future results. Actual results may differ materially from those anticipated in forward-looking or past performance statements. We assume no liability as to the accuracy or completeness of any of the information and/or content provided herein and the Company cannot be held responsible for any omission, mistake nor for any loss or damage including without limitation to any loss of profit which may arise from reliance on any information supplied by TFA Global Pte Ltd.
The speaker(s) is neither an employee, agent nor representative of Tradu and is therefore acting independently. The opinions given are their own, constitute general market commentary, and do not constitute the opinion or advice of Tradu or any form of personal or investment advice. Tradu neither endorses nor guarantees offerings of third-party speakers, nor is Tradu responsible for the content, veracity or opinions of third-party speakers, presenters or participants.
XAG/USD on high time frame
"Hello, for investors in XAG/USD, the $37 zone appears to be a low-risk area for buying. Both technical and fundamental analyses suggest that the price is likely to move higher towards $48."
If you require further insights or have additional information to discuss, feel free to share!

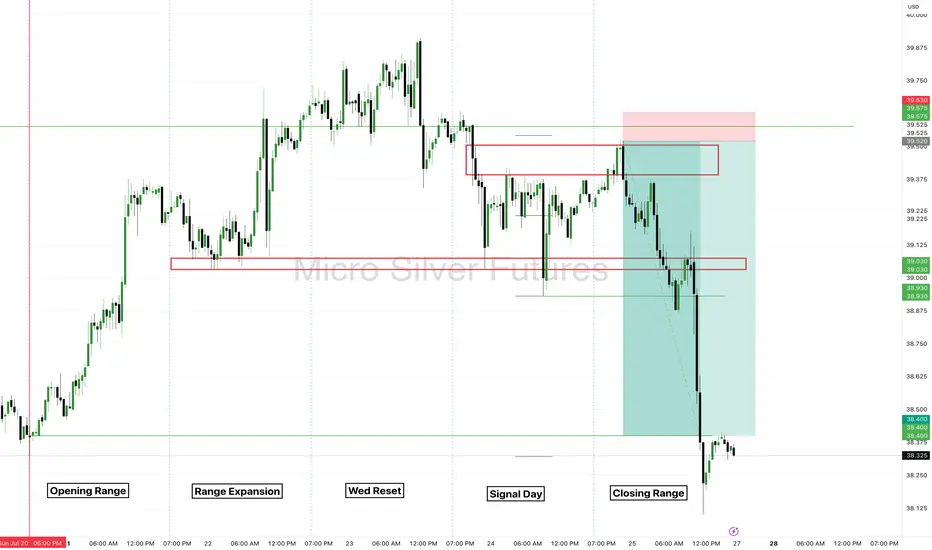
Silver Futures - Closing Range of the Week.Real trading comes down to the patience combined with emotional control to have the highest possible edge.
COMEX_MINI:SIL1!
There is no reason for your chart to filled be filled with ineffective distraction. Instead focus on simplicity to know exactly what to take a trade on. Be a hunter looking for the easy prey!