Natural Gas | Oil | Dollar | Silver | Gold Price Forecast.Natural Gas | Oil | Dollar | Silver | Gold Price Forecast.
COMEX:SI1! COMEX:GC1! NYMEX:CL1! AMEX:UNG
Silver

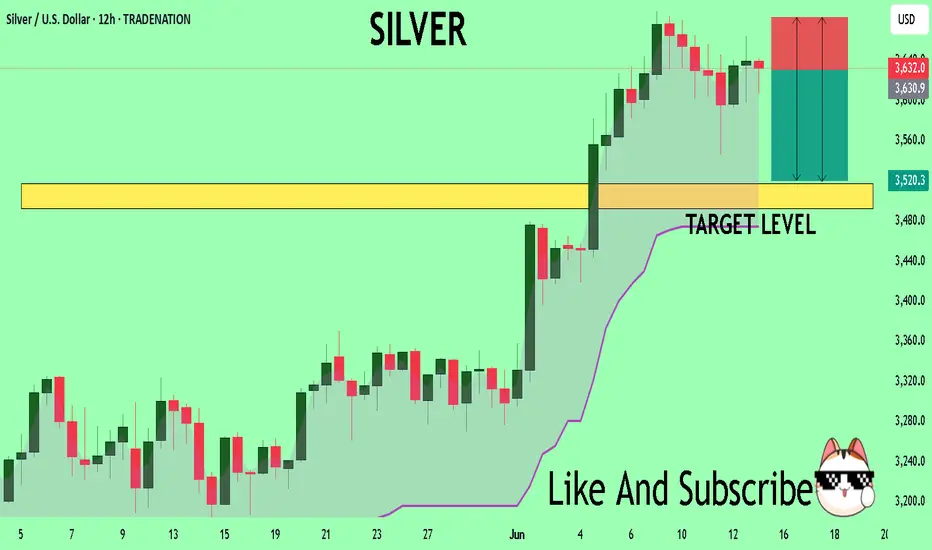
SILVER Buyers In Panic! SELL!
My dear friends,
My technical analysis for SILVER is below:
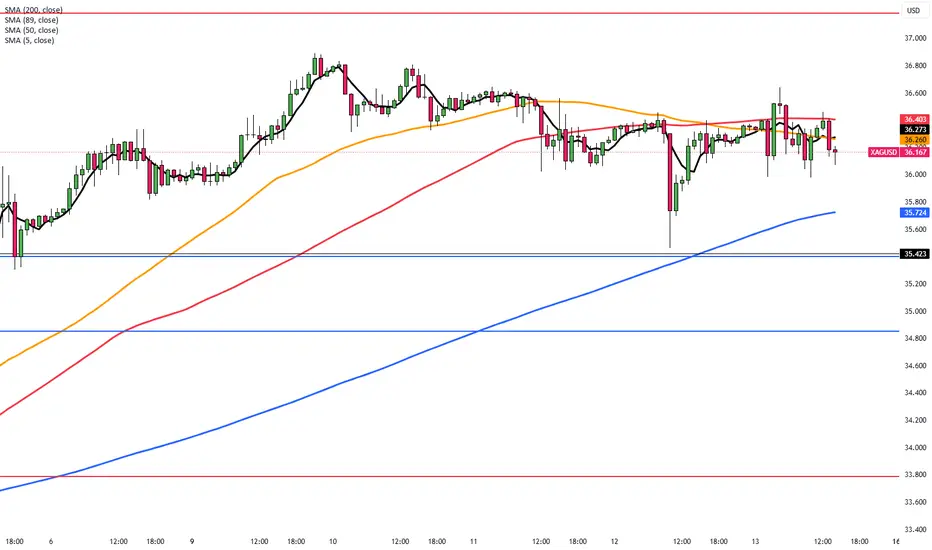
The market is trading on 36.320 pivot level.
Bias - Bearish
Technical Indicators: Both Super Trend & Pivot HL indicate a highly probable Bearish continuation.
Target - 35.168
Recommended Stop Loss - 36.830
About Used Indicators:
A pivot point is a technical analysis indicator, or calculations, used to determine the overall trend of the market over different time frames.
Disclosure: I am part of Trade Nation's Influencer program and receive a monthly fee for using their TradingView charts in my analysis.
———————————
WISH YOU ALL LUCK

Atleast 3x your moneyAlright, this is getting set to fly high now. Catching with gold and other commodities. All the best !!

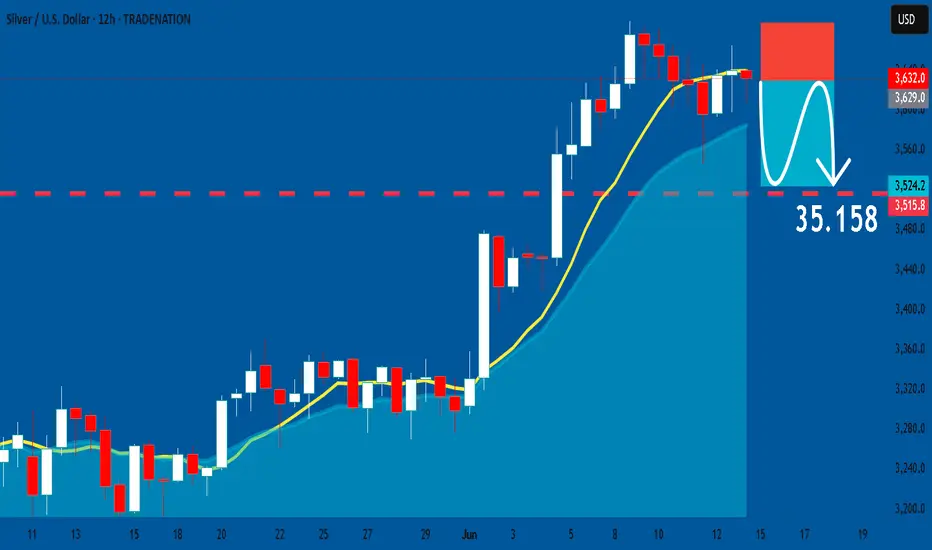
SILVER: Short Trade Explained
SILVER
- Classic bearish setup
- Our team expects bearish continuation
SUGGESTED TRADE:
Swing Trade
Short SILVER
Entry Point - 36.320
Stop Loss - 36.874
Take Profit - 35.158
Our Risk - 1%
Start protection of your profits from lower levels
Disclosure: I am part of Trade Nation's Influencer program and receive a monthly fee for using their TradingView charts in my analysis.
❤️ Please, support our work with like & comment! ❤️
BRIEFING Week #24 : is Stagflation Coming next ?Here's your weekly update ! Brought to you each weekend with years of track-record history..
Don't forget to hit the like/follow button if you feel like this post deserves it ;)
That's the best way to support me and help pushing this content to other users.
Kindly,
Phil

Intraday Gold Trading System with Neural Networks: Step-by-Step________________________________________
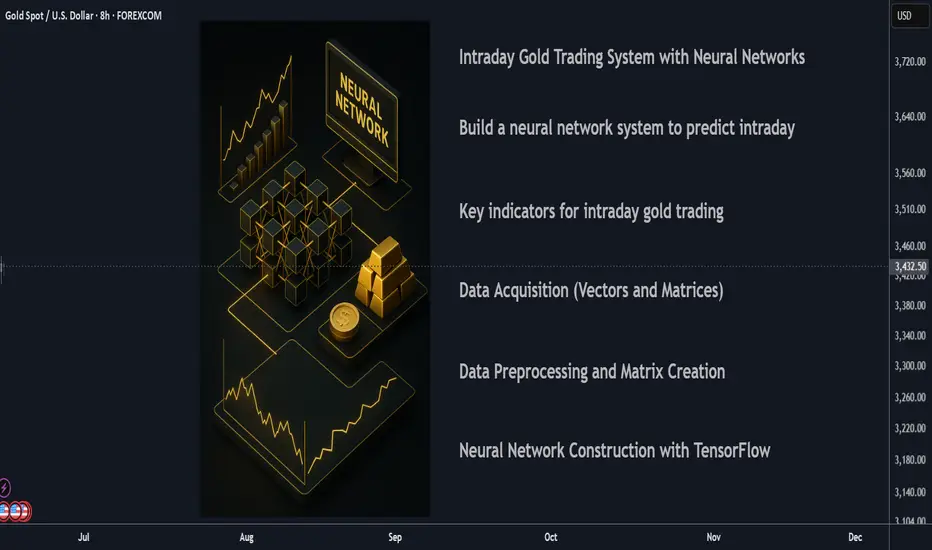
🏆 Intraday Gold Trading System with Neural Networks: Step-by-Step Practical Guide
________________________________________
📌 Step 1: Overview and Goal
The goal is to build a neural network system to predict intraday short-term gold price movements—typically forecasting the next 15 to 30 minutes.
________________________________________
📈 Step 2: Choosing Indicators (TradingView Equivalents)
Key indicators for intraday gold trading:
• 📊 Moving Averages (EMA, SMA)
• 📏 Relative Strength Index (RSI)
• 🌀 Moving Average Convergence Divergence (MACD)
• 📉 Bollinger Bands
• 📦 Volume Weighted Average Price (VWAP)
• ⚡ Average True Range (ATR)
________________________________________
🗃 Step 3: Data Acquisition (Vectors and Matrices)
Use Python's yfinance to fetch intraday gold data:
import yfinance as yf
import pandas as pd
data = yf.download('GC=F', period='30d', interval='15m')
________________________________________
🔧 Step 4: Technical Indicator Calculation
Use Python’s pandas_ta library to generate all required indicators:
import pandas_ta as ta
data = ta.ema(data , length=20)
data = ta.ema(data , length=50)
data = ta.rsi(data , length=14)
macd = ta.macd(data )
data = macd
data = macd
bbands = ta.bbands(data , length=20)
data = bbands
data = bbands
data = bbands
data = ta.atr(data , data , data , length=14)
data.dropna(inplace=True)
________________________________________
🧹 Step 5: Data Preprocessing and Matrix Creation
Standardize your features and shape data for neural networks:
from sklearn.preprocessing import StandardScaler
import numpy as np
features =
scaler = StandardScaler()
data_scaled = scaler.fit_transform(data )
def create_matrix(data_scaled, window_size=10):
X, y = ,
for i in range(len(data_scaled) - window_size - 1):
X.append(data_scaled )
y.append(data .iloc )
return np.array(X), np.array(y)
X, y = create_matrix(data_scaled, window_size=10)
________________________________________
🤖 Step 6: Neural Network Construction with TensorFlow
Use LSTM neural networks for sequential, time-series prediction:
import tensorflow as tf
from tensorflow.keras.models import Sequential
from tensorflow.keras.layers import LSTM, Dense, Dropout
model = Sequential( , X.shape )),
Dropout(0.2),
LSTM(32, activation='relu'),
Dense(1)
])
model.compile(optimizer='adam', loss='mse')
________________________________________
🎯 Step 7: Training the Neural Network
history = model.fit(X, y, epochs=50, batch_size=32, validation_split=0.2)
________________________________________
📊 Step 8: Evaluating Model Performance
Visualize actual vs. predicted prices:
import matplotlib.pyplot as plt
predictions = model.predict(X)
plt.plot(y, label='Actual Price')
plt.plot(predictions, label='Predicted Price')
plt.xlabel('Time Steps')
plt.ylabel('Gold Price')
plt.legend()
plt.show()
________________________________________
🚦 Step 9: Developing a Trading Strategy
Translate predictions into trading signals:
def trade_logic(predicted, current, threshold=0.3):
diff = predicted - current
if diff > threshold:
return "Buy"
elif diff < -threshold:
return "Sell"
else:
return "Hold"
latest_data = X .reshape(1, X.shape , X.shape )
predicted_price = model.predict(latest_data)
current_price = data .iloc
decision = trade_logic(predicted_price, current_price)
print("Trading Decision:", decision)
________________________________________
⚙️ Step 10: Real-Time Deployment
Automate the model for live trading via broker APIs (pseudocode):
while market_open:
live_data = fetch_live_gold_data()
live_data_processed = preprocess(live_data)
prediction = model.predict(live_data_processed)
decision = trade_logic(prediction, live_data )
execute_order(decision)
________________________________________
📅 Step 11: Backtesting
Use frameworks like Backtrader or Zipline to validate your strategy:
import backtrader as bt
class NNStrategy(bt.Strategy):
def next(self):
if self.data.predicted > self.data.close + threshold:
self.buy()
elif self.data.predicted < self.data.close - threshold:
self.sell()
cerebro = bt.Cerebro()
cerebro.addstrategy(NNStrategy)
# Add data feeds and run cerebro
cerebro.run()
________________________________________
🔍 Practical Use-Cases
• ⚡ Momentum Trading: EMA crossovers, validated by neural network.
• 🔄 Mean Reversion: Trade at Bollinger Band extremes, validated with neural network predictions.
• 🌩️ Volatility-based: Use ATR plus neural net for optimal entry/exit timing.
________________________________________
🛠 Additional Recommendations
• Frameworks: TensorFlow/Keras, PyTorch, scikit-learn
• Real-time monitoring and risk management are crucial—use volatility indicators!
________________________________________
📚 Final Thoughts
This practical guide arms you to build, deploy, and manage a neural network-based intraday gold trading system—from data acquisition through backtesting—ensuring you have the tools for robust, data-driven, and risk-managed trading strategies.
________________________________________
SILVER: The Market Is Looking Down! Short!
My dear friends,
Today we will analyse SILVER together☺️
The in-trend continuation seems likely as the current long-term trend appears to be strong, and price is holding below a key level of 36.303 So a bearish continuation seems plausible, targeting the next low. We should enter on confirmation, and place a stop-loss beyond the recent swing level.
❤️Sending you lots of Love and Hugs❤️

Dollar Week Review and thoughtsMy General thoughts on dollar and keeping my bearish bias going forward into next week.
Still bullish silver gold cable fibre and looking to see what happens with aussie to get in again
Have a good weekend!!

SPY/QQQ Plan Your Trade For 6-13 : Harami-Inside PatternToday's pattern suggests the markets may stall into a sideways price range.
After the news of Israel targeting Iran in a preemptive strike late yesterday afternoon, the markets moved dramatically lower while Gold & Silver moved higher on the news.
I, personally, see this market trend as a shift in thinking ahead of a long Father's Day weekend.
I see traders trying to position their accounts/trades for uncertainty.
I believe we could see a bit of a shift today - particularly in Metals and the QQQ/NASDAQ/BTCUSD.
Overall, I strongly suggest traders prepare for extreme volatility this weekend as any further news of a counter-strike or further military action in the Middle East could roil the markets.
Happy Friday the 13th - everyone.
Going to be an interesting day to say the least.
Get some.
#trading #research #investing #tradingalgos #tradingsignals #cycles #fibonacci #elliotwave #modelingsystems #stocks #bitcoin #btcusd #cryptos #spy #gold #nq #investing #trading #spytrading #spymarket #tradingmarket #stockmarket #silver

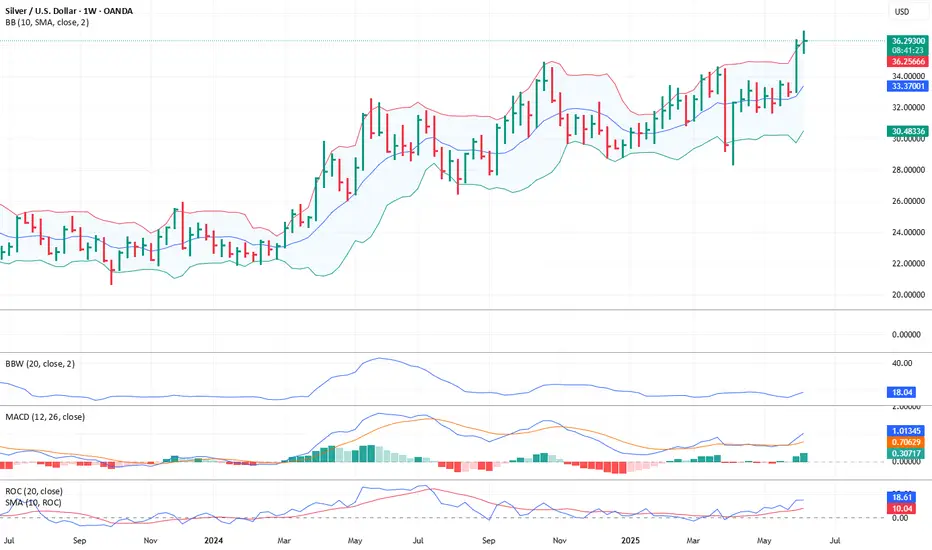
Silver to Continue UpWhen a price goes to oversold/overbought levels as indicated by the Bollinger Band, one must them look at the Band Width. When this indicator is rising, it shows that price is stronger than the average. My rule of thumb is to stay positioned in the direction of the trend until this number reverses.
Rate Cut Bets Keep Silver in FocusSilver slipped toward $36 per ounce as investors locked in gains after hitting a 13-year high. The metal remains supported by strong industrial demand, supply deficits, and safe-haven interest during global uncertainty. Industrial uses, especially in solar and electronics, account for over half of the demand. A fifth consecutive annual supply deficit is expected, though the Silver Institute sees the gap narrowing by 21% in 2025. Softer U.S. inflation data for May also increased expectations of Fed rate cuts beginning in September, helping sustain interest in precious metals.
Resistance is set at 36.90, while support stands at 35.40.
Silver energy buildup, Bullish continuation pattern developing Key Support and Resistance Levels
Resistance Level 1: 3723
Resistance Level 2: 3787
Resistance Level 3: 3847
Support Level 1: 3507
Support Level 2: 3448
Support Level 3: 3386
This communication is for informational purposes only and should not be viewed as any form of recommendation as to a particular course of action or as investment advice. It is not intended as an offer or solicitation for the purchase or sale of any financial instrument or as an official confirmation of any transaction. Opinions, estimates and assumptions expressed herein are made as of the date of this communication and are subject to change without notice. This communication has been prepared based upon information, including market prices, data and other information, believed to be reliable; however, Trade Nation does not warrant its completeness or accuracy. All market prices and market data contained in or attached to this communication are indicative and subject to change without notice.

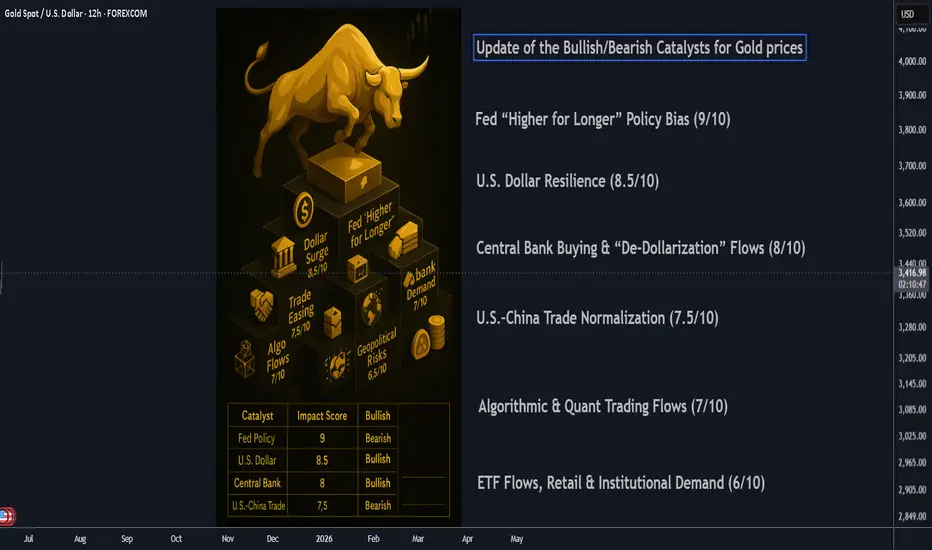
Update of the Bullish/Bearish Catalysts for Gold prices________________________________________
⚡️ Gold’s Pullback: A Reset, Not the End
After peaking above $3,500/oz in April, gold’s slide back toward $3,210 marks a sharp—but not unusual—correction. What’s changed in the gold narrative? The rapid unwinding of panic bids as the Fed stays hawkish, the dollar flexes, and risk appetite returns. But beneath the surface, multiple structural drivers—old and new—are shaping gold’s next act.
________________________________________
1. Fed “Higher for Longer” Policy Bias (9/10)
Still the #1 driver.
With inflation sticky and the U.S. labor market robust, the Federal Reserve’s reluctance to cut rates (4.25–4.50%) is pinning real yields near multi-year highs. This erodes the appeal of non-yielding assets like gold, particularly for Western investors.
🦅 Watch for any dovish shift—a single Fed pivot could reignite gold fast.
________________________________________
2. U.S. Dollar Resilience (8.5/10)
The DXY recently surged above 101, buoyed by relative U.S. growth outperformance and ongoing EM weakness. Since gold is dollar-priced, a strong greenback makes gold more expensive for non-dollar buyers, crimping global demand.
💵 Sustained dollar strength could push gold closer to $3,100 unless countered by inflation or new geopolitical stress.
________________________________________
3. Central Bank Buying & “De-Dollarization” Flows (8/10)
This is the new wild card.
Countries like China, India, Turkey, and Russia are accelerating gold reserves accumulation—partly to hedge against dollar-centric sanctions and diversify away from U.S. Treasuries. Q2 2025 data shows a 35% jump in net central bank purchases year-on-year.
🏦 This bid underpins the gold market even when ETFs and retail are sellers.
________________________________________
4. U.S.–China Trade Normalization (7.5/10)
The May 2025 Geneva agreement was a big de-risking event. While tariffs haven’t vanished, steady progress on tech and agriculture reduces tail risk for global trade, putting downward pressure on gold’s safe-haven premium.
🌏 Any breakdown or tariff surprise could quickly reverse this.
________________________________________
5. Algorithmic & Quant Trading Flows (7/10)
Gold’s volatility is now heavily influenced by systematic funds. CTA (commodity trading advisor) and quant-driven selling accelerated the recent drop once $3,300 was breached. This non-fundamental selling creates overshoots—but also sharp reversals on technical bounces.
🤖 Expect snapbacks when positioning reaches extremes.
________________________________________
6. U.S.–U.K. & EU Trade Deals (6.5/10)
Both deals have reduced the global uncertainty premium. While the economic impact is moderate, improved global relations have pushed capital into equities and away from gold.
🇬🇧 Keep an eye on political risk, especially if new tariffs or Brexit-related shocks re-emerge.
________________________________________
7. India–Pakistan and Middle East Geopolitical Risks (6.5/10)
Tensions have cooled, but remain a latent driver. The India–Pakistan border saw restraint in May; Iran–U.S. talks are “cautiously positive.” Any surprise flare-up, especially involving oil, can quickly restore gold’s safe-haven bid.
🕊️ Event-driven spikes likely, but not sustained unless escalation persists.
________________________________________
8. ETF Flows, Retail & Institutional Demand (6/10)
ETF inflows have slowed sharply in 2025, but central bank and Asian buying partly offset this. U.S. retail interest has faded due to higher Treasury yields, but any sign of real rates rolling over could spark new inflows.
📈 ETF demand is now more a symptom than a cause of price moves.
________________________________________
9. Technological Demand & Jewelry Trends (5.5/10)
Longer-term, gold’s use in electronics, EVs, and green tech is rising modestly (up ~3% YoY). Indian and Chinese jewelry demand—seasonally soft now—could rebound late 2025 if income and sentiment recover.
📿 Not a short-term driver, but a steady tailwind in the background.
________________________________________
10. Fiscal Risk & U.S. Debt Sustainability (5.5/10)
Rising concerns about the U.S. debt trajectory, especially if deficits widen or the U.S. nears a shutdown or downgrade, can trigger flight-to-quality bids for gold. This is not the main driver now, but is a key “black swan” risk if Treasury auctions stumble.
💣 Could move up the list rapidly on negative headlines.
________________________________________
🌐 Other Catalysts to Watch:
• Israel – Iran tensions in the Middle East – limited impact on gold prices.
• Crypto Market Volatility (5/10): Periods of sharp crypto drawdowns have triggered some rotation into gold, but the correlation is inconsistent.
• Chinese Real Estate Stress (5/10): Signs of further slowdown or crisis (e.g., major developer defaults) could boost gold as a defensive play in Asia.
• Physical Supply Disruptions (4/10): Mine strikes, export restrictions, or transport bottlenecks can create localized price spikes, but rarely move the global market for long.
________________________________________
🏆 2025 Gold Catalyst Rankings (with Impact Scores)
Rank Catalyst Strength/10 Current Impact Direction Notes
1 Fed “Higher for Longer” Policy 9.0 Very High Bearish Key yield driver
2 U.S. Dollar Resilience 8.5 Very High Bearish Hurts non-USD demand
3 Central Bank & “De-Dollarization” Buying 8.0 High Bullish Structural support
4 U.S.–China Trade Normalization 7.5 High Bearish De-risks global trade
5 Algorithmic/Quant Trading Flows 7.0 High Bearish Magnifies volatility
6 U.S.–U.K./EU Trade Deals 6.5 Moderate Bearish Risk appetite rising
7 India–Pakistan/Mideast Geopolitics 6.5 Moderate Neutral Event risk
8 ETF, Retail & Institutional Flows 6.0 Moderate Bearish Trend follower
9 Tech/Jewelry Physical Demand 5.5 Low Bullish Seasonal uptick possible
10 U.S. Debt/Fiscal Sustainability 5.5 Low Bullish Potential tail risk
11 Crypto Market Volatility 5.0 Low Bullish Risk-off flows (sometimes)
12 China Property Crisis 5.0 Low Bullish Asian safe-haven buying
13 Physical Supply Disruptions 4.0 Very Low Bullish Rare but possible
________________________________________
🚦Where Next for Gold?
• Current price: ~$3,210/oz
• Key support: $3,150/oz
• Key upside triggers: A dovish Fed surprise, sharp dollar reversal, sudden geopolitical event, or central bank “buying spree.”
• Risks: Extended strong dollar, yield spike, no escalation of global risks.
________________________________________
Summary Table: 2025 Gold Price Catalysts Comparison
Catalyst 2024 Score 2025 Score Change Impact Direction (2025) Commentary
Fed Rate Policy 9 9 – Bearish Unchanged, still dominant
U.S. Dollar 8 8.5 ↑ Bearish Gained in strength
Central Bank Buying 7 8 ↑ Bullish Grown in importance, especially in Asia
U.S.-China Trade 7.5 7.5 – Bearish Still relevant, deal holding for now
Algorithmic/Quant Flows 6 7 ↑ Bearish Systematic trading influence is rising
Geopolitics (excl. Russia/Ukraine) 6 6.5 ↑ Neutral Slight increase, mostly latent risks
ETF/Institutional Flows 5 6 ↑ Bearish Slower, but still influential
Jewelry/Tech Demand 4.5 5.5 ↑ Bullish Tech/jewelry more important now
U.S. Debt/Fiscal Risk 5 5.5 ↑ Bullish Gaining attention with deficit concerns
Crypto Market Volatility 4 5 ↑ Bullish Correlation growing, but inconsistent
China Property Risk N/A 5 NEW Bullish Added due to emerging Asian risk
Physical Supply Disruption 3.5 4 ↑ Bullish Minor, only spikes on rare events
________________________________________
🥇 Bottom Line:
Gold’s retreat reflects a rebalancing of risk and yield, but the stage is set for sudden moves—especially if the Fed blinks, the dollar falters, or new shocks emerge. The top three catalysts (Fed, Dollar, Central Bank buying) are especially worth watching as we head into the second half of 2025.
What is Gold Silver Spread?What is gold silver spread? How to understand them to determine the market direction.
Reuters mentioned that the gold-silver ratio dropped from 105 to 94. What does this mean? Does it indicate that silver is about to trend higher, or is it a sign that gold will continue its trend?
Micro Silver Futures
Ticker: SIL
Minimum fluctuation:
0.005 per troy ounce = $5.00
Disclaimer:
• What presented here is not a recommendation, please consult your licensed broker.
• Our mission is to create lateral thinking skills for every investor and trader, knowing when to take a calculated risk with market uncertainty and a bolder risk when opportunity arises.
CME Real-time Market Data help identify trading set-ups in real-time and express my market views. If you have futures in your trading portfolio, you can check out on CME Group data plans available that suit your trading needs tradingview.sweetlogin.com
Trading the Micro: www.cmegroup.com
www.cmegroup.com

Silver is nearing a critical rangeThe main move is done! It's time to rest now and don't expect any big moves on the chart. We are approaching a very important area that I think the price doesn't have enough strength to break through.
SPY/QQQ Plan Your Trade For 6-12: BaseRally In Trend ModeToday's pattern suggests the markets may attempt to identify a base and move higher (rally) off that base level.
Given the overnight price activity, I suggest the process of identifying the base level could prompt a deeper early decline in price - possibly attempting to retest 595-597 lows before finding support and attempting to rally.
As I've been warning over the past few weeks/months, I'm still seeing the Excess Phase Peak pattern playing out as a Flag Termination - rolling into a downtrend and attempting to move back towards the $480 lows as a real possibility. I've been warning and watching for the breakdown in trend - but we've not seen it yet.
Thus, we are still BULLISH until we get a confirmation of a solid breakdown. That would be a move below the 580-585 level at this point. We need to see some type of solid breakdown in price, breaking away from the FLAG setup and moving downward, before I could confidently suggest the Flag Breakdown has happened.
Gold and Silver are making a big move higher. Gold is finally starting to move back above $3400 and I believe watching Silver, Gold, & Platinum rally suggests FEAR is elevating as we move into the end of June.
I still believe Gold has a chance to rally above $4k before the end of June. We'll see if it happens.
BTCUSD is moving into a DUAL-EPP pattern. This is very interesting. Watch the video as I highlight why this could prompt a dual-stage EPP breakdown in Bitcoin over the next 20 to 50+ days.
Get some.
#trading #research #investing #tradingalgos #tradingsignals #cycles #fibonacci #elliotwave #modelingsystems #stocks #bitcoin #btcusd #cryptos #spy #gold #nq #investing #trading #spytrading #spymarket #tradingmarket #stockmarket #silver

Dollar - WE HIT OUR FIRST TARGET TODAY!!!Amazing work on the dollar for about a month of analysis and finally hitting our target. Its taken its sweet time to drift lower but we have the bigger move today which clipped our target.
Follow for more updates on dollar and what im looking to trade.
Please like and sub and get notified when videos come out if you like my content.
Go back and look at tall the 2 min clips for the last month. We have been in sync all this time

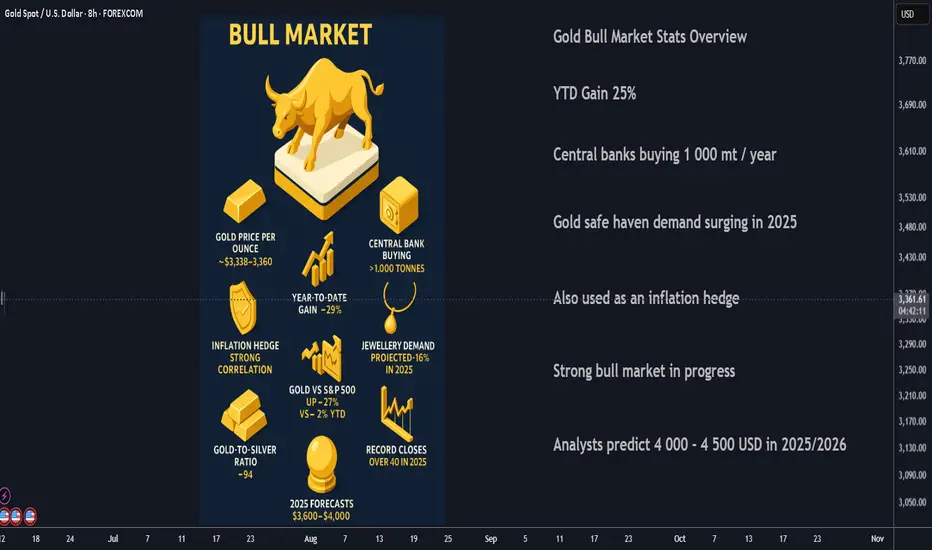
TOP 10 Stats of the Current Gold Bull Market in 2025 and Outlook📊 Top 10 Stats of the Current Gold Bull Market (2025)
1. 🥇 Gold price per ounce: Around $3,338–$3,364, with a recent all-time high above $3,500 in April 2025
2. 📈 Year-to-date gain: About +29% in 2025 so far, after a +30% gain in 2024
3. 🏦 Central bank buying: More than 1,000 tonnes bought for the fourth straight year, reserves near record levels
4. 🔒 Inflation hedge: Strong inverse correlation with real yields; high demand driven by inflation and geopolitical worries
5. 📊 Gold vs S&P 500: Both reached new highs together; gold is up about 27% YTD while the S&P 500 is up only around 2%
6. 💍 Jewellery demand: Global gold jewelry demand is down about 9% in 2024, projected to drop another 16% in 2025 due to high prices
7. ⚖️ Gold-to-silver ratio: Now around 94, down from a peak of 105—showing silver is regaining ground
8. 🏅 Record closes: More than 40 record daily closes for gold in 2025, prices consolidating around $3,290–$3,400
9. 🏛️ Technical breakout: Broke out of a 13-year “cup-and-handle” technical pattern in March 2024
10. 🔮 2025 forecasts: Predictions range from $3,600–$4,000 by Q2 2026, with some expecting as high as $4,500 if risks rise
________________________________________
🔄 How This Gold Bull Market Compares to Past Bull Markets
1️⃣ 1968–1980 Super Bull
• 🕰️ Gold climbed from ~$35 to ~$850, a massive 2,330% gain over 12 years
• 🔥 Driven by double-digit inflation, end of the gold standard, and political turmoil
• ⚠️ Huge corrections, including a nearly 45% drop in 1974–76, but rapid rebounds
2️⃣ 1999–2008 Bull Market
• 💹 Gold surged from ~$252 to ~$1,023 (about +305%) in 9 years
• 🚀 Fueled by the commodities supercycle and concerns about global imbalances
• 📉 Big correction during the 2008 financial crisis, but gold rebounded fast
3️⃣ 2018–2025 (Current Cycle)
• ⏳ Gold broke out in 2024 from a 13-year sideways base
• 💥 Up nearly 200% from the 2018 lows to over $3,500
• 🏦 Central banks are the biggest buyers, unlike earlier cycles
• 🛡️ Corrections have been milder—2022 saw only a 20% drop
• 🏃♂️ Fast recovery: new highs reached within months, not years
________________________________________
📊 Quick Comparison Table
Metric 1968–80 Super Bull 1999–2008 Bull 2018–2025 Current
🚀 Total Gain ~2,330% ~305% ~200% so far
⏲️ Length 12 years 9 years 7 years so far
💔 Biggest Drawdown –45% (1974–76) –30% (2008) –20% (2022)
🏦 Central Bank Role Moderate Emerging Dominant
📉 Correction Speed Years to recover 4 years Months
🏛️ Technical Pattern Secular breakout Multiple peaks Broke 13-yr base
________________________________________
🧭 What Makes the Current Bull Market Unique
• 🏦 Central banks are setting the pace with record-breaking demand
• 🩹 Corrections are less severe and recoveries are quicker
• 📈 Gold is rallying alongside stocks, which is rare historically
• 🏛️ The breakout from a 13-year consolidation signals strong structural support
• 🔮 Major forecasts predict further highs through 2026, suggesting this may become one of the strongest cycles ever
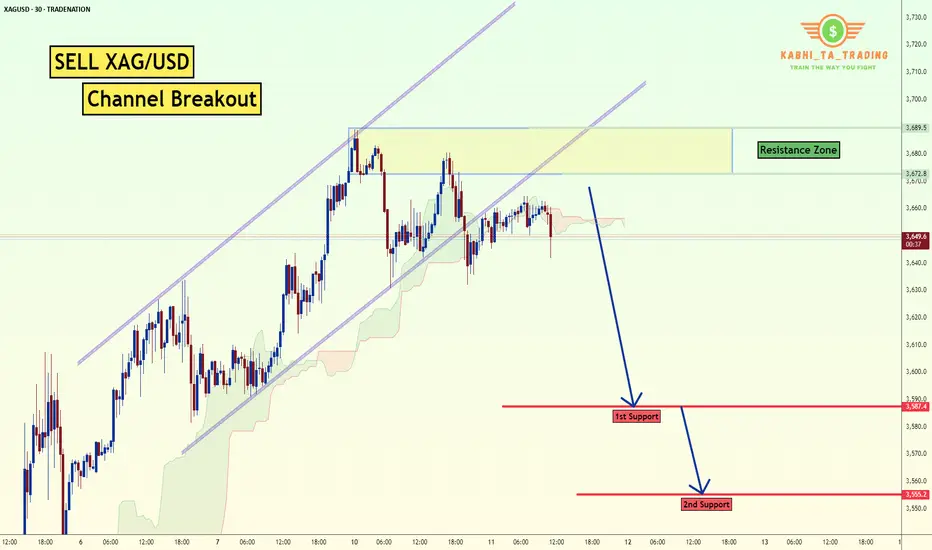
XAG/USD - Channel Breakout (11.06.2025) The XAG/USD Pair on the M30 timeframe presents a Potential Selling Opportunity due to a recent Formation of a CHannel Breakout Pattern. This suggests a shift in momentum towards the downside in the coming hours.
Possible Short Trade:
Entry: Consider Entering A Short Position around Trendline Of The Pattern.
Target Levels:
1st Support – 3587
2nd Support – 3555
🎁 Please hit the like button and
🎁 Leave a comment to support for My Post !
Your likes and comments are incredibly motivating and will encourage me to share more analysis with you.
Best Regards, KABHI_TA_TRADING
Thank you.
Disclosure: I am part of Trade Nation's Influencer program and receive a monthly fee for using their TradingView charts in my analysis.
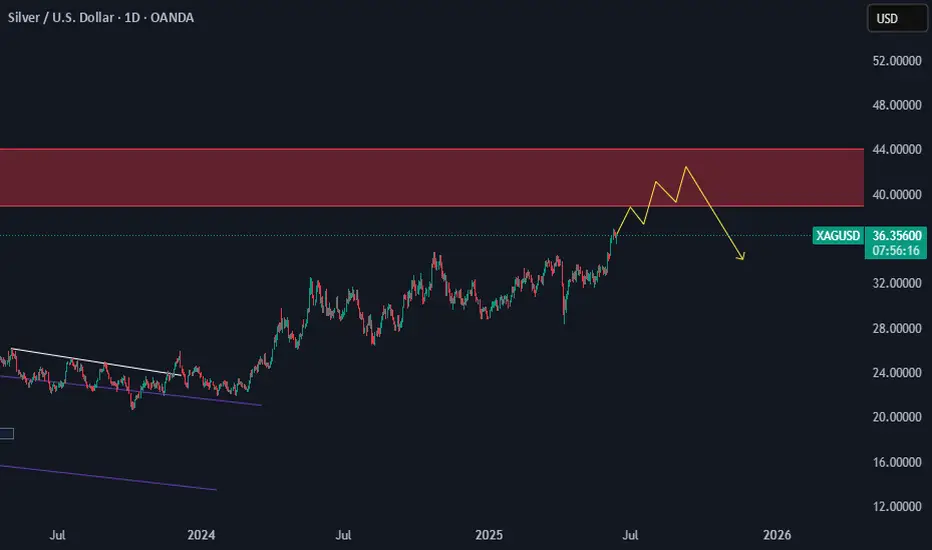
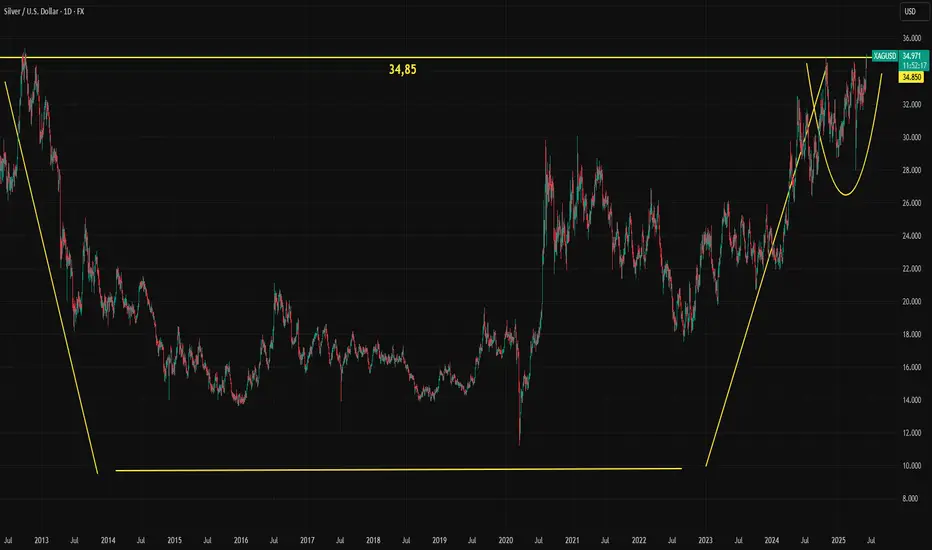
Silver Tests Key Long-Term ResistanceSilver is testing the 34.85 level, a critical resistance both in the short and long term. Since 2013, a cup and handle formation has developed just beneath this level. A confirmed breakout could signal sustained long-term bullish momentum.
Supporting this outlook, the gold/silver ratio has recently shown a decisive tilt in gold's favor, reaching historically extreme levels. This test of 34.85 might be the catalyst silver bulls have been waiting for and a return to normal signal for gold/silver ratio with pair trade oppurtunity.
However, caution is warranted. Silver is known for sharp intraday and weekly reversals. Confirming the breakout or false breakout could become tricky.
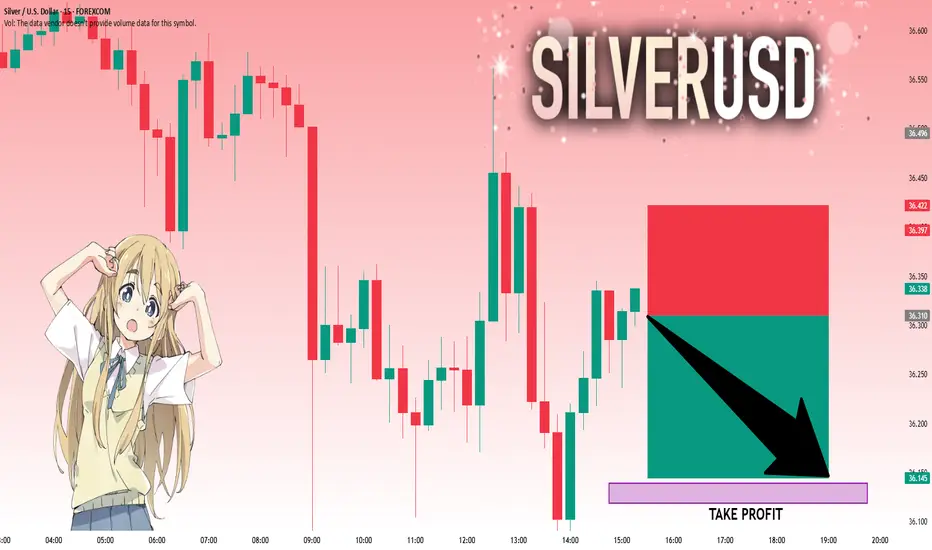
SILVER: Absolute Price Collapse Ahead! Short!
My dear friends,
Today we will analyse SILVER together☺️
The recent price action suggests a shift in mid-term momentum. A break below the current local range around 36.310 will confirm the new direction downwards with the target being the next key level of 36.139.and a reconvened placement of a stop-loss beyond the range.
❤️Sending you lots of Love and Hugs❤️
SPY/QQQ Plan Your Trade For 6-11: Bottom-Base Rally Counter TrndToday's counter-trend Bottom-Base Rally pattern suggests the markets may attempt to find a peak and roll over into a downtrend.
The normal Bottom-Base Rally pattern is similar to the start of a moderate price base/bottom, then moving into a moderate rally phase.
In counter-trend mode this pattern would be inverted - forming a Top and then moving into a downward price trend.
I've been warning of the potential of a rollover top type of pattern in the SPY over the past few weeks - but it never really setup/confirmed.
I'll be curious to see if this counter-trend pattern, today, sets up some type of big top formation in the SPY/QQQ. It might be related to news as well.
Gold and Silver have a Gap-Stall-Revert-FLUSH pattern. This is always an interesting pattern because is suggests price is going to attempt to either gap and trend or stall and revert. My guess is we are looking at more trending in metals today.
Platinum is RIPPING higher (PL1!). Because of this, I believe Silver and Gold will attempt to follow Platinum and move to the upside today.
BTCUSD is stalling a bit. We'll see if we get any big price move in Bitcoin today. After the big rally over the past few days, it will be interesting to see if BTCUSD reverts downward or continues higher.
Overall, today's patterns suggest the markets are seeking direction. Get ready for an exciting day in the markets.
Get some.
#trading #research #investing #tradingalgos #tradingsignals #cycles #fibonacci #elliotwave #modelingsystems #stocks #bitcoin #btcusd #cryptos #spy #gold #nq #investing #trading #spytrading #spymarket #tradingmarket #stockmarket #silver
