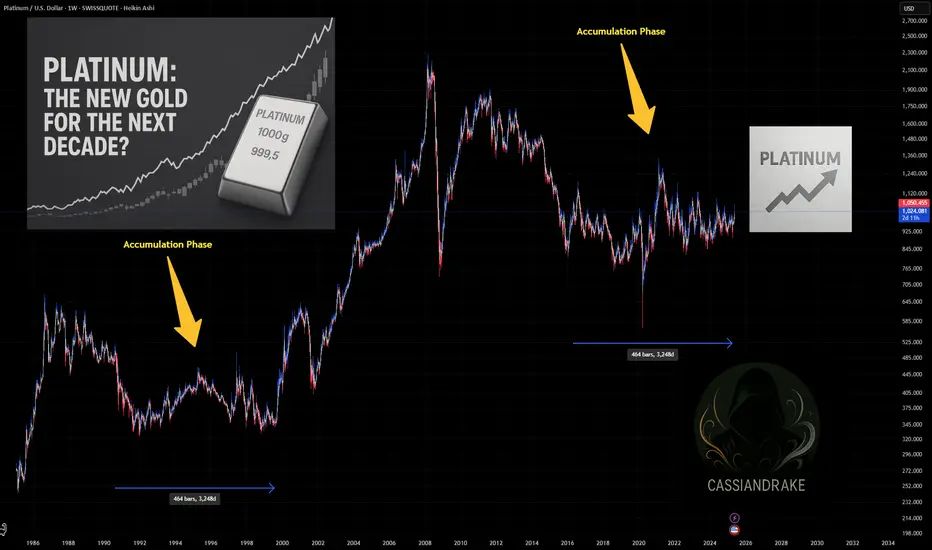
Platinum: The New Gold for the Next Decade?For centuries, Gold has been the ultimate store of value, a safe haven in times of economic uncertainty. However, as Gold potentially enters a multi-year distribution phase, investors may need to look elsewhere for the next big opportunity. Enter Platinum, a metal that is rarer, more versatile, and increasingly relevant in the modern industrial landscape.
Gold’s Distribution Phase and Bitcoin’s Speculative Nature
Gold has historically been a hedge against inflation and economic downturns, but recent trends suggest it may be topping out. Central banks have been stockpiling Gold, yet its price movements indicate a possible stagnation. Meanwhile, Bitcoin, once hailed as "digital gold," has shown extreme volatility, largely driven by speculation and relentless social media hype. Unlike Gold, Bitcoin lacks intrinsic value, and its future remains uncertain as institutional interest fluctuates.
Why Platinum Stands Out
Platinum is 30 times rarer than gold and has been in an accumulation phase since 2015. Unlike Palladium, which is highly volatile, Platinum maintains a more stable price structure. Its industrial applications make it indispensable in sectors such as:
Automotive Industry : Used in catalytic converters to reduce emissions.
Clean Energy & Hydrogen Economy : Essential in fuel cells for green energy.
Cloud Computing & Electronics : Platinum’s conductivity makes it valuable in advanced computing.
Space Exploration & Aerospace : Its resistance to extreme temperatures makes it ideal for high-tech applications.
Medical & Biomedical Uses : Found in cancer treatments and medical implants.
The Future of Platinum
With global trends shifting toward industrialization and sustainability, platinum’s demand is set to rise. Supply constraints, primarily due to limited mining operations in South Africa, further add to its scarcity. As gold enters a distribution phase, platinum is positioned to take off, potentially becoming a new standard for wealth preservation and industrial utility.
TVC:PLATINUM TVC:PALLADIUM TVC:GOLD TVC:SILVER MARKETSCOM:BITCOIN TVC:DXY SP:SPX EURONEXT:N100 BITSTAMP:BTCUSD OANDA:XAUUSD OANDA:XPTUSD OANDA:XPDUSD OANDA:XAGUSD
Silver
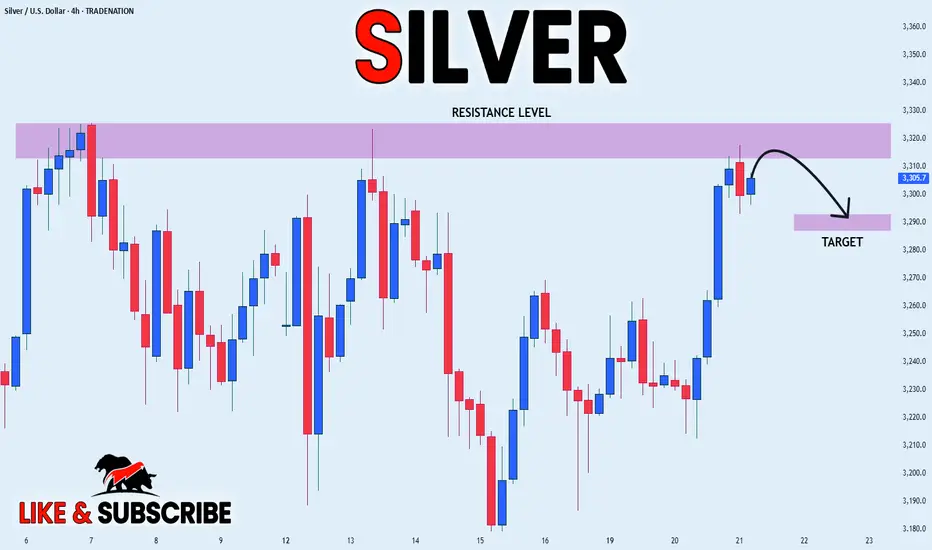
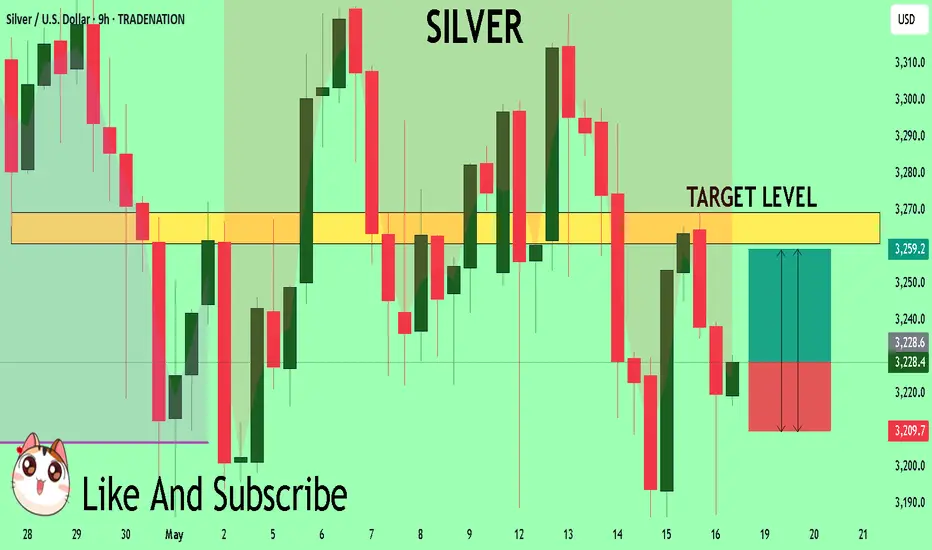
SILVER RISKY LOCAL SHORT|
✅SILVER is going up now
But despite our mid-term
Bullish bias the price will
Soon hit a horizontal
Resistance level around 33.20$
From where a local bearish
Pullback will be expected
SHORT🔥
✅Like and subscribe to never miss a new idea!✅
Disclosure: I am part of Trade Nation's Influencer program and receive a monthly fee for using their TradingView charts in my analysis.
SILVER: Next Move Is Up! Long!
My dear friends,
Today we will analyse SILVER together☺️
The recent price action suggests a shift in mid-term momentum. A break above the current local range around 32.982 will confirm the new direction upwards with the target being the next key level of 33.261 and a reconvened placement of a stop-loss beyond the range.
❤️Sending you lots of Love and Hugs❤️

SPY/QQQ Plan Your Trade For 5-20 : Harami-InsideToday's pattern suggests the SPY/QQQ will stay somewhat FLAT in trading.
In this video, I go over the SPY/QQQ, Gold/Silver, and BTCUSD.
What I find interesting in today's video is the setup in BTCUSD - being very similar to the peak in late 2021 before the double-top in Bitcoin.
If my analysis is correct, we are moving into a type of final speculative phase (bullish) that will quickly transition into a type of breakdown move in the US/Global markets.
Gold should do very well once this move sets up and begins to drive the Risk/Hedge trade.
In the meantime, sit back and wait for this speculative move to phase out (top).
Get some.
#trading #research #investing #tradingalgos #tradingsignals #cycles #fibonacci #elliotwave #modelingsystems #stocks #bitcoin #btcusd #cryptos #spy #gold #nq #investing #trading #spytrading #spymarket #tradingmarket #stockmarket #silver

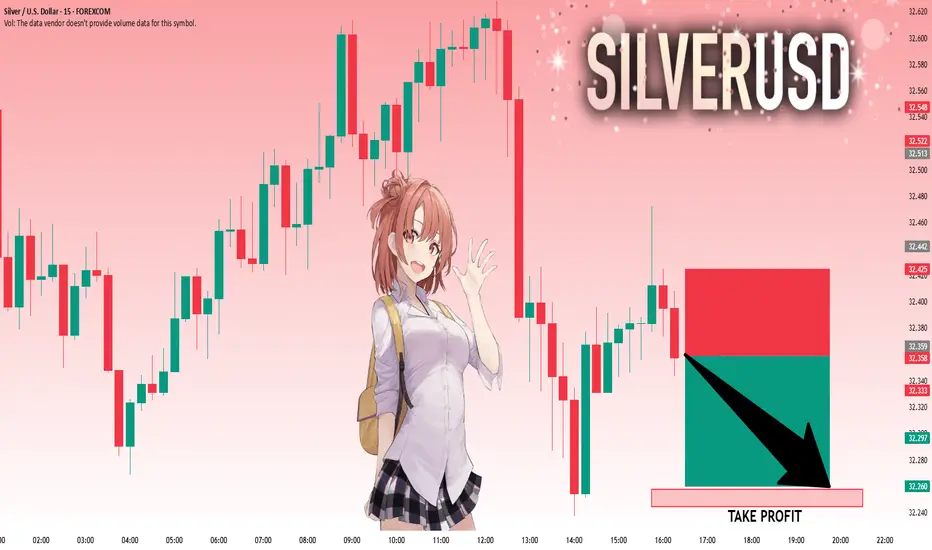
SILVER BEARS WILL DOMINATE THE MARKET|SHORT
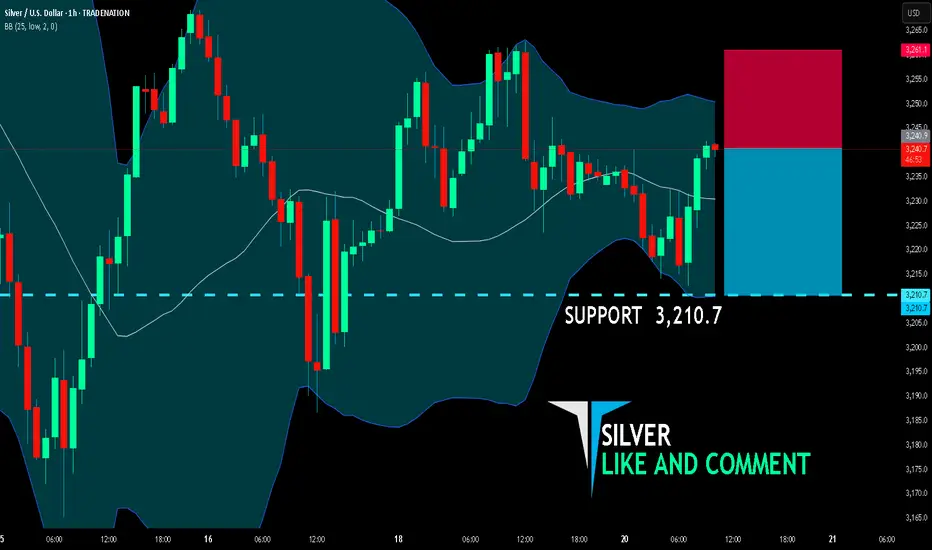
SILVER SIGNAL
Trade Direction: short
Entry Level: 3,240.9
Target Level: 3,210.7
Stop Loss: 3,261.1
RISK PROFILE
Risk level: medium
Suggested risk: 1%
Timeframe: 1h
Disclosure: I am part of Trade Nation's Influencer program and receive a monthly fee for using their TradingView charts in my analysis.
✅LIKE AND COMMENT MY IDEAS✅
Silver Holds Near $32.60 on CeasefireSilver hovered around $32.20 per ounce during Tuesday’s Asian session, easing for a third consecutive day as safe-haven demand faded. The hopes for a Russia-Ukraine ceasefire, announced by U.S. President Trump after a call with President Putin, tempered market uncertainty and weighed on silver’s appeal.
However, losses were limited following Moody’s downgrade of the U.S. credit rating and a series of weak economic data, including CPI, PPI, and retail sales. These reinforced expectations for two Fed rate cuts this year, likely starting in September, according to the CME FedWatch Tool projections.
Strong industrial demand, especially from the solar sector, continues to support silver’s longer-term outlook. Markets now look for upcoming Fed speeches for further direction.
XAG/USD faces resistance at $32.50, with higher levels at $33.80 and $34.20. Support is seen at $31.40, followed by $30.20 and $29.80.

Silver Outlook: Consolidation Continues Amid Tech and Haven HypeDespite Nasdaq's recent 400-point pullback from the 21,446 high, silver has extended its one-month consolidation, with momentum and price action suggesting the calm before the breakout.
The intersection of haven demand and renewed interest in tech-sector investments—particularly around AI—could reestablish silver as a preferred alternative asset.
From a daily time frame perspective, Silver is consolidating both in price and momentum. A decisive close above the $33 level could pave the way toward $33.70, $34.30, and $35.
On the downside, a break below $31.60 could trigger losses toward $31, $30.30, and $29.50.
Written by Razan Hilal, CMT
Silver INTRADAY sideways consolidation Key Support and Resistance Levels
Resistance Level 1: 3332
Resistance Level 2: 3365
Resistance Level 3: 3409
Support Level 1: 3188
Support Level 2: 3138
Support Level 3: 3090
This communication is for informational purposes only and should not be viewed as any form of recommendation as to a particular course of action or as investment advice. It is not intended as an offer or solicitation for the purchase or sale of any financial instrument or as an official confirmation of any transaction. Opinions, estimates and assumptions expressed herein are made as of the date of this communication and are subject to change without notice. This communication has been prepared based upon information, including market prices, data and other information, believed to be reliable; however, Trade Nation does not warrant its completeness or accuracy. All market prices and market data contained in or attached to this communication are indicative and subject to change without notice.

SILVER: Will Go Down! Short!
My dear friends,
Today we will analyse SILVER together☺️
The in-trend continuation seems likely as the current long-term trend appears to be strong, and price is holding below a key level of 32.359 So a bearish continuation seems plausible, targeting the next low. We should enter on confirmation, and place a stop-loss beyond the recent swing level.
❤️Sending you lots of Love and Hugs❤️
SILVER My Opinion! BUY!
My dear friends,
Please, find my technical outlook for SILVER below:
The instrument tests an important psychological level 32.284
Bias - Bullish
Technical Indicators: Supper Trend gives a precise Bullish signal, while Pivot Point HL predicts price changes and potential reversals in the market.
Target - 32.607
Recommended Stop Loss - 32.097
About Used Indicators:
Super-trend indicator is more useful in trending markets where there are clear uptrends and downtrends in price.
Disclosure: I am part of Trade Nation's Influencer program and receive a monthly fee for using their TradingView charts in my analysis.
———————————
WISH YOU ALL LUCK
SPY/QQQ Plan Your Trade For 5-19 : Gap Breakaway In Trend ModeToday's pattern suggests the SPY/QQQ will start with an opening price GAP (downward in this case) and could continue to move into a Breakaway pattern.
Given the recent news of a US Credit Downgrade, I'm suggesting all traders prepare for what may become a period of sideways price volatility over the next 3-5+ days.
I've highlighted a potential breakdown range on the SPY/QQQ on my charts that I believe acts as a solid confirmation level related to any potential reversal/breakdown in trend.
Currently, the trend is still BULLISH. If price falls below my breakdown range (the angled rectangle on my charts) - then I believe price will have broken this upward FLAGGING trend channel and will begin to move downward - targeting lower support levels.
This is a critical time for the markets. If we fail to move higher at these levels, we have a long way to go (downward) before we attempt to find any support.
Gold and Silver appear to be attempting to break the FLAG HIGH of an Inverted Excess Phase Peak pattern. This could prompt a strong rally phase back above $3300/$33 for Gold/Silver over the next few days. Time will tell how things play out.
BTCUSD appears to be REJECTING the recent highs within a consolidation range. If this rejection continues, I see BTCUSD moving downward - trying to reach the $95k (or lower) looking for support.
Remember, we are still generally BULLISH and moving upward within the FLAGGING channel. If we do get a breakdown in price over the next few days, it will become clearly evident on the charts and we'll have to begin to change our expectations.
Right now - HEDGE.
Get Some...
#trading #research #investing #tradingalgos #tradingsignals #cycles #fibonacci #elliotwave #modelingsystems #stocks #bitcoin #btcusd #cryptos #spy #gold #nq #investing #trading #spytrading #spymarket #tradingmarket #stockmarket #silver

BRIEFING Week #20 : ETH Reversed, WTI Next ?!Here's your weekly update ! Brought to you each weekend with years of track-record history..
Don't forget to hit the like/follow button if you feel like this post deserves it ;)
That's the best way to support me and help pushing this content to other users.
Kindly,
Phil

Can You Snatch Silver’s Profits? XAG/USD Stealth Trade Plan🔥Silver Snatch Strategy: XAG/USD Stealth Trade Plan🔥
👋 Greetings, Profit Pirates & Chart Ninjas! 🕵️♂️💸
Welcome to the Silver Snatch Strategy—a sly, calculated approach to raiding the XAG/USD market with finesse. This plan fuses razor-sharp technicals with real-time fundamentals to swipe profits from silver’s wild swings.
Let’s move like shadows, strike fast, and vanish with the gains! 🌑📈
📜 The Silver Snatch Blueprint
Entry Triggers 🔑:
🔼 Bullish Ambush: Enter on a breakout above the 50-period EMA at ~$34.20, signaling a potential rally.
🔽 Bearish Strike: Dive in on a breakdown below the 200-period EMA at ~$31.50, riding the downward momentum.
💡 Pro Tip: Use price alerts to catch these levels without glued eyes! 🔔
Stop Loss (SL) 🛡️:
🟢 Bullish Trade: Set SL at $31.90 (recent daily low, cushioning against wicks).
🔴 Bearish Trade: Place SL at $33.80 (daily high, guarding against fakeouts).
📉 Stay Flexible: Adjust SL based on your risk tolerance, lot size, and market volatility. This is your safety net!
Take Profit (TP) 💰:
🚀 Bullish Raiders: Target $36.50 (Fibonacci 61.8% retracement) or exit on fading volume.
🕳️ Bearish Thieves: Aim for $28.80 (key support zone) or slip out if momentum stalls.
🚪 Escape Tactic: Watch RSI for overbought (>70) or oversold (<30) signals to dodge reversals.
🌐 Why Trade XAG/USD Now?
Silver’s price action is a treasure chest of opportunity, driven by:
💵 USD Strength: The US dollar is flexing due to hawkish Fed signals and robust US economic data (e.g., Q1 2025 GDP growth at 2.8% annualized). A stronger USD typically pressures silver prices.
🕊️ Geopolitical Shifts: Easing US-China trade tensions reduce safe-haven demand for silver, tilting sentiment bearish.
🎲 Speculative Bets: Speculative net-short positions on silver are rising, with traders leaning against XAG/USD.
📊 Technical Edge: RSI (14-day) at 45 signals bearish momentum, while Fibonacci retracement levels highlight resistance at $34.50 and support at $31.00.
📈 Intermarket Dynamics: Rising US Treasury yields (10-year at 4.2%) and equity market optimism divert capital from non-yielding assets like silver.
📉 Silver’s recent dip to $31.60 (May 19, 2025) reflects these pressures, but a potential rebound looms if geopolitical risks flare up.
📊 Real-Time Sentiment Snapshot (May 19, 2025)
Retail Traders:
📈 Bullish: 38% 🌟 (Eyeing silver’s safe-haven appeal amid global uncertainty).
📉 Bearish: 48% ⚡ (Swayed by USD rally and trade deal optimism).
⚖️ Neutral: 14% 🧭 (Waiting for clearer signals).
Institutional Traders:
🏦 Bullish: 25% 🏦 (Hedging with silver for recession risks).
📉 Bearish: 65% 📉 (Favoring USD assets amid higher yields).
⚖️ Neutral: 10% ⚖️ (Monitoring Fed commentary).
💥 Why This Trade?
🔥 Volatility Goldmine: XAG/USD’s recent 3% daily ranges offer quick profit potential for agile traders.
📚 Data-Backed Setup: RSI, Fibonacci, and EMA alignments provide high-probability entry/exit points.
🌬️ Macro Tailwinds: USD strength and trade optimism create a clear bearish bias, with bullish setups as contingency plans.
🛡️ Risk Control: Tight SL and dynamic TP levels keep your capital safe while chasing 2:1 reward-to-risk ratios.
🗞️ News & Risk Management ⚠️
Silver is sensitive to sudden news spikes. Stay sharp:
⏰ Avoid Entries Pre-News: Skip trades 30 minutes before major releases (e.g., Fed speeches, US CPI data on May 20, 2025).
🔁 Trailing Stops: Lock in gains as price moves your way (e.g., trail SL by 50 pips on bullish trades).
🌪️ Volatility Play: Use smaller lot sizes during high-impact events to navigate choppy waters.
Join the Silver Snatch Squad!
👉 Click that Boost button to amplify this Silver Snatch Strategy and make it a TradingView legend! 🚀
Every like and share fuels our crew to drop more high-octane trade plans.
Let’s conquer XAG/USD together! 🤜🤛
Keep your charts locked, alerts primed, and trading spirit electric.
See you in the profit zone, ninjas!

Buyers Stand By And Be Ready! In this Weekly Market Forecast, we will analyze the S&P 500, NASDAQ, DOW JONES, Gold and Silver futures, for the week of May 18 - 24th.
The Stock Indices remain bullish. So buys are warranted for next week.
Gold and Silver pulled back last week on news of Trump's deals and sanction relief. But Gold is at support now. Watch for bullish setups for buys or a bearish market structure shift before seeking sells.
Crude Oil is near buy side liquidity. Look for short term buys before a longer term, high probability sell setup to form.
Enjoy!
May profits be upon you.
Leave any questions or comments in the comment section.
I appreciate any feedback from my viewers!
Like and/or subscribe if you want more accurate analysis.
Thank you so much!
Disclaimer:
I do not provide personal investment advice and I am not a qualified licensed investment advisor.
All information found here, including any ideas, opinions, views, predictions, forecasts, commentaries, suggestions, expressed or implied herein, are for informational, entertainment or educational purposes only and should not be construed as personal investment advice. While the information provided is believed to be accurate, it may include errors or inaccuracies.
I will not and cannot be held liable for any actions you take as a result of anything you read here.
Conduct your own due diligence, or consult a licensed financial advisor or broker before making any and all investment decisions. Any investments, trades, speculations, or decisions made on the basis of any information found on this channel, expressed or implied herein, are committed at your own risk, financial or otherwise.

SILVER: Long Trade with Entry/SL/TP
SILVER
- Classic bullish setup
- Our team expects bullish continuation
SUGGESTED TRADE:
Swing Trade
Long SILVER
Entry Point - 32.284
Stop Loss - 32.071
Take Profit - 32.675
Our Risk - 1%
Start protection of your profits from lower levels
Disclosure: I am part of Trade Nation's Influencer program and receive a monthly fee for using their TradingView charts in my analysis.
❤️ Please, support our work with like & comment! ❤️

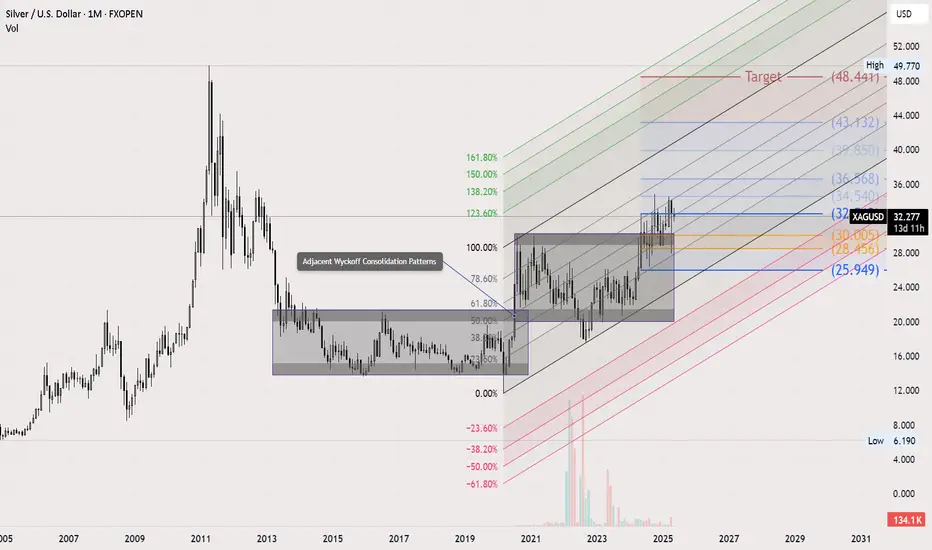
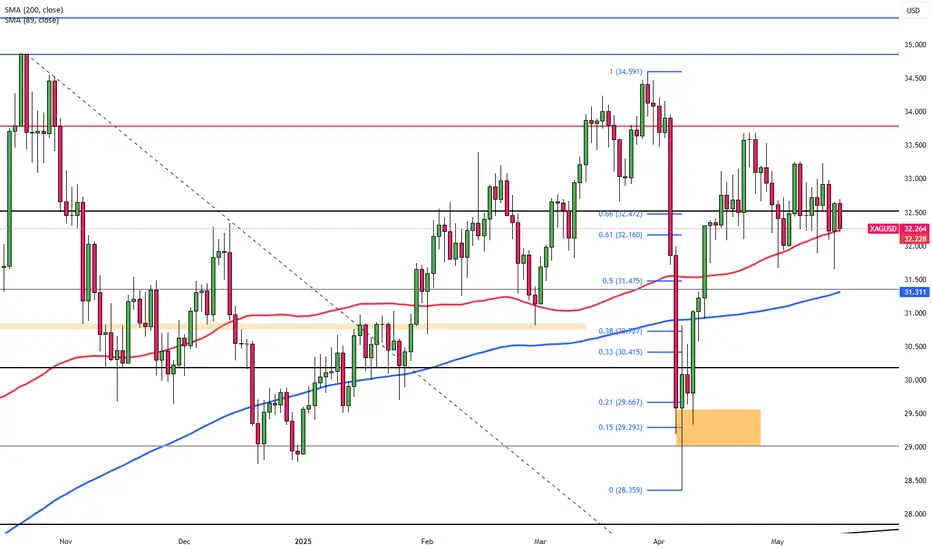
Silver Long-Term Outlook: Wyckoff, Fibonacci & Volunacci in PlayOn the monthly chart, Silver is showing a strong setup for long-term investors. We can clearly identify two adjacent Wyckoff accumulation patterns, signaling institutional accumulation phases.
Price action is following an ascending Fibonacci channel, reflecting a steady bullish structure. After breaking out of the second Wyckoff pattern, a Volunacci projection has formed—pointing toward a potential move to retest its historical high near $48.
This alignment of classic technical patterns with volume-based projection tools strengthens the long-term bullish case for Silver.
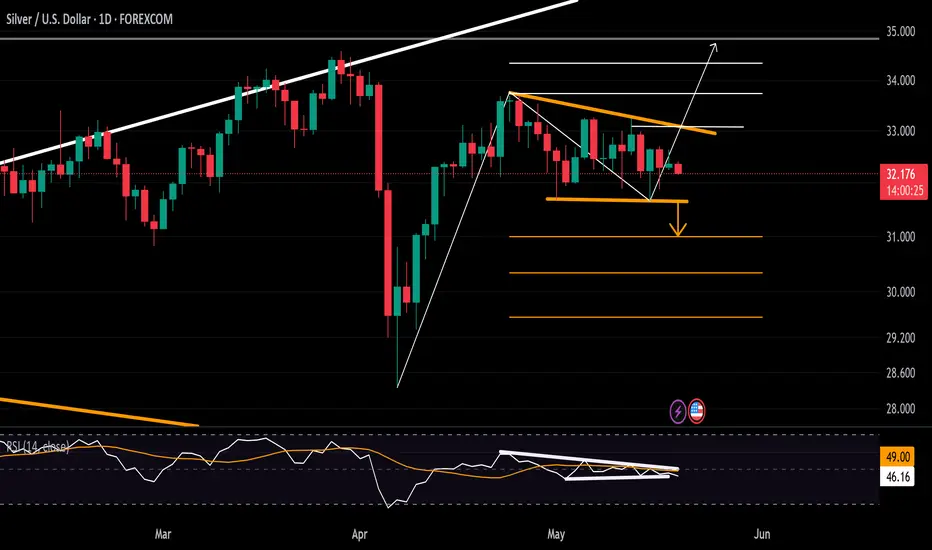
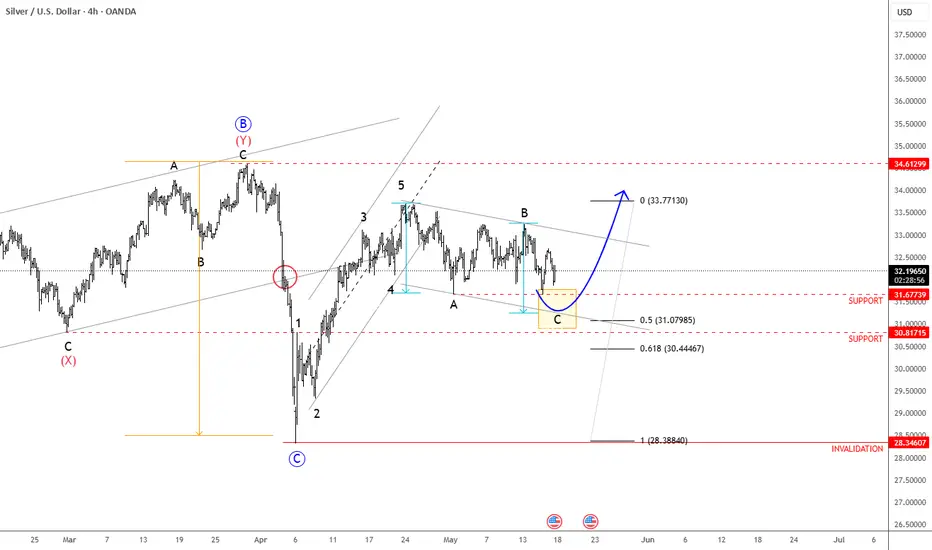
Silver Finds Its Footing—Are the Bulls Back? (Elliott Waves)Silver rebounded quite aggressively in April, following Trump’s decision to impose a 90-day tariff pause. At the time, there was still a lot of uncertainty, so many investors turned to metals as a safe haven—particularly during periods of trade tensions.
More importantly, we can see silver forming five waves up from the 28.34 low. In Elliott Wave terms, when we see a strong directional move that can be counted in five waves, it often represents the beginning of a new trend. That means the current pause is likely just a correction, and more upside should follow.
The 31.00–31.50 area is a very interesting support zone for silver—an area from which we could see a rebound, possibly after a completed A-B-C setback from the 33.70 region.
SILVER: Target Is Down! Short!
My dear friends,
Today we will analyse SILVER together☺️
The market is at an inflection zone and price has now reached an area around 32.131 where previous reversals or breakouts have occurred.And a price reaction that we are seeing on multiple timeframes here could signal the next move down so we can enter on confirmation, and target the next key level of 31.954.Stop-loss is recommended beyond the inflection zone.
❤️Sending you lots of Love and Hugs❤️

SPY/QQQ Plan Your Trade For 5-16 : Gap Potential PatternToday's pattern suggests the SPY will attempt to GAP at the open. The current price structure suggests the SPY/QQQ are in an upward FLAGGING formation related to a broad Excess Phase Peak pattern. I believe this upward trend will continue until price attempts to break either the upper previous Ultimate High pattern or break the lower channel of the current FLAGGING formation.
The wonderful thing about these Excess Phase Peak patterns, and other techniques I'm trying to teach you, is that they provide very clear triggers/directions/opportunities for traders who understand these patterns.
Today, I highlight my SPY Bias (Primary & Secondary) trending system that shows the SPY is much weaker than many people believe. Because of this, I believe we are potentially nearing an Exhaustion Peak in the SPY/QQQ - time will tell.
The use of my extended Biasing systems and Custom Index charts helps me understand what is taking place behind the SPY/QQQ price action. It's like peaking behind the curtains in terms of what my Custom Indexes and other specialized data can provide. I can see what is really taking place related to price action - moving beyond the simple SPY/QQQ charts.
Gold and Silver appear to be setting up an Inverted Excess Phase Peak pattern off a potential Ultimate Low in price. It will be interesting to see how this downward price flag plays out over the next week+. If this pattern holds, we should see the FLAG end and price should rally up into the consolidation phase. Very exciting for metals.
Bitcoin, which tends to lead the SPY/QQQ, is stalling near a peak. Keep your eyes on BTCUSD over the weekend as I believe we may be able to identify how the SPY/QQQ will react on Monday by watching what BTCUSD does.
Thanks for being patient and understanding my schedule over the past 30+ days. I've had multiple family member visit the hospital over the past 5-6+ weeks and my world has been filled with doctors, hospitals, follow-ups, work, and trying to keep everyone healthy and away from trouble.
It appears these issues are starting to get more settled - which means I'll be able to stay more focused on work - instead of driving around everywhere and waiting for appointments.
Get some..
#trading #research #investing #tradingalgos #tradingsignals #cycles #fibonacci #elliotwave #modelingsystems #stocks #bitcoin #btcusd #cryptos #spy #gold #nq #investing #trading #spytrading #spymarket #tradingmarket #stockmarket #silver

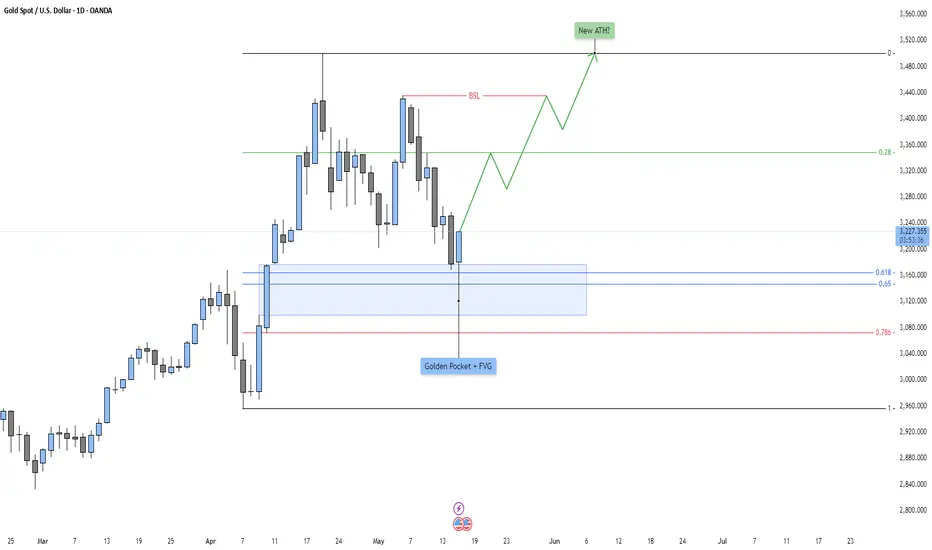
Gold - New ATH in the making?Overall Market Context
This daily timeframe chart of Gold (XAU/USD) reflects a textbook example of a bullish retracement within a broader upward trend. The price has recently pulled back after printing a significant swing high, which is currently the all-time high (ATH). This retracement brings Gold into a high-probability reversal zone, aligning several technical elements that point toward potential bullish continuation.
Retracement Into A Confluence Zone
Price has retraced into a key technical area defined by the Fibonacci golden pocket (0.618–0.65) and a Fair Value Gap (FVG). The golden pocket is widely regarded as one of the most reactive retracement levels in Fibonacci analysis, where institutional participants often enter or scale into positions. The addition of an FVG overlapping this zone strengthens its importance. An FVG is typically created by an aggressive move that leaves behind inefficient price action or unmitigated imbalances, and in this case, it represents an area where demand previously overwhelmed supply.
The combination of the golden pocket and FVG creates a strong demand zone, from which a bullish reaction is expected if the overall macro sentiment remains supportive.
Bullish Reaction And Confirmation
Price wicked slightly below the FVG, likely triggering liquidity stops resting beneath prior swing lows before showing signs of a strong bounce. This type of price action—known as a liquidity grab or "spring"—is often a precursor to significant reversals when it aligns with higher timeframe bullish order flow.
The current bounce from this zone suggests that smart money may have accumulated long positions here. If price continues to hold above this zone, it confirms a successful defense of this key area and increases the probability of bullish continuation. The market is showing signs of shifting from a retracement phase back into an impulsive phase.
Break Of Structure And Targeting Buy-Side Liquidity
The next key area of interest is the buy-side liquidity resting above the most recent swing high, labeled as the "BSL" (Buy-Side Liquidity). If price breaches this level, it will confirm a break of market structure to the upside and signal a continuation of the overall bullish trend.
Such a break would invalidate the idea of deeper retracement and instead align with an impulsive leg that could target the previous ATH—and potentially exceed it. This makes the current zone a critical pivot point in determining whether gold resumes its long-term bullish trajectory.
New All-Time High Scenario
Should the BSL be breached and momentum maintained, price is likely to head toward printing a new all-time high. From a psychological and technical standpoint, the break of an ATH often leads to price discovery, where resistance is minimal, and price action becomes more volatile and parabolic.
Traders and institutions monitoring historical highs often front-run such moves or aggressively participate once confirmed, driving increased volume and volatility. This behavior can lead to rapid upside extension, especially when supported by macroeconomic narratives such as inflation hedging, geopolitical tensions, or declining real yields—all traditionally bullish catalysts for gold.
Silver Retreats on Semiconductor TensionsSilver pulled back to around $32.50 in Friday’s Asian session, giving up part of its recent gains following reports that the U.S. plans to blacklist several Chinese semiconductor firms. Given silver’s integral role in electronics and chip manufacturing, the news weighed on sentiment.
Demand for precious metals has also weakened with easing trade tensions, as the U.S. and China agreed to reduce tariffs, cutting U.S. duties from 145% to 30% and China’s from 125% to 10%. Despite this, silver found support from a weakening U.S. dollar, which followed soft economic data reinforcing expectations for Federal Reserve rate cuts. Powell, however, warned that persistent supply shocks could complicate inflation control moving forward.
Resistance begins at $32.50, with further levels at $33.80 and $34.20. Support is seen at $31.40, followed by $30.20 and $29.80.
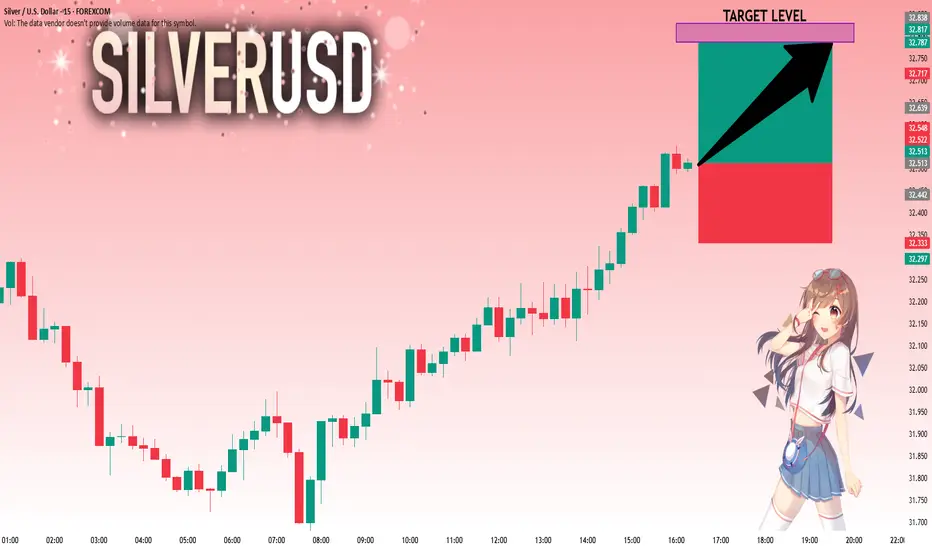
SILVER: Strong Growth Ahead! Long!
My dear friends,
Today we will analyse SILVER together☺️
The recent price action suggests a shift in mid-term momentum. A break above the current local range around 32.513 will confirm the new direction upwards with the target being the next key level of 32.783 and a reconvened placement of a stop-loss beyond the range.
❤️Sending you lots of Love and Hugs❤️
SPY/QQQ Plan Your Trade For 5-15 : CRUSH PatternToday's CRUSH pattern could play out as a very big downward price move if the 578-580 level is broken. CRUSH patterns are usually very large-range price bars. Yes, they can be to the upside as well (depending on recent trending).
A CRUSH pattern is usually in the opposite direction of recent trends. Thus, I believe today's CRUSH pattern will be to the downside.
Although I believe today could be very exciting for traders, I urge all traders move with caution in the early 30min to 60min of trading today. I believe the SPY/QQQ will attempt to establish a range (early trading range), then work to break away from that range.
Traders should be very cautious of getting married into a direction/position in early trading. Let the market tell you where it wants to go.
Gold and Silver appear to have setup the Ultimate Low overnight. Now, we'll see if metals can move higher throughout the rest of this week and build a base for the next phase higher.
BTCUSD seems to have started to roll over (top), but I urge traders to stay cautious of the current upward FLAGGING trend. Until BTCUSD breaks below $96-97k, I would still consider it to be trending upward.
Going to be a busy day for me. Stay safe as I'll be on the road most of the morning.
GET SOME.
#trading #research #investing #tradingalgos #tradingsignals #cycles #fibonacci #elliotwave #modelingsystems #stocks #bitcoin #btcusd #cryptos #spy #gold #nq #investing #trading #spytrading #spymarket #tradingmarket #stockmarket #silver
