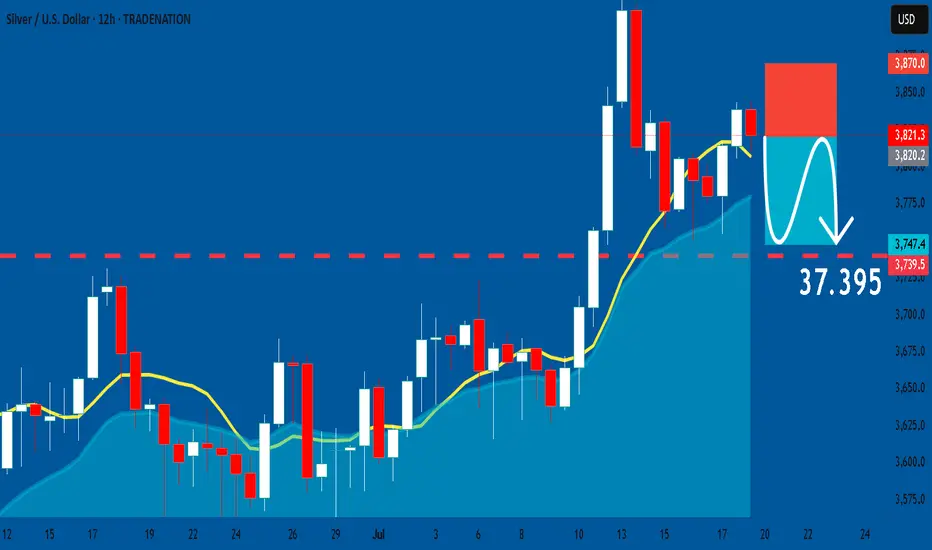
SILVER Is Going Down! Short!
Here is our detailed technical review for SILVER.
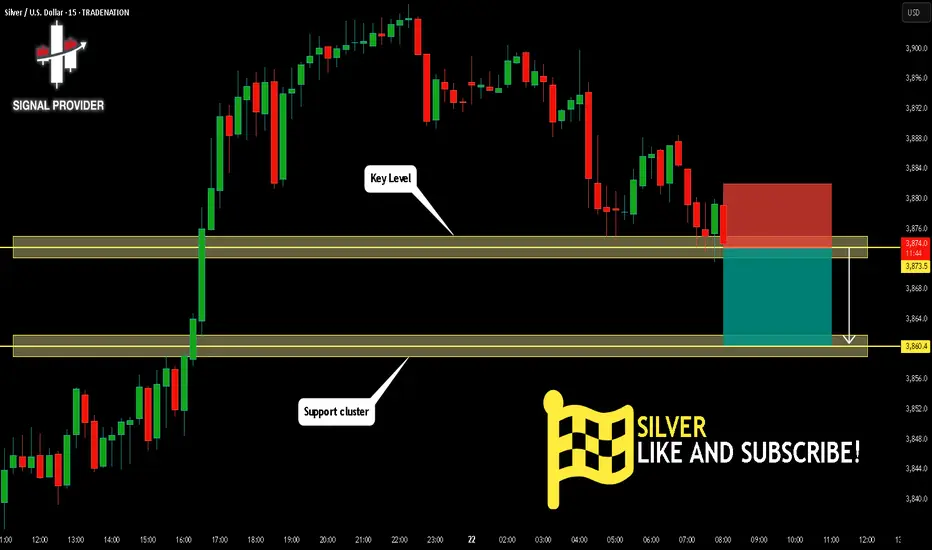
Time Frame: 15m
Current Trend: Bearish
Sentiment: Overbought (based on 7-period RSI)
Forecast: Bearish
The market is on a crucial zone of supply 3,873.5.
The above-mentioned technicals clearly indicate the dominance of sellers on the market. I recommend shorting the instrument, aiming at 3,860.4 level.
P.S
We determine oversold/overbought condition with RSI indicator.
When it drops below 30 - the market is considered to be oversold.
When it bounces above 70 - the market is considered to be overbought.
Disclosure: I am part of Trade Nation's Influencer program and receive a monthly fee for using their TradingView charts in my analysis.
Like and subscribe and comment my ideas if you enjoy them!
Silver
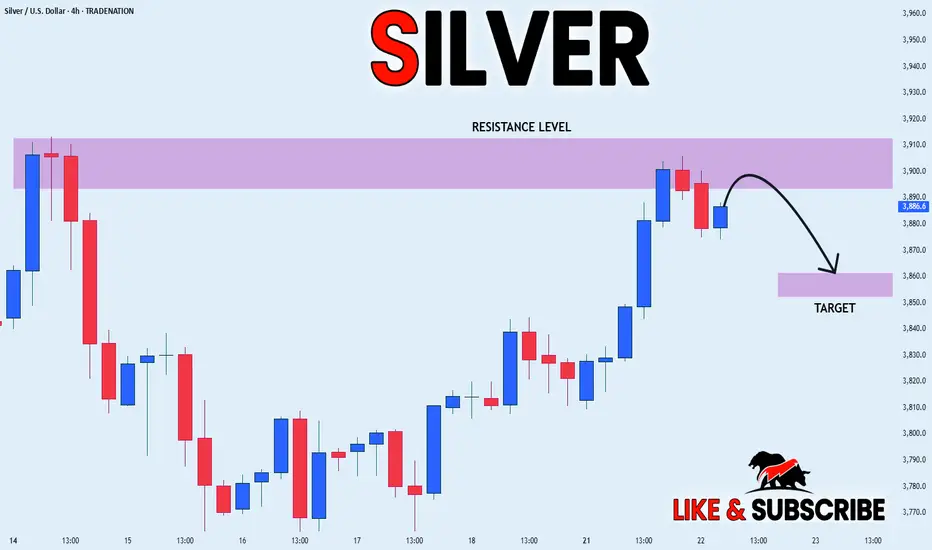
SILVER LOCAL SHORT|
✅SILVER has retested a key resistance level of 39.10$
And as the pair is already making a bearish pullback
A move down to retest the demand level below at 38.61$ is likely
SHORT🔥
✅Like and subscribe to never miss a new idea!✅
Disclosure: I am part of Trade Nation's Influencer program and receive a monthly fee for using their TradingView charts in my analysis.
July 21 Special Update : Metals, SPY & More. What's Next.This special update is to highlight why I continue to believe traders should stay very cautious of this rally in the SPY/QQQ/BTCUSD.
Underlying economic data suggest that this is one big speculative rally following the April Tariff collapse.
And, the economic data I see from my custom indexes suggests the markets are moving into a very volatile and potentially dangerous topping pattern.
As I've stated many times in this video. I'm not saying the markets have topped and you should SELL EVERYTHING. I'm suggesting this market is extremely over-valued in terms of the underlying risk factors at play and the very clear data that suggests the markets are already in a recessionary price trend.
You may ask, "How can the markets continue to rally like this in a moderate recession?".
The answer is simple.
All bubbles end with a super-speculative phase. This phase is where everyone piles into a euphoric attempt to ride the rally higher.
It happened in the late 1990s. It has happened again through the 2000-2005+ housing bubble. Heck, it has occurred in the collectors market over the past few decades where people spent fortunes on the "hottest items" (think Beanie-Babies) only to find out they bought at the height of the bubble.
That is why I continue to urge traders to remain cautious and to withdraw profits from this speculative rally phase. Protect your investment capital immediately and consider the risks associated with the information I share in this video.
I'm not trying to scare anyone. I'm just trying to be realistic in terms of what I see in my data and why I believe now is the best time to MOVE TO SAFETY.
My data suggests that the markets are about to enter a fragile and potentially dangerous pullback phase. If you want to ride it out - go for it.
Otherwise, prepare for significant volatility over the next six months or more.
Get some.
#trading #research #investing #tradingalgos #tradingsignals #cycles #fibonacci #elliotwave #modelingsystems #stocks #bitcoin #btcusd #cryptos #spy #gold #nq #investing #trading #spytrading #spymarket #tradingmarket #stockmarket #silver

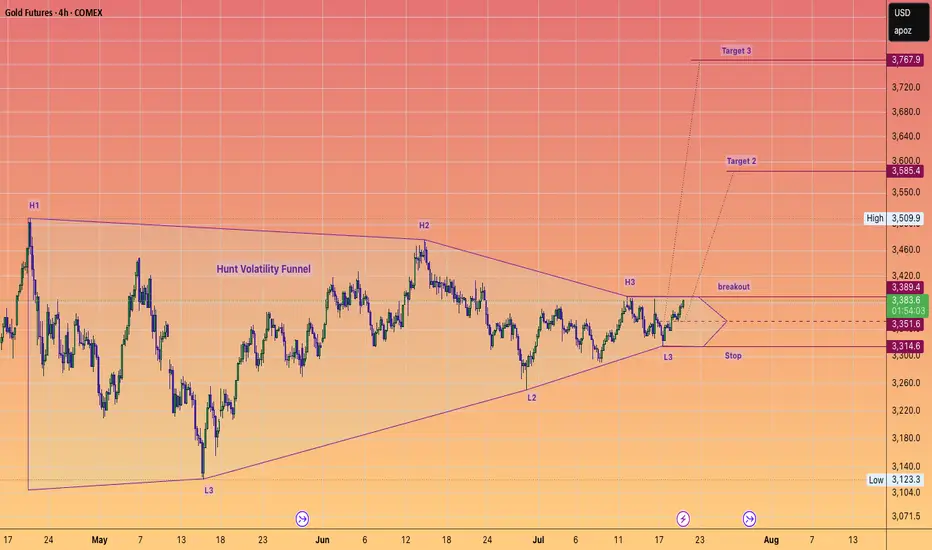
Trade Alert! GOLD to $3800 SOON.#HuntVolatilityFunnel setup which is about to trigger to the upside.
This setup should take gold to or very close to $4K IMHO
#GC
#GOLD
#SILVER
#METALS
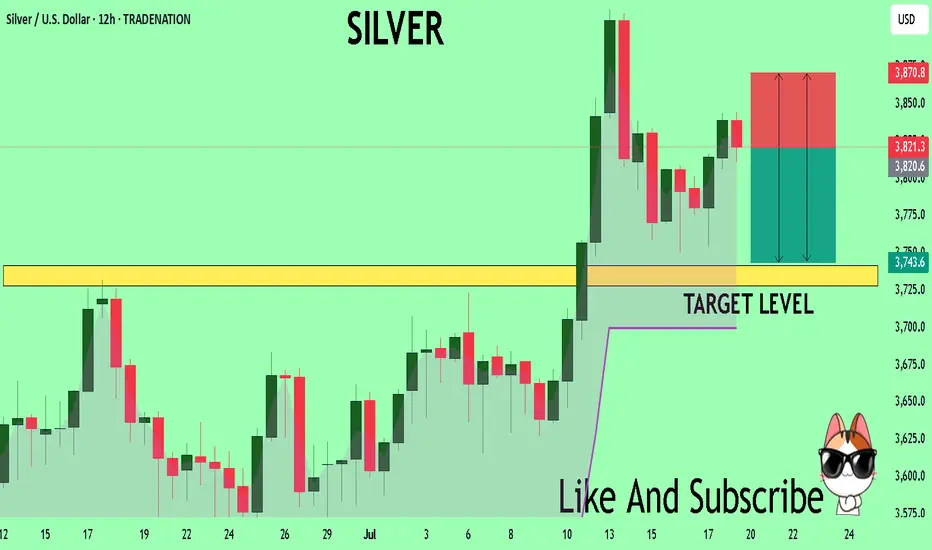
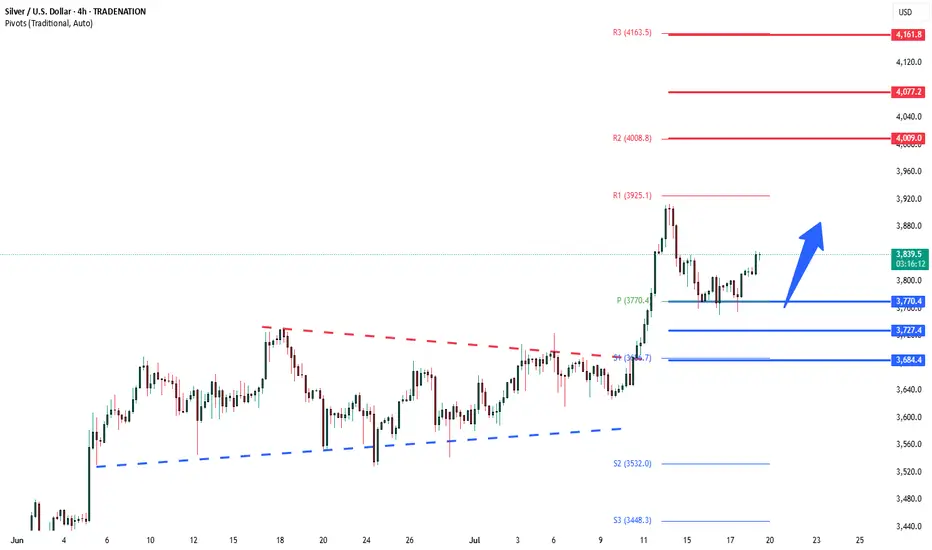
Silver Bullish continuation breakout supported at 3686The Silver remains in a bullish trend, with recent price action showing signs of a continuation breakout within the broader uptrend.
Support Zone: 3686 – a key level from previous consolidation. Price is currently testing or approaching this level.
A bullish rebound from 3686 would confirm ongoing upside momentum, with potential targets at:
3814 – initial resistance
3865 – psychological and structural level
3920 – extended resistance on the longer-term chart
Bearish Scenario:
A confirmed break and daily close below 3686 would weaken the bullish outlook and suggest deeper downside risk toward:
3645 – minor support
3590 – stronger support and potential demand zone
Outlook:
Bullish bias remains intact while the Silver holds above 3686. A sustained break below this level could shift momentum to the downside in the short term.
This communication is for informational purposes only and should not be viewed as any form of recommendation as to a particular course of action or as investment advice. It is not intended as an offer or solicitation for the purchase or sale of any financial instrument or as an official confirmation of any transaction. Opinions, estimates and assumptions expressed herein are made as of the date of this communication and are subject to change without notice. This communication has been prepared based upon information, including market prices, data and other information, believed to be reliable; however, Trade Nation does not warrant its completeness or accuracy. All market prices and market data contained in or attached to this communication are indicative and subject to change without notice.

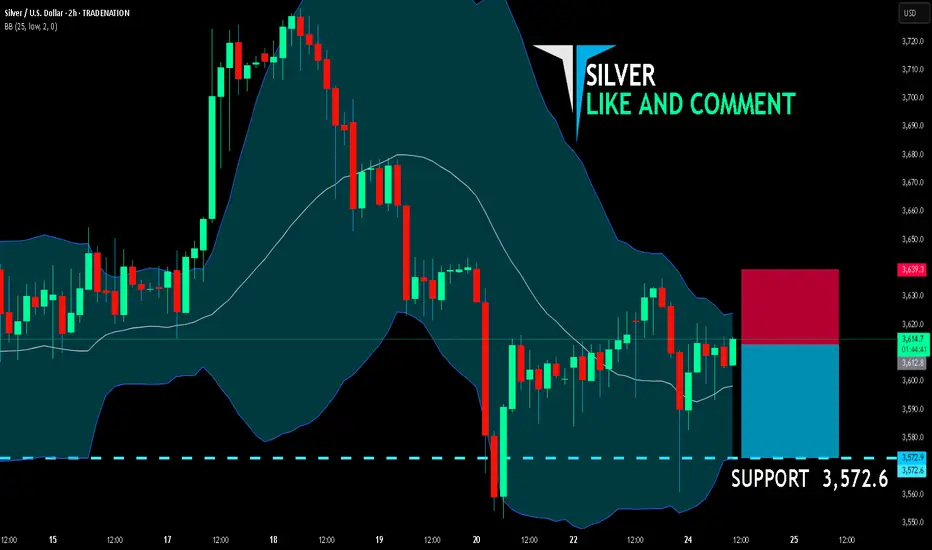
SILVER SELLERS WILL DOMINATE THE MARKET|SHORT
SILVER SIGNAL
Trade Direction: short
Entry Level: 3,612.8
Target Level: 3,572.6
Stop Loss: 3,639.3
RISK PROFILE
Risk level: medium
Suggested risk: 1%
Timeframe: 2h
Disclosure: I am part of Trade Nation's Influencer program and receive a monthly fee for using their TradingView charts in my analysis.
✅LIKE AND COMMENT MY IDEAS✅
Natural Gas | Oil | Dollar | Silver | Gold Price Forecast.Natural Gas | Oil | Dollar | Silver | Gold Price Forecast.
NYMEX:NG1! AMEX:UNG NYMEX:CL1! COMEX:GC1!

SILVER ( XAGUSD ): Still Bullish! Take The Buy Setups!In this Weekly Market Forecast, we will analyze the XAGUSD (SILVER) for the week of July 21-25th.
Silver remains a Strong Buy rating. There is no technical reason to look for shorts. Only buys right now, until we see a bearish break of structure. Then sells can be considered.
That having been said, like Gold, there is a 4H +FVG that we are watching. If it holds, higher prices will ensue. If it fails, the lows become the draw on liquidity.
We'll soon see how it plays out.
Enjoy!
May profits be upon you.
Leave any questions or comments in the comment section.
I appreciate any feedback from my viewers!
Like and/or subscribe if you want more accurate analysis.
Thank you so much!
Disclaimer:
I do not provide personal investment advice and I am not a qualified licensed investment advisor.
All information found here, including any ideas, opinions, views, predictions, forecasts, commentaries, suggestions, expressed or implied herein, are for informational, entertainment or educational purposes only and should not be construed as personal investment advice. While the information provided is believed to be accurate, it may include errors or inaccuracies.
I will not and cannot be held liable for any actions you take as a result of anything you read here.
Conduct your own due diligence, or consult a licensed financial advisor or broker before making any and all investment decisions. Any investments, trades, speculations, or decisions made on the basis of any information found on this channel, expressed or implied herein, are committed at your own risk, financial or otherwise.

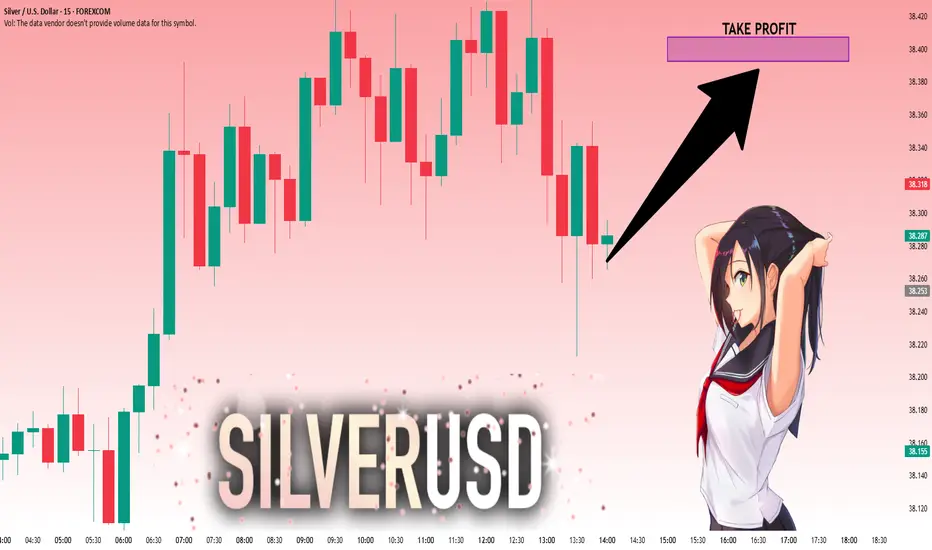
SILVER: Short Trade with Entry/SL/TP
SILVER
- Classic bearish setup
- Our team expects bearish continuation
SUGGESTED TRADE:
Swing Trade
Short SILVER
Entry Point - 38.213
Stop Loss - 38.700
Take Profit - 37.395
Our Risk - 1%
Start protection of your profits from lower levels
Disclosure: I am part of Trade Nation's Influencer program and receive a monthly fee for using their TradingView charts in my analysis.
❤️ Please, support our work with like & comment! ❤️
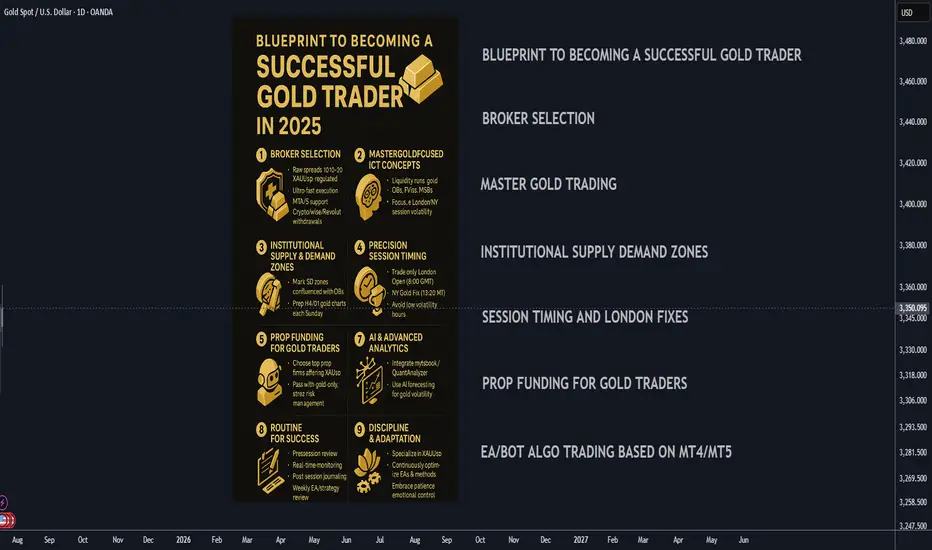
Blueprint to Becoming a Successful Gold Trader in 2025🚀 Blueprint to Becoming a Successful Gold Trader in 2025
A strategic, step-by-step plan to master gold trading by combining institutional concepts, cutting-edge automation, and the best prop funding opportunities for XAUUSD.
________________________________________
🏦 Broker Selection (Gold-Specific)
• 🔍 Choose Brokers Offering Raw Spread XAUUSD Accounts:
Seek brokers with raw/zero spread gold trading or tight gold spreads (0.10-0.30 average) with deep liquidity.
• ⚡ Prioritize Ultra-Fast Execution for Metals:
Confirm broker servers are in NY4/LD4 and latency is optimized for gold volatility spikes.
• 🛡️ Verify Regulation & Execution:
ASIC, FCA, FSCA preferred; check for proof of XAUUSD execution quality (Myfxbook/FXBlue verified).
• 📊 MetaTrader 4/5 Gold Support:
Ensure MT4/5 platform offers tick-chart precision for gold and supports custom EAs/indicators.
• 💳 Flexible Withdrawals/Payouts:
Crypto, Wise, and Revolut compatibility for fast, secure funding.
________________________________________
🎯 Gold Trading Strategy (ICT + Supply/Demand Zones)
• 🧠 Master Gold-Adapted ICT Concepts:
o Liquidity runs and stops at London/NY session highs/lows
o XAUUSD-specific Order Blocks (OBs), FVGs, and Market Structure Breaks (MSB)
• 📍 Map Institutional Supply-Demand Zones:
Gold reacts violently to these—align SD zones with ICT Order Blocks for best confluence.
• 📐 Precision Entries:
Only enter after liquidity sweeps at key XAUUSD levels (H4/D1), avoiding choppy retail entries.
• 📈 Time & Price for XAUUSD:
Focus exclusively on London Open (8:00 GMT) and NY Open/Gold Fixing (13:20 GMT)—peak volatility windows.
• 📆 Weekly Preparation:
Annotate D1/H4 gold charts every Sunday with clear OBs, liquidity points, and SD zones for the week.
________________________________________
💰 Prop Funding for Gold Trading
• 🥇 Select Firms Offering XAUUSD with Tight Rules:
Choose FTMO, The Funded Trader, MyFundedFX, or similar with high leverage and XAUUSD trading enabled.
• 📑 Pass Evaluation with Gold-Only Strategy:
Use high-probability, low-frequency XAUUSD trades—1-3 setups per week, strict risk parameters.
• 🎯 Risk Management:
Max 1% risk/trade, stop trading after 2 consecutive losses—protect account and pass evaluations.
• 📊 Analytics Monitoring:
Use prop dashboards (FTMO Metrics, FundedNext stats) to review XAUUSD trade stats and adjust.
• 📚 Diversify Funded Accounts:
Split funded capital among multiple firms to hedge against firm-specific risk and maximize payouts.
________________________________________
⚙️ Automating Gold Trading (MT4/5 EAs & Bots)
• 🛠️ Hire MQL4/5 Developers for XAUUSD EAs:
Code bots focused on gold-specific ICT (OBs, FVGs, London/NY volatility).
• 🤖 Develop EAs for Gold:
o OB/FVG/Market Structure detection on XAUUSD
o Supply/Demand zone algo entries
o Gold breakout EAs for session openings
• 📌 Trade Management Automation:
o Entry, stop loss, partial TP, BE, trailing for gold’s high volatility
o Dynamic lot-sizing by daily ATR
• 📡 VPS Hosting Near Broker’s Gold Server:
Use NY4/LD4 VPS for lowest latency (ForexVPS, Beeks).
• 📈 Quarterly Forward-Testing:
Optimize EAs in demo before live trading, retest on every major gold volatility shift (FOMC, CPI).
________________________________________
📲 Leveraging Bots & AI in 2025
• 📊 Integrate with MT4/5 Analytics Tools:
Use myfxbook, QuantAnalyzer for detailed gold trade breakdowns.
• 🔮 AI-Based Gold Forecasting:
Layer in machine learning models (e.g., TensorTrade, TradingView AI) to anticipate session volatility and direction.
• 🔔 Real-Time Alert Bots:
Set up Telegram/Discord bots for instant notification of ICT-based XAUUSD signals.
• 🧑💻 Manual Oversight:
Always review high-impact news (NFP, CPI, FOMC) and override automation when macro risk spikes.
• 🔄 Continuous Bot Updates:
Retrain your EAs monthly on latest XAUUSD price action to maintain edge.
________________________________________
🗓️ Daily Gold Trader Routine
• 🌅 Pre-Session (30 mins):
Review annotated gold charts, key session highs/lows, OB/FVG/SD levels, and upcoming news.
• 💻 During Session:
Monitor bot execution, validate setups manually, manage risk during NY/London overlap.
• 📝 Post-Session (15 mins):
Journal gold trades, note reasoning for entry/exit, emotional state, and lessons learned.
• 📆 Weekly Review:
Assess overall gold trading stats and EA performance, adjust strategy as needed.
• 📚 Continuous Learning:
Stay updated on ICT, gold market fundamentals, and new trading tech.
________________________________________
📌 Final Success Advice for 2025
• 🔍 Specialize in XAUUSD/Gold—Don’t Diversify Randomly:
Depth > Breadth—become a true gold trading expert.
• 🚩 Keep Adapting Your Gold Trading EAs:
Markets change—so must your bots and playbooks.
• 🧘 Stay Patient, Disciplined, and Selective:
Gold rewards precision and patience, not overtrading.
• 💡 Embrace AI & Automation:
Leverage every tool: AI, analytics, and custom EAs for a real 2025 trading edge.
SILVER Massive Short! SELL!
My dear subscribers,
SILVER looks like it will make a good move, and here are the details:
The market is trading on 38.213 pivot level.
Bias - Bearish
My Stop Loss - 38.708
Technical Indicators: Both Super Trend & Pivot HL indicate a highly probable Bearish continuation.
Target - 37.413
About Used Indicators:
The average true range (ATR) plays an important role in 'Supertrend' as the indicator uses ATR to calculate its value. The ATR indicator signals the degree of price volatility.
Disclosure: I am part of Trade Nation's Influencer program and receive a monthly fee for using their TradingView charts in my analysis.
———————————
WISH YOU ALL LUCK
Bear-Trap armed: Gold ticks 4 / 5 boxes - waiting for the spark1️⃣ Why the 2020 déjà-vu is EVEN louder
2025 (now) 2020 (pre-rally)
TradingView ideas still bearish 💬
> 70 % 60 % bearish
Managed-money net-longs ≈ 115 k
-35 % from Apr. –25 % from peak
+ $741 m PM-ETF inflow Record IN-flows
G/S ratio 87 (< 90) Fell to 95
S&P keeps making highs Ditto
2️⃣ What’s still different
Real 10-y TIPS yield +0.7 % vs -1 % in 2020 → smaller monetary tail-wind.
Gold is already at an infl-adj. record – expect a short & sharp squeeze, not a fresh multi-year super-cycle (yet).
3️⃣ Checklist – updated
Signal Status 18 Jul Comment
———————————————————
Gold DAILY close ≥ $3 200–3 250 YES – $3 354 ✔
G/S ratio < 90 YES – 87 ✔
CFTC net-longs < 150 k YES – ~115 k ✔
ETF flows turn positive. YES – $741 m ✔
Equity stress (VIX > 25 or SPX −5 %) NOT YET – VIX 16.5 ✖
4 / 5 boxes = 99 % primed. One spark missing.
4️⃣ What could light the fuse
Date Potential trigger Why it matters
22 Jul Mega-tech Q2 earnings (NVDA/AMD) Any guidance miss → SPX wobble
30 Jul FOMC Fed holds but sounds dovish USD dump + yield spike risk
1 Aug Trump s “reciprocal” duties Imported-inflation scare → VIX pop
Early Aug. DXY crashes < 96 in < 5 days. Disorderly USD slide = funding stress
Hit ≥ 2 of: DXY < 96, VIX > 25, SPX -5 % or HY-spread +75 bp → final ✔.
Bottom line
The bear-trap thesis aged well: sentiment, positioning, ETFs, and G/S ratio have already clicked bullish.
Only equity-market stress is missing. A fast USD slide or a tariff shock right after a neutral Fed is the most likely detonator.
Stay nimble: Collect premium inside $3 250-3 400 while volatility sleeps – but keep alarms on VIX 25 and DXY 96. One red headline could still launch the squeeze.
Disclaimer: Educational opinion, not investment advice. Futures & CFD trading is risky – do your own research and consult a professional.
1 minute ago

SILVER: Strong Bullish Sentiment! Long!
My dear friends,
Today we will analyse SILVER together☺️
The in-trend continuation seems likely as the current long-term trend appears to be strong, and price is holding above a key level of 38.281 So a bullish continuation seems plausible, targeting the next high. We should enter on confirmation, and place a stop-loss beyond the recent swing level.
❤️Sending you lots of Love and Hugs❤️
Bear-Trap armed: Gold ticks 4 / 5 boxes - waiting for the spark
1️⃣ Why the 2020 déjà-vu is EVEN louder
2025 (now) 2020 (pre-rally)
TradingView ideas still bearish 💬
> 70 % 60 % bearish
Managed-money net-longs ≈ 115 k
(-35 % from Apr) –25 % from peak
+ $741 m PM-ETF inflow, first after months Record IN-flows
G/S ratio 87 (< 90) Fell to 95
S&P keeps making highs. Ditto
2️⃣ What’s still different
Real 10-y TIPS yield +0.7 % vs -1 % in 2020 → smaller monetary tail-wind.
Gold is already at an infl-adj. record – expect a short & sharp squeeze, not a fresh multi-year super-cycle (yet).
3️⃣ Checklist – updated
Signal Status 18 Jul Comment
———————————————————
Gold DAILY close ≥ $3 200–3 250 YES – $3 354 ✔
G/S ratio < 90 YES – 87 ✔
CFTC net-longs < 150 k YES – ~115 k ✔
ETF flows turn positive. YES – $741 m ✔
Equity stress (VIX > 25 or SPX −5 %) NOT YET – VIX 16.5 ✖
4 / 5 boxes = 99 % primed. One spark missing.
4️⃣ What could light the fuse
Date Potential trigger Why it matters
22 Jul Mega-tech Q2 earnings (NVDA/AMD) Any guidance miss → SPX wobble
30 Jul FOMC Fed holds but sounds dovish USD dump + yield spike risk
1 Aug Trump s “reciprocal” duties Imported-inflation scare → VIX pop
Early Aug. DXY crashes < 96 in < 5 days. Disorderly USD slide = funding stress
Hit ≥ 2 of: DXY < 96, VIX > 25, SPX -5 % or HY-spread +75 bp → final ✔.
Bottom line
The bear-trap thesis aged well: sentiment, positioning, ETFs, and G/S ratio have already clicked bullish.
Only equity-market stress is missing. A fast USD slide or a tariff shock right after a neutral Fed is the most likely detonator.
Stay nimble: Collect premium inside $3 250-3 400 while volatility sleeps – but keep alarms on VIX 25 and DXY 96. One red headline could still launch the squeeze.
Disclaimer: Educational opinion, not investment advice. Futures & CFD trading is risky – do your own research and consult a professional.

Silver bullish above 3770The Silver remains in a bullish trend, with recent price action showing signs of a continuation breakout within the broader uptrend.
Support Zone: 3770 – a key level from previous consolidation. Price is currently testing or approaching this level.
A bullish rebound from 3770 would confirm ongoing upside momentum, with potential targets at:
4000 – initial resistance
4077 – psychological and structural level
4160 – extended resistance on the longer-term chart
Bearish Scenario:
A confirmed break and daily close below 3770 would weaken the bullish outlook and suggest deeper downside risk toward:
3727 – minor support
3685 – stronger support and potential demand zone
Outlook:
Bullish bias remains intact while the Silver holds above 3770. A sustained break below this level could shift momentum to the downside in the short term.
This communication is for informational purposes only and should not be viewed as any form of recommendation as to a particular course of action or as investment advice. It is not intended as an offer or solicitation for the purchase or sale of any financial instrument or as an official confirmation of any transaction. Opinions, estimates and assumptions expressed herein are made as of the date of this communication and are subject to change without notice. This communication has been prepared based upon information, including market prices, data and other information, believed to be reliable; however, Trade Nation does not warrant its completeness or accuracy. All market prices and market data contained in or attached to this communication are indicative and subject to change without notice.
Silver Rebounds Toward $38 as Dollar EasesSilver rebounded toward $38 per ounce on Friday, recovering from a two-day decline as the U.S. dollar and Treasury yields eased. The move reflected shifting sentiment on Fed policy and trade conditions after earlier losses sparked by inflation data that reduced hopes for near-term rate cuts.
U.S. stock futures edged higher following record closes for the S&P 500 and Nasdaq, driven by strong retail sales, lower jobless claims, and optimism in AI-related tech stocks after Taiwan Semiconductor’s positive forecast. On monetary policy, Fed officials remain divided: Mary Daly expects two rate cuts this year, while Adriana Kugler urges caution due to tariff-driven inflation. President Trump reinforced trade tensions by sending letters to over 20 partners setting new tariffs between 20% and 40%.
In corporate updates, United Airlines expects stronger earnings in the second half of 2025, and Chevron signaled higher future cash flow as production in its top U.S. oil field nears a plateau.
Resistance is at 38.50, while support holds at 37.20.

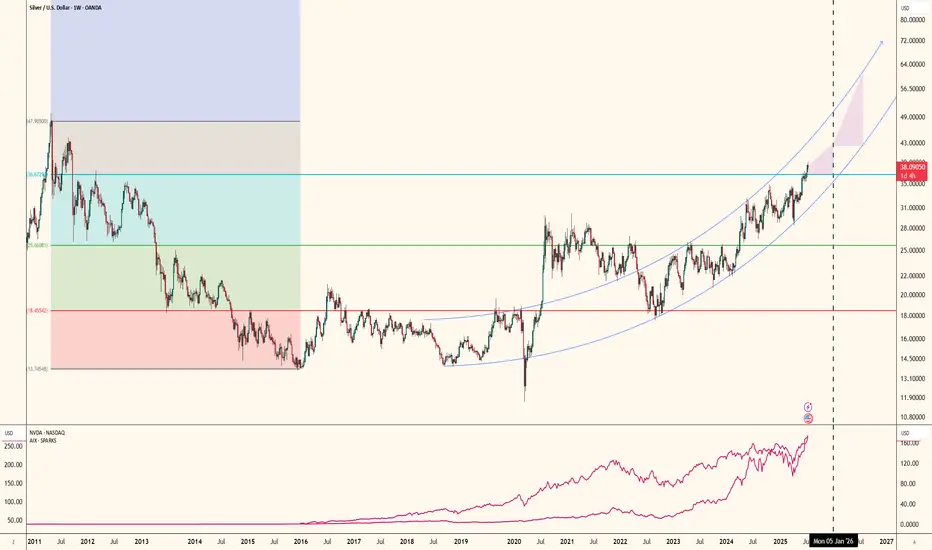
The AI Boom's Unsung HeroThe rise of artificial intelligence isn’t just shaking up tech companies it’s quietly transforming the global silver market in a big way. As major players like NVIDIA, Google and others ramp up their AI infrastructure silver is becoming more critical than ever. Why? Because silver, thanks to its unmatched electrical conductivity, plays a key role in powering the hardware behind AI.
Silver is the most conductive metal on Earth. That makes it perfect for high-performance computing something AI needs a lot of. It’s especially important in data centers and advanced semiconductors, where both electrical and thermal performance are mission-critical.
What’s really interesting is that AI servers tend to use two to three times more silver than traditional data center servers. That’s because AI workloads are more power-hungry, generate more heat and require more complex cooling and electrical systems. Simply put, more AI means more silver.
If there’s one company at the heart of this trend it’s NVIDIA. Analysts at Morgan Stanley expect NVIDIA to consume a staggering 77% of all silicon wafers used for AI accelerators in 2025 up from 51% in 2024. That adds up to around 535,000 300-mm wafers a year each of which contains silver in key components.
All of this AI growth is showing up in the numbers. Industrial silver demand hit an all-time high of 680.5 million ounces in 2024. The electronics industry alone uses around 250 million ounces per year and AI is now the fastest-growing part of that.
Despite all this demand, silver supply just isn’t keeping up. The market’s been in deficit for four straight years, with a total shortfall of 678 million ounces between 2021 and 2024. That’s roughly ten months of global mine output gone missing from the balance sheet.
It’s no surprise, then, that silver prices have been climbing fast. As of July 2025 silver’s up nearly 30% for the year. Looking further ahead I see room for silver to keep climbing:
In the short term (2025): $36–$42 per ounce seems realistic
By 2026: Potential for $50+ as more AI growth stays strong
AI isn’t just changing how we work, communicate, or compute—it’s literally reshaping the commodities that make this technology possible. Silver, once thought of mainly in the context of jewelry or coins, is now a backbone material for the AI revolution.
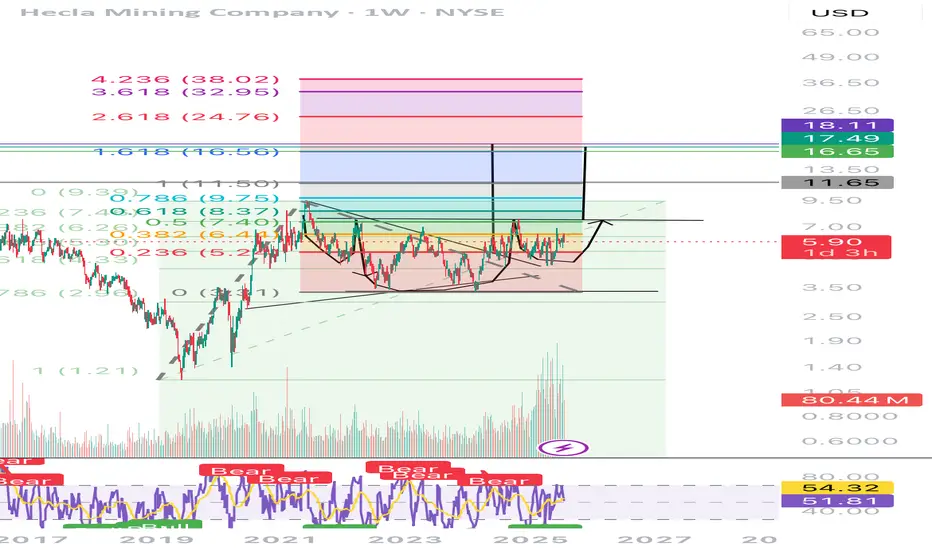
HL-Insane Confluence HereChart speaks for itself.
Confluence on many indicators suggests a hard bottom here
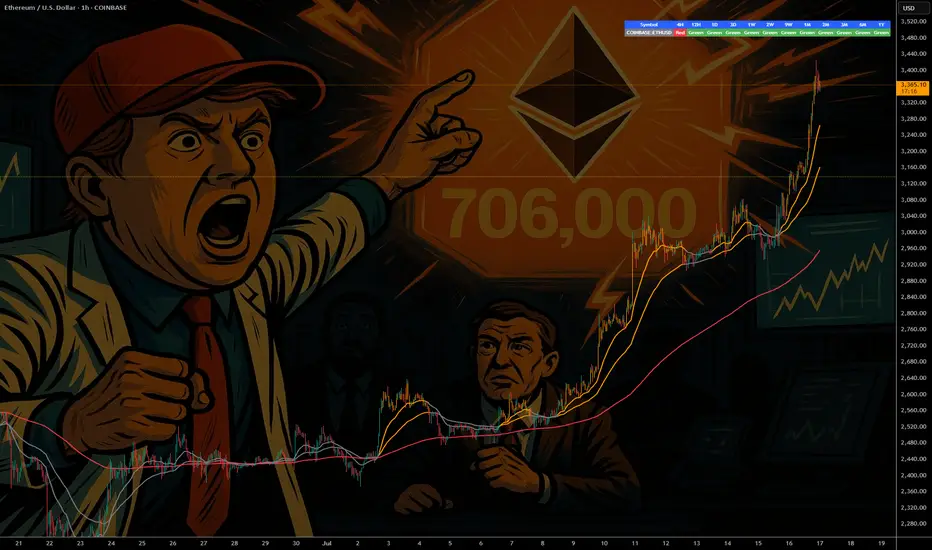
ETH - If You Know ...... You Know whats Coming
NYSE:BLK $BUIDL tokenized U.S.-Treasury fund launched on COINBASE:ETHUSD in Mar 2024—Wall Street is already settling real dollars on-chain.
NYSE:JPM JPMD stablecoin just went live on Base (an COINBASE:ETHUSD L2), piping wholesale payments from a $4 T balance-sheet straight through COINBASE:ETHUSD rails.
COINBASE:ETHUSD isn’t just riding the next crypto cycle—it’s becoming Wall Street’s settlement layer. From BlackRock’s on-chain Treasury fund to JPMorgan’s and soon Bank of America’s dollar tokens, a tidal wave of institutional stable-coin flows is lining up behind ETH. Fewer coins, more real-world volume—if you know, you know what’s coming.
NYSE:BAC CEO says they’ll issue a dollar-backed token the moment regulators nod—another tier-1 bank boarding the Ethereum train.
Stablecoin cap has blasted past $230 B , with 80 %+ of all on-chain transfers riding Ethereum (plus BSC) blocks.
Corporate settlements via stablecoins grew 25 % YoY in 2024 as multinationals replaced SWIFT with instant on-chain clearing.
Daily stablecoin throughput averages $7 B—each hop burning ETH and tightening supply.
BCG projects tokenized real-world assets to exceed $16 T by 2030 , with EVM chains as the default plumbing.
Over 500 M wallets already interact with stablecoins , a 30 % YoY surge led by emerging-market demand.
L2s like BINANCE:ARBUSDT & BINANCE:OPUSDT cut transaction fees 35 % yet still settle back to mainnet—meaning ETH captures the fee stream and the burn.
Bottom line: a tidal wave of bank-grade stablecoins + tokenized assets is lining up behind ETH; supply shrinks, demand soars—if you know, you know what’s coming.
quote] Marty Boots | 17-Year Trader — smash that , hit LIKE & SUBSCRIBE, and share your views in the comments below so we can make better trades & grow together!
SILVER: Local Bearish Bias! Short!
My dear friends,
Today we will analyse SILVER together☺️
The market is at an inflection zone and price has now reached an area around 37.832 where previous reversals or breakouts have occurred.And a price reaction that we are seeing on multiple timeframes here could signal the next move down so we can enter on confirmation, and target the next key level of 37.762..Stop-loss is recommended beyond the inflection zone.
❤️Sending you lots of Love and Hugs❤️
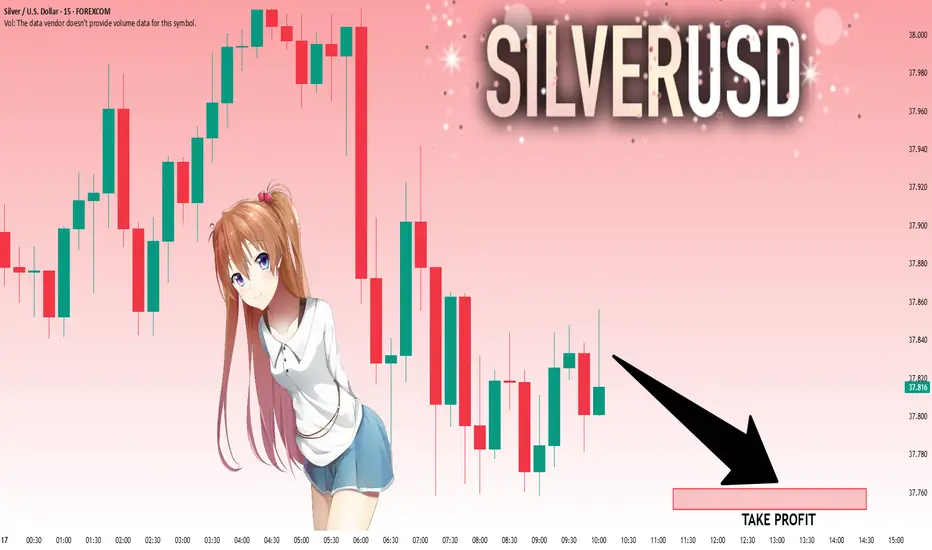
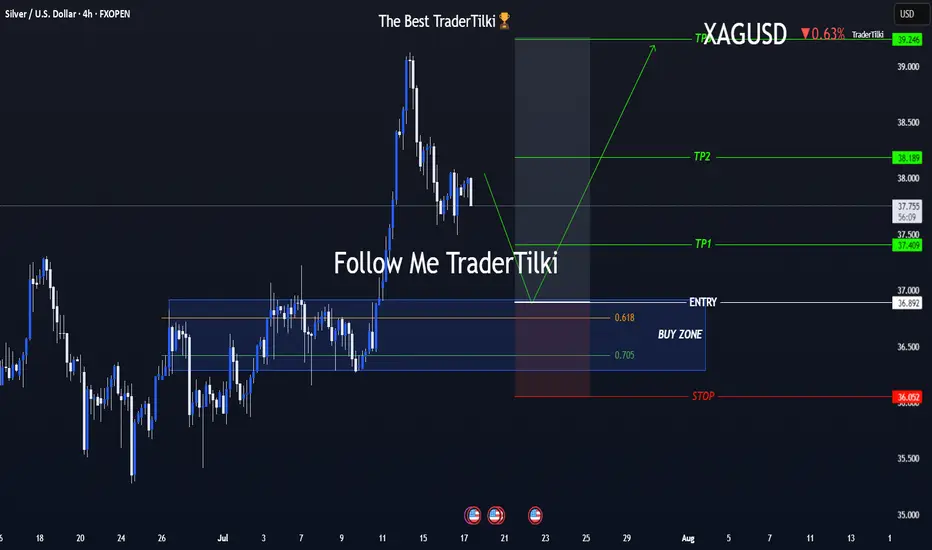
One Shot, Clear Strategy – Silver Buy Zone in SightHey everyone 👋
📌 BUY LIMIT ORDER / XAGUSD-SILVER Key Levels
🟢 Entry: 36,892
🎯 Target 1: 37,409
🎯 Target 2: 38,189
🎯 Target 3: 39,246
🔴 Stop: 36,052
📈 Risk/Reward Ratio: 2,79
I double-checked the levels and put together a clean, focused analysis just for you. Every single like seriously boosts my motivation to keep sharing 📈 Your support means the world to me! Huge thanks to everyone who likes and backs this work 💙 Our goals are crystal clear, our strategy is solid. Let’s keep moving forward with confidence and smart execution!
Silver H4 | Falling toward a pullback supportSilver (XAG/USD) is falling towards a pullback support and could potentially bounce off this level to climb higher.
Buy entry is at 37.27 which is a pullback support that aligns with the 50% Fibonacci retracement.
Stop loss is at 36.60 which is a level that lies underneath a pullback support and the 61.8% Fibonacci retracement.
Take profit is at 38.31 which is a swing-high resistance.
High Risk Investment Warning
Trading Forex/CFDs on margin carries a high level of risk and may not be suitable for all investors. Leverage can work against you.
Stratos Markets Limited (tradu.com ):
CFDs are complex instruments and come with a high risk of losing money rapidly due to leverage. 66% of retail investor accounts lose money when trading CFDs with this provider. You should consider whether you understand how CFDs work and whether you can afford to take the high risk of losing your money.
Stratos Europe Ltd (tradu.com ):
CFDs are complex instruments and come with a high risk of losing money rapidly due to leverage. 66% of retail investor accounts lose money when trading CFDs with this provider. You should consider whether you understand how CFDs work and whether you can afford to take the high risk of losing your money.
Stratos Global LLC (tradu.com ):
Losses can exceed deposits.
Please be advised that the information presented on TradingView is provided to Tradu (‘Company’, ‘we’) by a third-party provider (‘TFA Global Pte Ltd’). Please be reminded that you are solely responsible for the trading decisions on your account. There is a very high degree of risk involved in trading. Any information and/or content is intended entirely for research, educational and informational purposes only and does not constitute investment or consultation advice or investment strategy. The information is not tailored to the investment needs of any specific person and therefore does not involve a consideration of any of the investment objectives, financial situation or needs of any viewer that may receive it. Kindly also note that past performance is not a reliable indicator of future results. Actual results may differ materially from those anticipated in forward-looking or past performance statements. We assume no liability as to the accuracy or completeness of any of the information and/or content provided herein and the Company cannot be held responsible for any omission, mistake nor for any loss or damage including without limitation to any loss of profit which may arise from reliance on any information supplied by TFA Global Pte Ltd.
The speaker(s) is neither an employee, agent nor representative of Tradu and is therefore acting independently. The opinions given are their own, constitute general market commentary, and do not constitute the opinion or advice of Tradu or any form of personal or investment advice. Tradu neither endorses nor guarantees offerings of third-party speakers, nor is Tradu responsible for the content, veracity or opinions of third-party speakers, presenters or participants.

BRIEFING Week #29-30 : BTC stalling, ETH & then Alts ?Here's your weekly update ! Brought to you each weekend with years of track-record history..
Don't forget to hit the like/follow button if you feel like this post deserves it ;)
That's the best way to support me and help pushing this content to other users.
Kindly,
Phil
