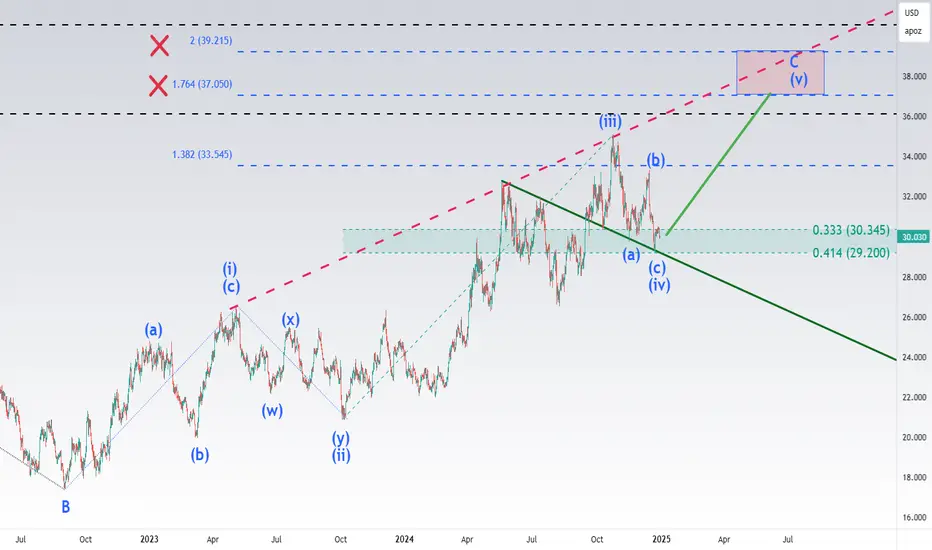
Silver - Bulls have a setup for another final push higher We can count silver as completing the second leg up in a large A up, B down, C up structure off the major pandemic low. The second leg up in a wave C normally stretches to at least 100% ext of the wave A up and is normally subdivided into five micro waves.
I think bulls should produce the final wave (v) up targeting the Red Box
Silver
Weekly Forex Forecast: Last Show For 2024Dec 30th to Jan 3rd.
USD is still strong, and so are the indices. I will be looking for buys until there is a significant bearish Break of Structure.
A strong USD is a headwind for Gold, Silver and the other metals. It is also a headwind for GBP, EUR and the other majors. USDCHF, USDCAD and USDJPY should see some upside.
Thank you for hangin' with me for 2024! I hope you found a benefit in my weekly forecasts this year. 2025 will be even better!
Enjoy!
May profits be upon you.
Leave any questions or comments in the comment section.
I appreciate any feedback from my viewers!
Like and/or subscribe if you want more accurate analysis.
Disclaimer:
I do not provide personal investment advice and I am not a qualified licensed investment advisor.
All information found here, including any ideas, opinions, views, predictions, forecasts, commentaries, suggestions, expressed or implied herein, are for informational, entertainment or educational purposes only and should not be construed as personal investment advice. While the information provided is believed to be accurate, it may include errors or inaccuracies.
I will not and cannot be held liable for any actions you take as a result of anything you read here.
Conduct your own due diligence, or consult a licensed financial advisor or broker before making any and all investment decisions. Any investments, trades, speculations, or decisions made on the basis of any information found on this channel, expressed or implied herein, are committed at your own risk, financial or otherwise.

Silver Is Approaching The Daily TrendHey Traders, in tomorrow's trading session we are monitoring XAGUSD for a buying opportunity around 28.700 zone, Silver is trading in an uptrend and currently is in a correction phase in which it is approaching the trend at 28.700 support and resistance area.
Trade safe, Joe.

Natural Gas | Oil | Dollar | Silver | Gold Price ForecastNatural Gas | Oil | Dollar | Silver | Gold Price Forecast

SILVER HEAND-n-SHOULDERS FORMATION LIKELY TO DRIVE PRICE DOWN!With the completion of Head-n-Shoulders formation, silver price may further drop lower in coming days.
N.B!
- XAGUSD price might not follow the drawn lines . Actual price movements may likely differ from the forecast.
- Let emotions and sentiments work for you
- ALWAYS Use Proper Risk Management In Your Trades
#silver
#xagusd

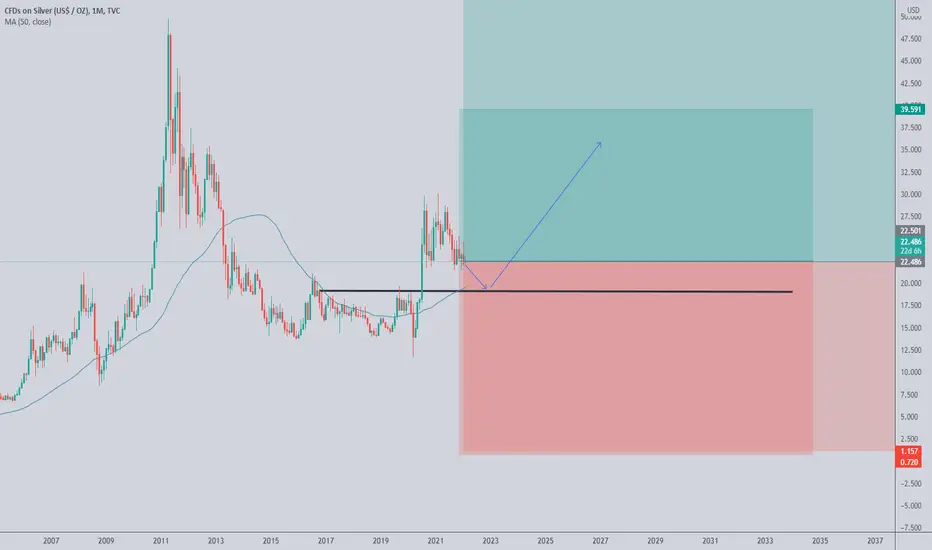
Silver price forecast for next 4 monthsHi,
I think, silver price movement will be like this for the next 4 months.
Probably a good buying opportunity at $27, with a stop loss of $26. Take profit is $35 (30%)

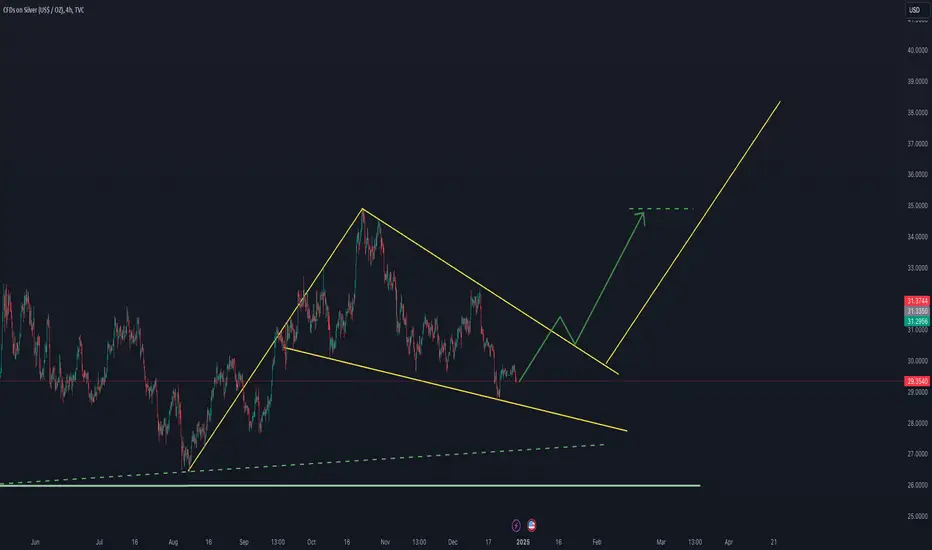
silverSilver has formed a nice wedge formation on its 4-hour chart. If the wedge breaks, the first target will be the 35 USD region.
SILVER BULLISH BIAS RIGHT NOW| LONG
Hello, Friends!
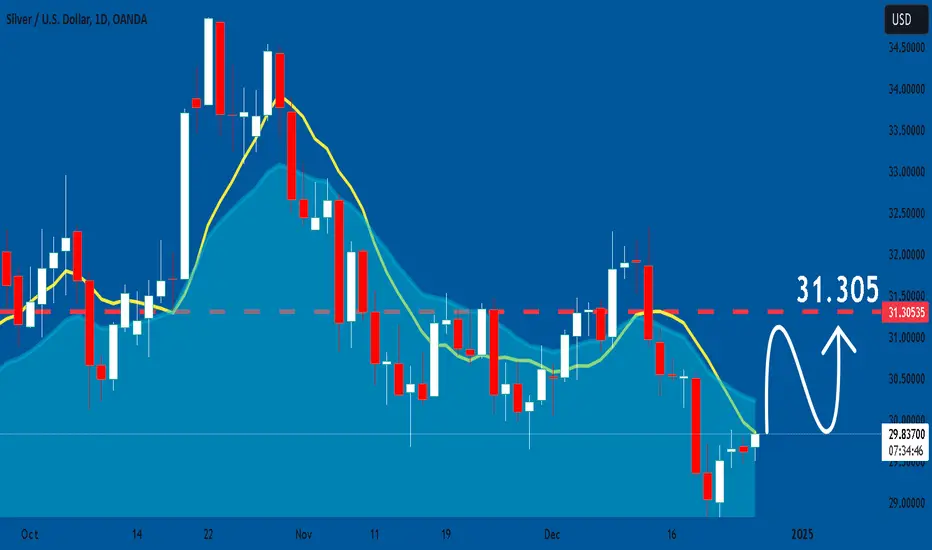
The BB lower band is nearby so SILVER is in the oversold territory. Thus, despite the downtrend on the 1W timeframe I think that we will see a bullish reaction from the support line below and a move up towards the target at around 31.649.
✅LIKE AND COMMENT MY IDEAS✅

SPY/QQQ Plan Your Trade For 12-27-24: Momentum Rally PatternThe last Friday of the year (2024) should show up as a moderate Momentum Rally in the SPY/QQQ - possibly seeing the SPY target 603 or higher by the end of the day.
Gold and Silver are consolidating into a FLAGGING formation.
Bitcoin is trapped in a consolidation range (right shoulder) pattern that should break downward over the next 5+ days.
This is the time to position your trades for the beginning of 2025 and prepare for moderate volatility as the markets struggle for direction.
The Momentum Rally pattern, today, should present a very clean opportunity for skilled day traders.
I believe a deeper low is likely to setup between January 15 and January 25, 2025. So, be prepared for another roll to the downside after we get past the New Year.
Get some.
#trading #research #investing #tradingalgos #tradingsignals #cycles #fibonacci #elliotwave #modelingsystems #stocks #bitcoin #btcusd #cryptos #spy #es #nq #gold

SILVER Outlook after the Dip. What to expect NOW?As you can see, the price has repeatedly hit the trendline and then increased. This time, the same situation has occurred, so the trendline can be relied upon. Additionally, a hidden bullish divergence is visible, indicating a potential price increase.
Give me some energy !!
✨We spend hours finding potential opportunities and writing useful ideas, we would be happy if you support us.
Best regards CobraVanguard.💚
_ _ _ _ __ _ _ _ _ _ _ _ _ _ _ _ _ _ _ _ _ _ _ _ _ _ _ _ _ _ _ _
✅Thank you, and for more ideas, hit ❤️Like❤️ and 🌟Follow🌟!
⚠️Things can change...
The markets are always changing and even with all these signals, the market changes tend to be strong and fast!!

SILVER Will Go Lower! Sell!
Take a look at our analysis for SILVER.
Time Frame: 12h
Current Trend: Bearish
Sentiment: Overbought (based on 7-period RSI)
Forecast: Bearish
The market is approaching a significant resistance area 29.812.
Due to the fact that we see a positive bearish reaction from the underlined area, I strongly believe that sellers will manage to push the price all the way down to 28.778 level.
P.S
The term oversold refers to a condition where an asset has traded lower in price and has the potential for a price bounce.
Overbought refers to market scenarios where the instrument is traded considerably higher than its fair value. Overvaluation is caused by market sentiments when there is positive news.
Like and subscribe and comment my ideas if you enjoy them!

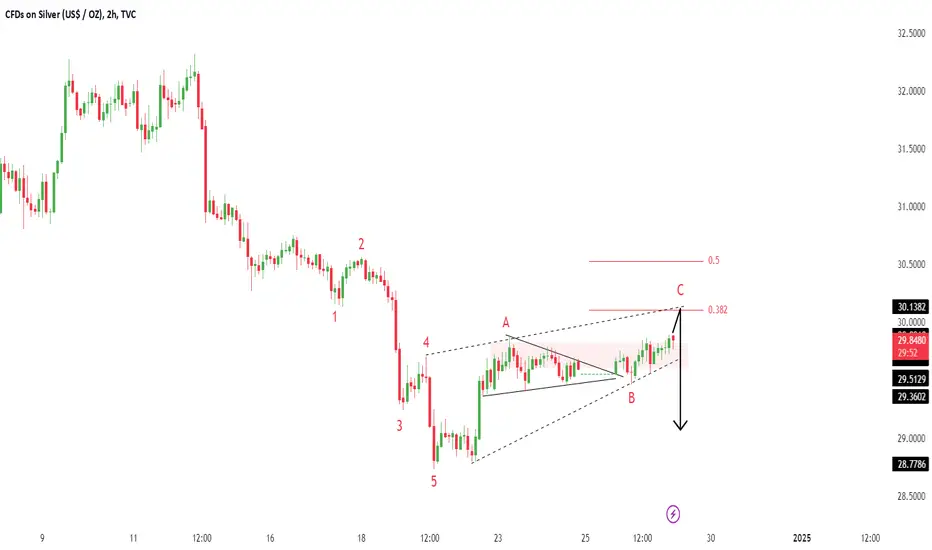
SilverXAGUSD ( Silver / U.S Dollar )
Completed " 12345 " Impulsive Waves and " AB " corrective waves
Break of Structure
Demand Zone
Rising Wedge as an corrective pattern in Short Time Frame
Fibonacci Level - 38.20% / 50.00%
SILVER: Market Sentiment & Price Action
Looking at the chart of SILVER right now we are seeing some interesting price action on the lower timeframes. Thus a local move up seems to be quite likely.
❤️ Please, support our work with like & comment! ❤️
SPY/QQQ Plan Your Trade for 12-26-24 : Inside Breakaway PatternThis, being the day After Christmas, could be a very volatile trading day. I suggest traders sit back and let the morning volatility settle before attempting to make any big trades.
I believe the markets will seek direction after Christmas and look to attempt to move into a Reversion phase (likely trending upward into the end of 2024).
Overall, I believe the Anomaly event has completed - yet there is still risk for the markets to move lower before the end of Feb 2025.
Follow my research and pay attention to how large the recent Daily price bars are compared to previous ranges. The current market volatility is MASSIVE.
There is no reason skilled traders are not able to profit from some of these big price swings.
Gold and Silver enter a CRUSH pattern. This could be a huge price move for Gold & Silver today.
Bitcoin is sliding into the Consolidation Phase of an EPP pattern. This could result in another breakdown towards $72k if the EPP pattern plays out.
Buckle up.
Get some.
#trading #research #investing #tradingalgos #tradingsignals #cycles #fibonacci #elliotwave #modelingsystems #stocks #bitcoin #btcusd #cryptos #spy #es #nq #gold

$SLV Trade Analysis DarkPoolsChart Overview:
Instrument: iShares Silver Trust (SLV)
Timeframe: 4-hour chart
Indicators on Chart:
Moving Averages: Likely 8 EMA and 21 EMA for short-term trend analysis.
Dark Pool Levels: Represented by white dashed lines at key levels.
Trendlines:
Red Line: Downtrend resistance.
Green Lines: Support forming an ascending wedge after a potential trend reversal.
Horizontal Resistance:
Yellow Line at $29.00: Major psychological and technical resistance.
White Dashed Lines near $28.20 and $26.53: Key dark pool levels.
Key Observations:
Descending Channel Reversal:
SLV was previously in a clear downtrend marked by the red resistance and green support lines.
The recent breakout above the green support line and consolidation near $27 indicates a potential shift in momentum.
Ascending Triangle Formation:
After the breakout from the previous downtrend, the price has formed a triangle pattern, with resistance near $27.08 and ascending support at $26.96.
This formation is often a bullish continuation pattern, suggesting an imminent breakout if the price can breach the resistance.
Dark Pool Levels:
$28.20: An immediate target, aligning with prior price action and a dark pool level.
$26.53: A significant support level where institutional activity may provide a floor for the price.
Resistance and Support Levels:
Resistance:
$27.08: Triangle resistance.
$29.00 - $29.13: Major resistance and likely profit-taking zone.
Support:
$26.96: Immediate ascending support line within the triangle.
$26.53: Key dark pool support level and invalidation zone for a bullish outlook.
Volume:
A breakout above $27.08 should ideally be accompanied by a volume spike to confirm institutional buying and sustained bullish momentum.
Trade Idea:
Entry:
Breakout Entry: Enter above $27.08 with confirmation (strong candle close and increased volume).
Pullback Entry: Enter near $26.96, the lower support of the triangle, for a better risk-reward setup.
Profit Targets:
$28.20: First target aligning with the dark pool level.
$29.00: Major resistance and likely profit-taking zone.
$29.13: Final target, slightly above the psychological resistance zone.
Stop Loss:
Close below $26.53: Invalidation of the bullish setup and indicates a likely continuation of the downtrend.
Risk Management:
Position size should be calculated based on risk tolerance.
Ensure a risk-to-reward ratio of 1:3, considering the entry near $27.08, stop loss at $26.53, and first target at $28.20.
Additional Notes:
Volume Confirmation: A breakout above $27.08 should be accompanied by a surge in volume to validate the move.
Dark Pool Influence: Watch price behavior near $28.20 and $26.53 to gauge institutional activity.
Caution: If the price consolidates too long near the triangle resistance without breaking out, it may signal weakness and increase the probability of a breakdown.
