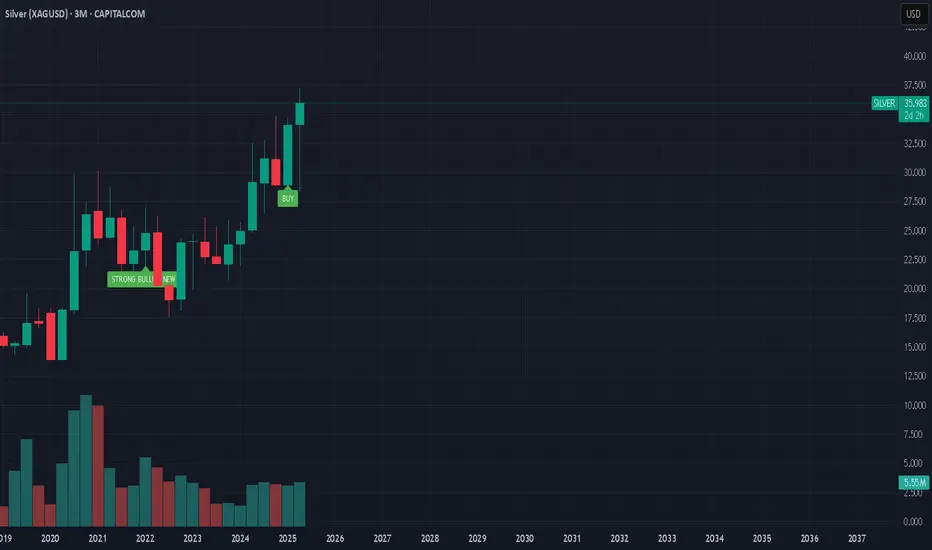
STEEL-NERVE SETUP – ARE WE RE-LIVING GOLD’S 2020 BEAR-TRAP?Retail sentiment is ultra-bearish, positioning is cooling, Silver is outperforming and the S&P 500 is screaming risk-on … exactly the cocktail we saw in June 2020, right before Gold & Silver exploded higher.
1️⃣ WHY THIS FEELS LIKE 2020 AGAIN
2025 (now) 2020 (pre-rally) Read-through
> 70 % of TradingView ideas are bearish 💬 > 60 % were bearish Crowd may be offsides again
Managed-money net-longs -18 % from April peak 📉 -25 % from March peak Powder for fresh longs
First monthly ETF outflow (-$1.8 bn) 🚪 Record inflows Capitulation, not euphoria
Gold/Silver ratio down to 94 ⚖️ Fell to 95 Silver leadership = bottoming tell
S&P 500 at new ATH 📈 S&P at new ATH Risk-on backdrop identical
2️⃣ WHAT’S DIFFERENT THIS TIME
Real 10-y TIPS yield +0.7 % (2020: -1 %) → smaller monetary tail-wind.
Gold already at inflation-adjusted ATH → upside could be shorter & sharper, not a fresh super-cycle (yet).
3️⃣ CHECKLIST FOR A REAL BEAR-TRAP
Signal Watch-level
Gold holds $3 200–3 250 (100-d SMA + fib) Daily close above zone
Gold/Silver ratio breaks < 90 Momentum confirmation
CFTC net-longs < 150 k Position flush
ETF flows turn positive Fear → FOMO
S&P stumbles / vols spike Classic risk-bid for Gold
Need 3 of 5 boxes ticked to validate the squeeze thesis.
4️⃣ CATALYST CALENDAR
3 Jul – NFP: sub-75 k print could fire the opening salvo.
9 Jul – Tariff freeze decision: escalation would revive safe-haven demand.
15 Jul – CPI & 30-31 Jul – FOMC: dovish turn + soft data could complete the squeeze.
Disclaimer: This post reflects my personal opinion for educational purposes only; it is not financial advice. Trading futures and commodities involves substantial risk and can lead to total loss of capital—do your own research (DYOR) and consult a qualified professional before acting.
Silver

Gold | Oil | Dollar | Silver | Natural Gas Price Forecast.Gold | Oil | Dollar | Silver | Natural Gas Price Forecast.
NYMEX:NG1! COMEX:GC1! AMEX:UNG COMEX:SI1!

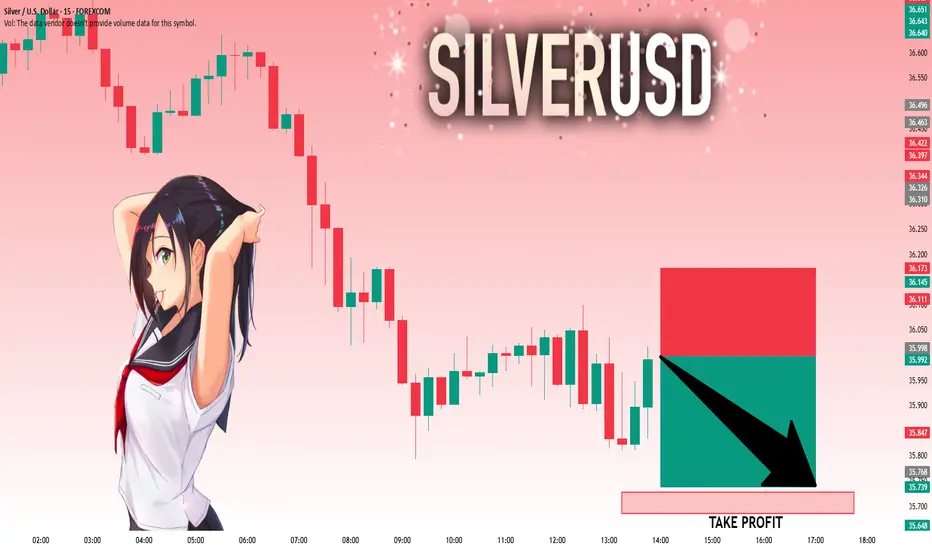
"The Vault is Open!" - Time to Steal Silver Pips🔥 XAG/USD SILVER HEIST: Bearish Raid in Progress! (Short Setup) 🔥
🦹♂️ ATTENTION SILVER BANDITS!
To the Metals Mercenaries & Risk-Takers! 💰🔪
Using our 🔥Thief Trading Tactics🔥, we're executing a bearish raid on XAG/USD - this is not advice, just a strategic robbery plan for traders who play to win.
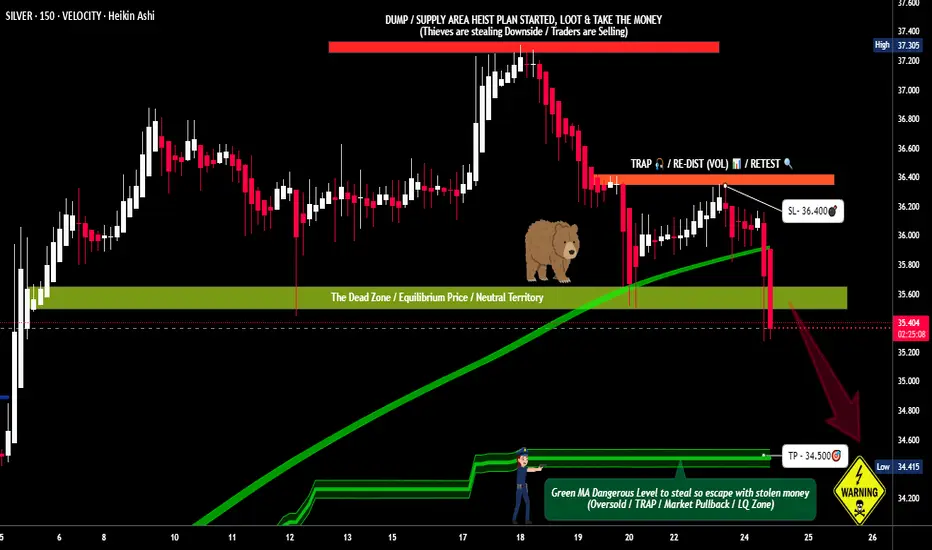
📉 THE SILVER VAULT BREAK-IN (SHORT ENTRY PLAN)
🎯 Loot Zone: 34.500 (or escape earlier if bulls fight back)
💣 High-Stakes Play: Perfect pullback to steal pips
👮♂️ Cop Trap: Where bulls get liquidated
🔪 ENTRY RULES:
"Vault Breach Confirmed!" - Strike at pullback to nearest swing high/low (15-30min TF)
Sell Limit Orders for optimal risk/reward
Aggressive? Enter at market but watch gold correlation
📌 SET ALERTS! Don't miss the rejection
🚨 STOP LOSS (Escape Plan):
Thief SL at 36.400 (Key swing level)
⚠️ Warning: "Ignore this SL? Enjoy donating to bulls."
🎯 TARGETS:
Main Take-Profit: 34.500
Scalpers: Ride the NY session momentum
🔍 WHY THIS HEIST WORKS
✅ Industrial demand slowing
✅ Dollar strength crushing metals
✅ ETF outflows accelerating
✅ Technical rejection at key level
🚨 RISK WARNING
Avoid FOMC/NFP periods (Silver loves volatility)
Trailing stops = your escape plan
💎 BOOST THIS HEIST!
👍 Smash Like to fund our next raid!
🔁 Share to build our thief army!
🤑 See you at 34.500, bandits!
⚖️ DISCLAIMER: Hypothetical scenario. Trade at your own risk.
#XAGUSD #SilverTrading #Commodities #ThiefTrading
💬 COMMENT: "Short already - or waiting for better entry?"* 👇🔥
Silver is in the Bearish trend after testing ResistanceHello Traders
In This Chart XAGUSD HOURLY Forex Forecast By FOREX PLANET
today XAGUSD analysis 👆
🟢This Chart includes_ (XAGUSD market update)
🟢What is The Next Opportunity on XAGUSD Market
🟢how to Enter to the Valid Entry With Assurance Profit
This CHART is For Trader's that Want to Improve Their Technical Analysis Skills and Their Trading By Understanding How To Analyze The Market Using Multiple Timeframes and Understanding The Bigger Picture on the Charts

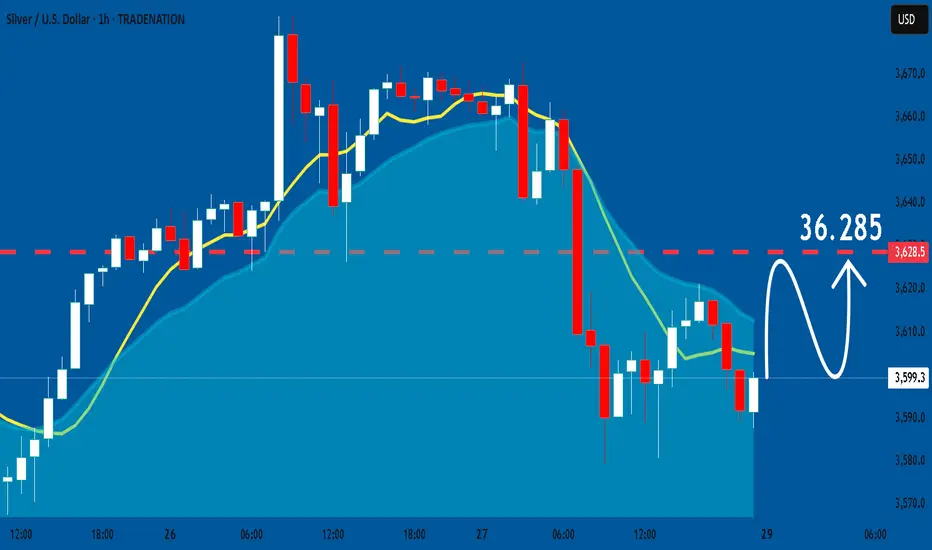
SILVER Sellers In Panic! BUY!
My dear friends,
Please, find my technical outlook for SILVER below:
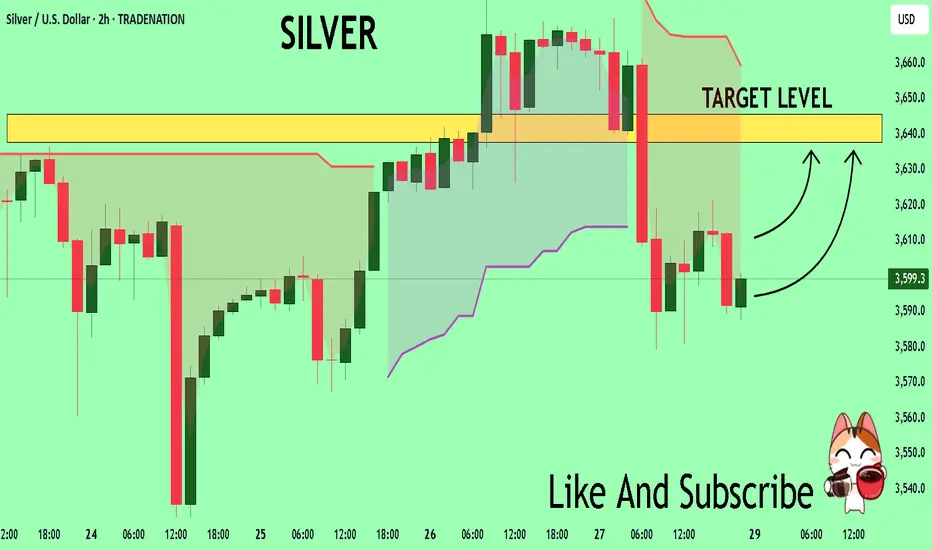
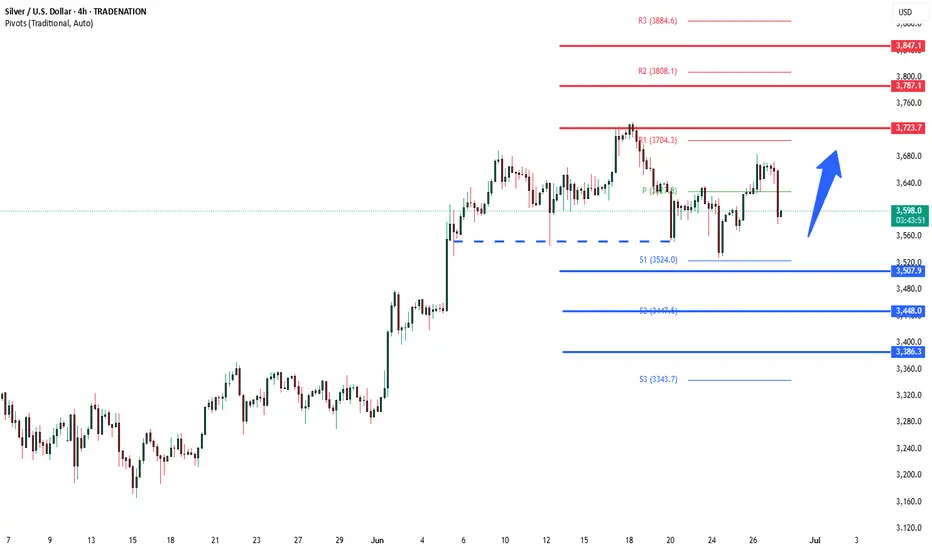
The price is coiling around a solid key level - 35.993
Bias -Bullish
Technical Indicators: Pivot Points Low anticipates a potential price reversal.
Super trend shows a clear buy, giving a perfect indicators' convergence.
Goal - 36.378
About Used Indicators:
The pivot point itself is simply the average of the high, low and closing prices from the previous trading day.
Disclosure: I am part of Trade Nation's Influencer program and receive a monthly fee for using their TradingView charts in my analysis.
———————————
WISH YOU ALL LUCK
Gold Bull Markets: Long-Term Overview & Current Market UpdateGold Bull Markets: Long-Term Overview & Current Market Update (2024–2025)
________________________________________
🏆 Historic Gold Bull Markets: Timeline & Stats
1️⃣ 1968–1980 “Super Bull”
• Start/End: 1968 ($35) → 1980 ($850)
• Total Gain: ~2,330%
• Key Drivers:
o End of the gold standard (Bretton Woods collapse)
o Double-digit inflation, oil shocks
o Political/economic turmoil (Vietnam, stagflation)
• Correction:
o Nearly –45% drop (1974–1976)
• Recovery:
o Took years; massive rebounds afterward
2️⃣ 1999–2012 Bull Market
• Start/End: 1999 ($252) → 2012 ($1,920)
• Total Gain: ~650%
• Key Drivers:
o Commodities supercycle
o Emerging market demand
o US dollar weakness, financial crisis fears
• Correction:
o ~–30% during 2008 crisis, but fast recovery
• Recovery:
o Rebounded quickly after 2008, then peaked in 2011–12
3️⃣ 2016/2018–2027 (Current Cycle)
• Start/End: 2016/2018 ($1,050–$1,200) → ongoing ($3,500+)
• Key Drivers:
o Record central bank buying
o Persistent inflation & low real rates
o Geopolitical instability (Russia/Ukraine, China/US, etc.)
• Correction:
o Only –20% drawdown in 2022; quick recovery
o Broke 13-year technical “cup-and-handle” base in 2024
________________________________________
📊 Current Bull Market Stats (2025) – At a Glance
Metric 1968–80 Super Bull 1999–2012 Bull 2018–2025 Current Bull
🚀 Total Gain ~2,330% ~650% ~200% so far
⏲️ Duration 12 years 13 years 7–9 years so far
💔 Max Drawdown –45% (1974–76) –30% (2008) –20% (2022)
🏦 Central Bank Role Moderate Emerging Dominant
📉 Correction Recovery Years 4 years Months
🏛️ Technical Pattern Secular breakout Multiple peaks 13-yr base breakout
________________________________________
📈 Top 10 Stats of the Current Gold Bull Market (2025):
1. Gold Price:
o ~$3,338–$3,364/oz; ATH > $3,500 in April 2025
2. Year-to-Date Gain:
o +29% YTD (2025); +30% in 2024
3. Central Bank Demand:
o 1,000 tonnes bought for 4th straight year; reserves near records
4. Inflation Hedge:
o Strong negative correlation with real yields; safe-haven demand up
5. Gold vs S&P 500:
o Gold +27% YTD; S&P 500 up only ~2%
6. Jewelry Demand:
o Down –9% in 2024, projected –16% in 2025 (high prices suppress demand)
7. Gold-Silver Ratio:
o Now ~94 (down from 105); silver catching up
8. Record Closes:
o Over 40 daily record closes in 2025; price consolidating near highs
9. Technical Breakout:
o 13-year “cup-and-handle” breakout (March 2024)
10. 2025 Forecasts:
• Range: $3,600–$4,000 by Q2 2026; some see $4,500+ if risks persist
________________________________________
🔄 How This Bull Market Stands Out
• Dominance of Central Banks:
Central banks are setting the pace—record demand, making gold a reserve anchor again.
• Faster Recovery:
Corrections are less severe, recoveries are quick (months, not years).
• Synchronized Rally with Equities:
Rare for gold and stocks to hit highs together—shows systemic confidence in gold.
• Technical Breakout:
13-year base break signals powerful, long-term momentum.
• Future Outlook:
Targets as high as $7,500/oz (650% from cycle lows) possible by 2026/27, if historical analogs play out.
________________________________________
⭐️ Recommended Strategy (2025 and Beyond)
• BUY/HOLD/ACCUMULATE on Dips:
Favor physical gold, gold ETFs (GLD), and miners (GDX).
• Physical Over Paper:
Preference for allocated, physical bullion amid rising counterparty risks.
• Diversify with Miners/Silver:
Gold-silver ratio suggests silver may offer leverage; quality miners benefit in the latter stage of bull runs.
• Long-Term Perspective:
Anticipate volatility, but higher highs are likely if macro themes persist.
________________________________________
🧭 Summary Table: Historic vs Current Bull Markets
Feature 1968–80 1999–2012 2016/18–2027
Total Gain 2,330% 650% 200%+ (so far)
Duration 12 yrs 13 yrs 7–9 yrs (so far)
Correction –45% –30% –20%
Main Buyer Retail Funds Central Banks
Pattern Parabolic Cyclical Cup & Handle
Key Risks Inflation USD/credit Inflation, war, geopolitics
________________________________________
Key Takeaways
• Gold’s current bull market is distinguished by relentless central bank demand, robust technical momentum, and swift recoveries from corrections.
• The macro backdrop—persistent inflation, global uncertainty, and sovereign de-dollarization—supports an extended cycle.
• Expectations for $4,000+ gold in the next 12–24 months are widely held, with even higher targets in a true global crisis.

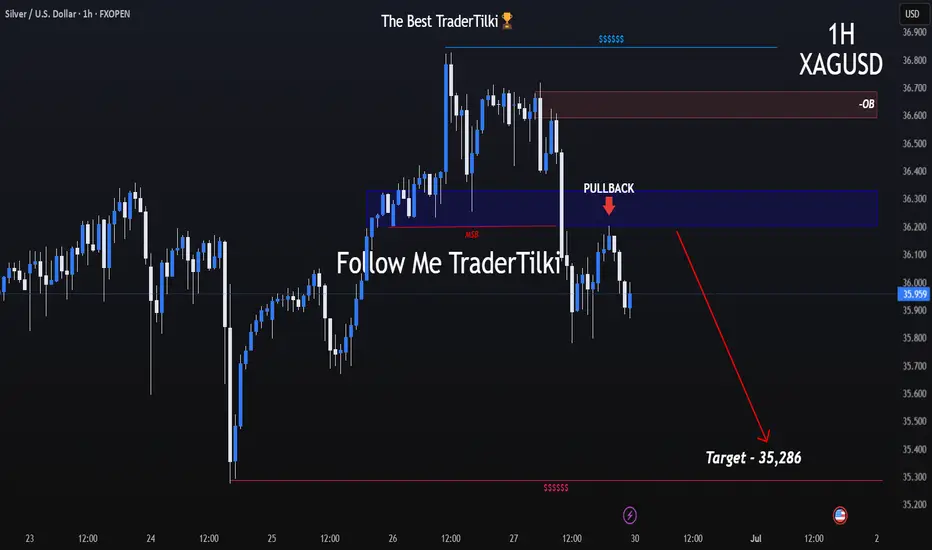
Is the Uptrend Over? Critical Break on the Silver 1-Hour ChartHey everyone,
After the upward trend structure on XAGUSD broke down, the support level was breached, followed by a pullback. Because of this, my target level is 35.286.💬
Also, keep a close eye on key economic data releases on the fundamental side, as they could significantly influence your strategy.
I meticulously prepare these analyses for you, and I sincerely appreciate your support through likes. Every like from you is my biggest motivation to continue sharing my analyses.
I’m truly grateful for each of you—love to all my followers💙💙💙
Small SLV positionTaking a small position in SLV here.
Long term looking at the gold to silver ratio trading around 90 If gold holds its grounds and silver plays catch up to a ratio of 70 even 60. I will be playing this position less about price and more about the ratio. If slv breaks all time high I will start selling regardless of price 20% week unless price is parabolic. Then selling will be 50% per week.
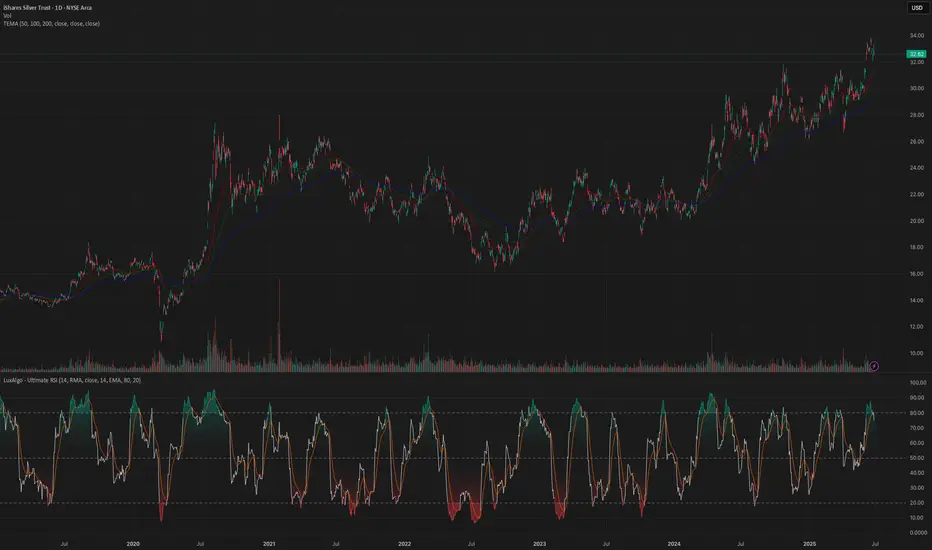
Silver-The Next Gold?The precious metals market is abuzz with a compelling question: Is silver poised to become the next gold? As gold continues its record-breaking ascent, investors and analysts are turning their attention to silver, which has demonstrated remarkable performance and potential in 2025. Let’s dive into the factors driving silver’s price, expert forecasts, and what the future may hold for this dynamic metal.
Silver’s 2025 Surge: Outpacing Expectations
Silver prices have surged impressively in 2025, recently trading above $34 per ounce—a 14% year-to-date increase that outpaces many other commodities. This rally is not just a speculative spike; it’s underpinned by robust fundamentals, including:
Gold’s record run, which historically pulls silver prices higher due to their strong correlation
Persistent supply deficits, with 2025 marking the fifth consecutive year of market shortfall
Soaring industrial demand, especially from the green technology and electronics sectors
Renewed safe-haven buying amid ongoing geopolitical and economic uncertainties
#commodity #silver #gold #xau #metals #finance #market #trading #portfolio #analysis
SILVER: Bulls Will Push
The price of SILVER will most likely increase soon enough, due to the demand beginning to exceed supply which we can see by looking at the chart of the pair.
Disclosure: I am part of Trade Nation's Influencer program and receive a monthly fee for using their TradingView charts in my analysis.
❤️ Please, support our work with like & comment! ❤️
BRIEFING Week #26 : Are we going for a Bubble ?Here's your weekly update ! Brought to you each weekend with years of track-record history..
Don't forget to hit the like/follow button if you feel like this post deserves it ;)
That's the best way to support me and help pushing this content to other users.
Kindly,
Phil

SILVER: The Market Is Looking Down! Short!
My dear friends,
Today we will analyse SILVER together☺️
The market is at an inflection zone and price has now reached an area around 35.998 where previous reversals or breakouts have occurred.And a price reaction that we are seeing on multiple timeframes here could signal the next move down so we can enter on confirmation, and target the next key level of 35.727..Stop-loss is recommended beyond the inflection zone.
❤️Sending you lots of Love and Hugs❤️
Silver consolidation supported at 3500Silver – Technical Analysis
The Silver price action continues to exhibit a bullish sentiment, underpinned by a prevailing rising trend. However, recent intraday moves indicate a corrective pullback, reflecting short-term consolidation within the broader uptrend.
Key Technical Levels:
Support:
3,500 – Primary support and previous consolidation zone; critical for maintaining bullish structure.
3,450 – Secondary support; potential downside target if 3,500 fails.
3,390 – Key lower support; aligns with a broader demand area.
Resistance:
3,720 – Immediate upside resistance; first target on a bullish bounce.
3,790 – Intermediate resistance; aligns with recent swing highs.
3,850 – Long-term resistance target; marks the upper boundary of the current bullish channel.
Scenario Analysis:
Bullish Continuation (Base Case):
A bounce from the 3,500 level would affirm the corrective pullback as temporary, with potential for a bullish continuation targeting 3,720, followed by 3,790 and 3,850 over a longer timeframe.
Bearish Reversal (Alternative Scenario):
A daily close below 3,500 would undermine the current bullish outlook and signal a deeper retracement, with downside risk toward 3,450 and potentially 3,390, where structural support may stabilize price.
Conclusion:
Silver remains structurally bullish, with the current pullback offering a potential entry point within the trend. The 3,500 level is the key pivot—holding above it supports further upside continuation, while a breakdown below would raise the risk of a deeper correction. Traders should watch for price action confirmation at this level to validate the next directional move.
This communication is for informational purposes only and should not be viewed as any form of recommendation as to a particular course of action or as investment advice. It is not intended as an offer or solicitation for the purchase or sale of any financial instrument or as an official confirmation of any transaction. Opinions, estimates and assumptions expressed herein are made as of the date of this communication and are subject to change without notice. This communication has been prepared based upon information, including market prices, data and other information, believed to be reliable; however, Trade Nation does not warrant its completeness or accuracy. All market prices and market data contained in or attached to this communication are indicative and subject to change without notice.
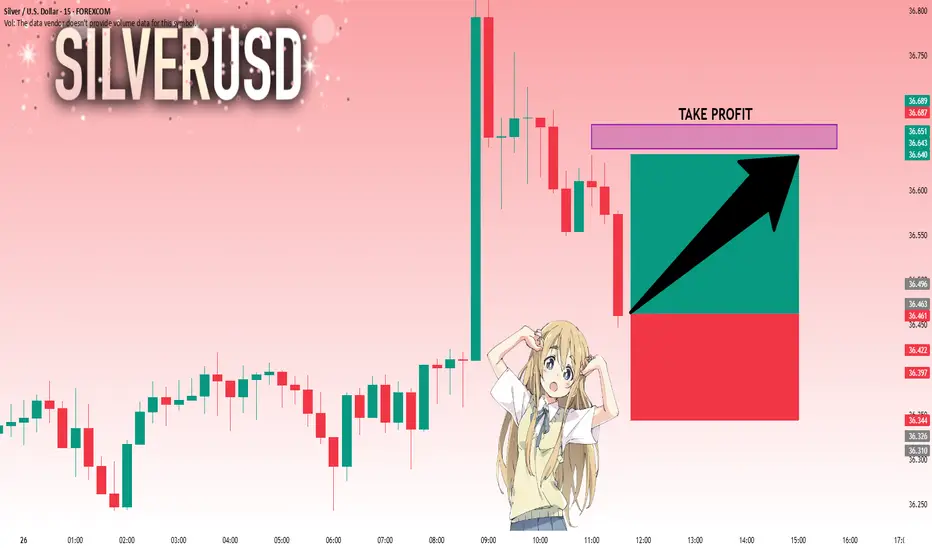
SILVER: Bulls Are Winning! Long!
My dear friends,
Today we will analyse SILVER together☺️
The recent price action suggests a shift in mid-term momentum. A break above the current local range around 36.463 will confirm the new direction upwards with the target being the next key level of 36.640 and a reconvened placement of a stop-loss beyond the range.
❤️Sending you lots of Love and Hugs❤️
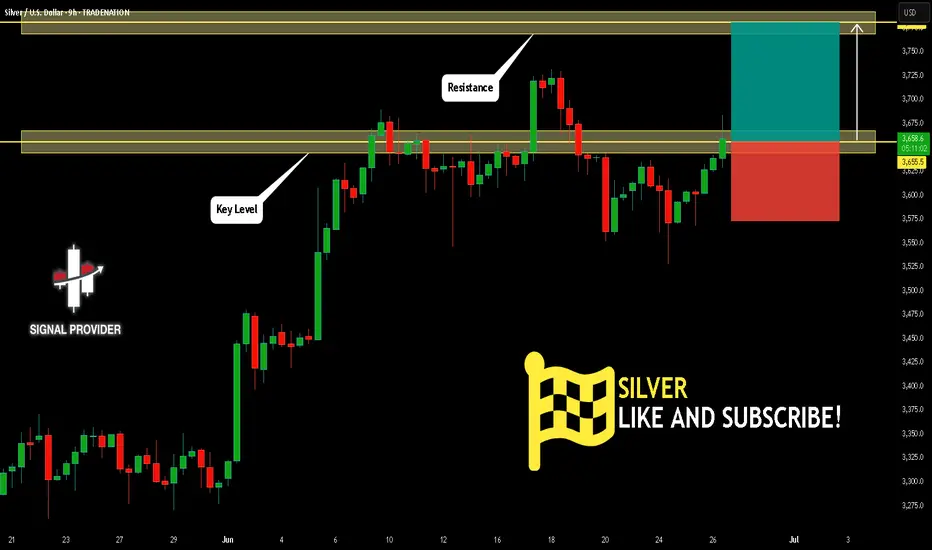
SILVER Will Go Up! Buy!
Take a look at our analysis for SILVER.
Time Frame: 9h
Current Trend: Bullish
Sentiment: Oversold (based on 7-period RSI)
Forecast: Bullish
The market is on a crucial zone of demand 3,655.5.
The oversold market condition in a combination with key structure gives us a relatively strong bullish signal with goal 3,780.6 level.
P.S
We determine oversold/overbought condition with RSI indicator.
When it drops below 30 - the market is considered to be oversold.
When it bounces above 70 - the market is considered to be overbought.
Disclosure: I am part of Trade Nation's Influencer program and receive a monthly fee for using their TradingView charts in my analysis.
Like and subscribe and comment my ideas if you enjoy them!
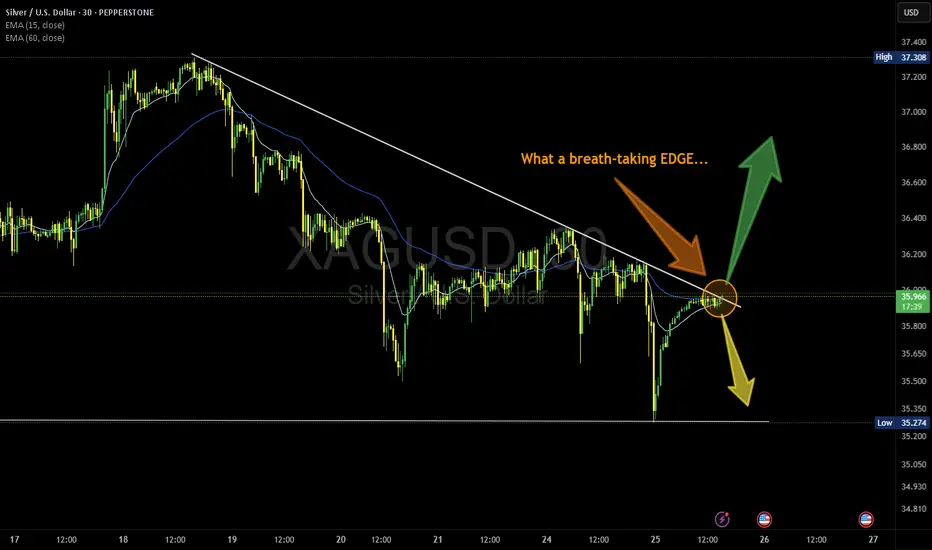
Silver - M30What a breath-taking EDGE...
Wait for confirmation then enter...
Please Manage Your Risk.
#Silver #XAGUSD #Forex #chart #Edge #MJTrading
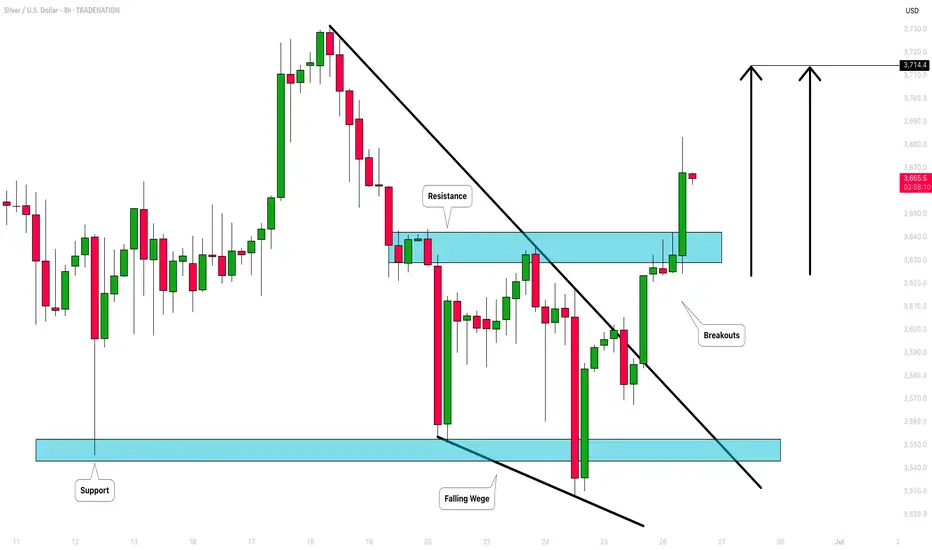
SILVER (XAGUSD): Buyers Show Strength
Silver is going to rise more, following a strong bullish sentiment this morning.
The price violated a strong falling trend line and an intraday horizontal resistance.
These 2 breakouts indicate a strong buying pressure.
The price may grow more today and reach 37.14 level.
❤️Please, support my work with like, thank you!❤️
I am part of Trade Nation's Influencer program and receive a monthly fee for using their TradingView charts in my analysis.
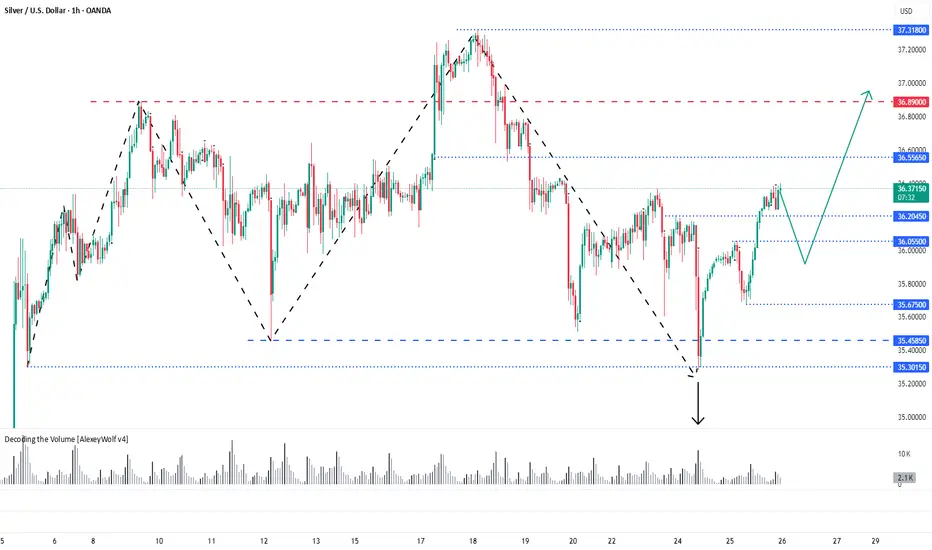
Silver - overview with Initiative AnalysisHey traders and investors!
Hourly Timeframe
📍 Context
The hourly chart is in a sideways range.
Currently, the buyer has the initiative, potential target 36.55.
📊 Key Actions
The 35.30 level on the hourly timeframe has worked well. This level marks the correction extreme within the dominant buyer initiative (i.e., an initiative where the correction is less than 50%).
A seller attack bar (IKC) targeting the lower boundary of the sideways range was absorbed by the buyer, and this absorption led to a renewed buyer. Targets visible on the chart - Hourly and daily timeframe: 36.55 and 36.89
Daily Timeframe
📍 Context
Currently, the buyer has the initiative, potential target 36.89.
📊 Key Actions
On the daily timeframe, there was also a seller IKC bar attacking the lower boundary of the buyer's initiative, which was bought back by the buyer.
🎯 Trade Idea
Potential buying patterns can now be monitored at: 36.20, 36.05, 35.67, 35.458
With targets set at: 36.55, 36.89, 37.32.
This analysis is based on the Initiative Analysis concept (IA).
Wishing you profitable trades!
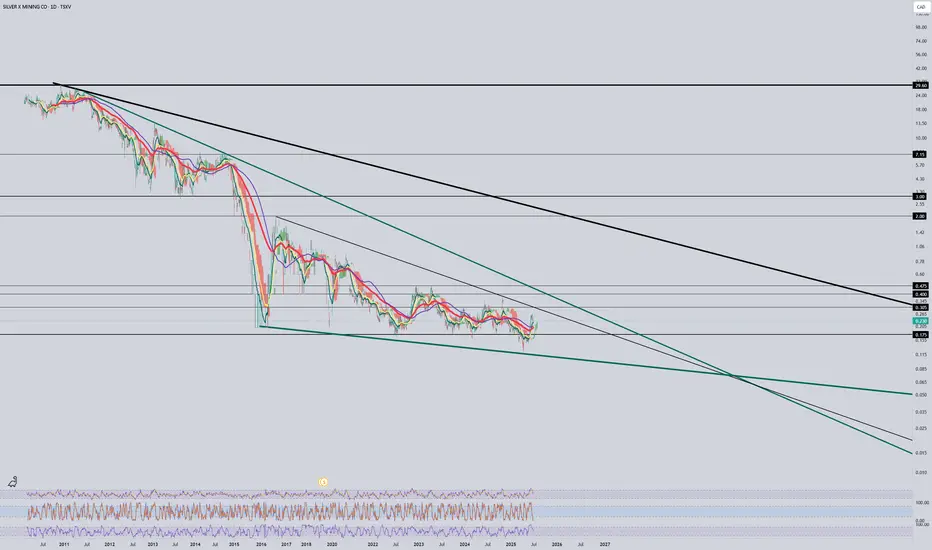
Silver X Mining: Grinding it outThis stock is still resting, and I think waiting for Silver to make it's move to $50 first. Until then, this will continue to grind sideways to lower. There's a lot to clear first.
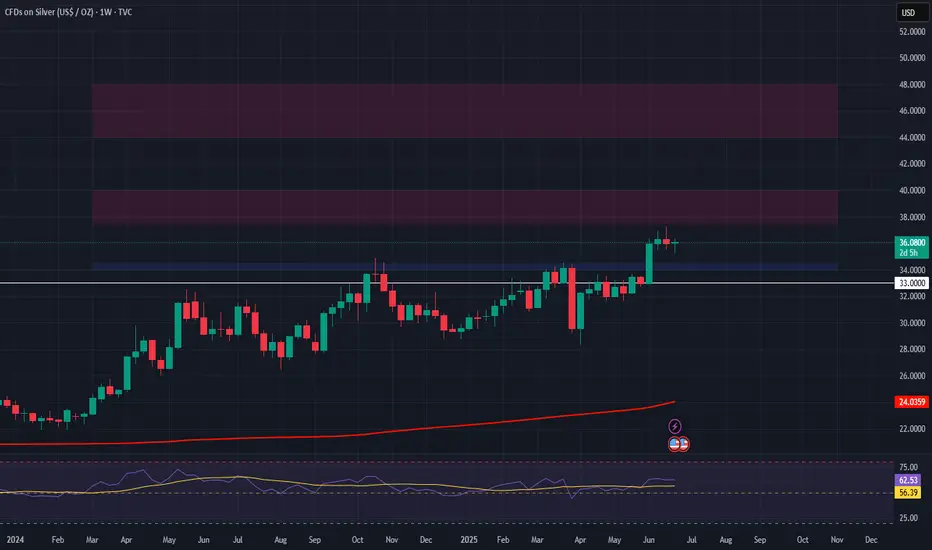
Silver Long Setup–Breakout Retest After Clearing Key ResistanceSilver TVC:SILVER has broken above the $34.50 resistance level, as it looks to catch up to the gold/silver ratio. We’re now watching for a retest of this breakout zone at $34.00–$34.50 for a potential long spot entry.
📌 Trade Setup:
• Entry Zone: $34.00 – $34.50
• Take Profit Targets:
o 🥇 $37.50 – $40.00
o 🥈 $44.00 – $48.00
• Stop Loss: Daily close below $33.00
SPY/QQQ Plan Your Trade for 6-25 : Breakaway PatternToday's Breakaway pattern suggests the SPY/QQQ may attempt to move into another breakaway price move - very similar to yesterday's price move.
I will add that I believe the SPY cycle patterns have already moved through a breakaway phase with the ceasefire news early this week. I believe the gap and breakaway move yesterday may be the breakaway trend we are expecting today.
That would suggest the markets could pause and pullback a bit over the next few days.
Gold and Silver are trying to find a bottom after the brief selling that took place over the past few days. I really do believe Gold and Silver are poised to make a big move higher.
Bitcoin is on a terror to the upside. But be cautious of the downward cycle channel that may prompt a rollover in BTCUSD near the $107,500 level.
I spend a little time near the end of this video highlighting my work on the Tesla 3-6-9 price theory and going over a few examples for my new book on trading.
Enjoy the quick look at some of the more advanced techniques I'm working to unlock for all of you.
Get some.
#trading #research #investing #tradingalgos #tradingsignals #cycles #fibonacci #elliotwave #modelingsystems #stocks #bitcoin #btcusd #cryptos #spy #gold #nq #investing #trading #spytrading #spymarket #tradingmarket #stockmarket #silver

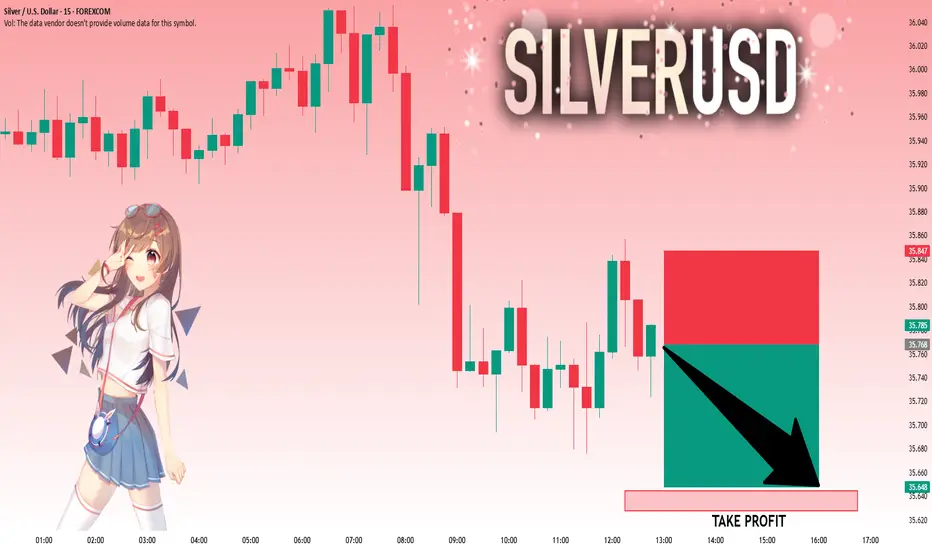
SILVER: Will Go Down! Short!
My dear friends,
Today we will analyse SILVER together☺️
The market is at an inflection zone and price has now reached an area around 35.768 where previous reversals or breakouts have occurred.And a price reaction that we are seeing on multiple timeframes here could signal the next move down so we can enter on confirmation, and target the next key level of 35.645..Stop-loss is recommended beyond the inflection zone.
❤️Sending you lots of Love and Hugs❤️
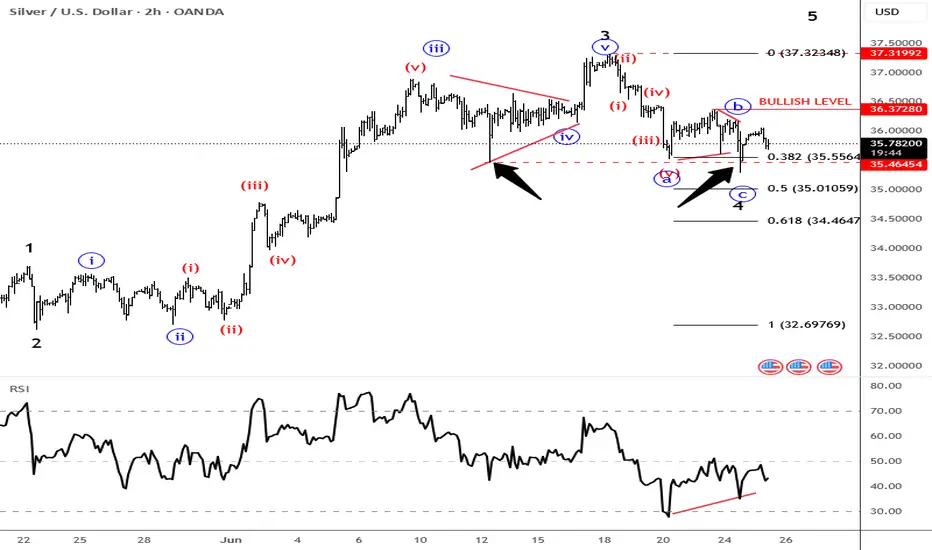
Silver Looking For A Support Of wave 4 at 36.37Silver retested the lows of the week and even broke slightly below the spike from June 12, where the market previously found support at 35.46. We highlighted that as a key area for potential stabilization, especially since there were likely a lot of stops, just below it. So it's no surprise that the market turned around from there and is now trying to stabilize. I’m starting to think the a-b-c drop could already be finished in wave 4.
A daily close above 36.37 would confirm a continuation higher.
We can also see some RSI divergence between waves A and C, which further suggests that silver may be coming down into strong support.