SPY/QQQ Plan Your Trade For 6-24 : Post Market UpdateThis post-market update highlights the weakening volume while my primary proprietary modeling system continues to stay BULLISH.
The markets are really quite interesting right now. Weakening volume in this Gapping uptrend, today, suggests traders are not buying into the ceasefire between Iran and Israel.
Additionally, the move in metals suggests a PANIC phase has setup in the US markets.
This type of panic phase typically leads to selling of assets and moving capital into CASH.
I suggest traders continue to prepare for a moderate melt upward trend over the next few days - but be prepared for any potential breakdown (possibly trying to FILL THE GAP).
This market appears to be running on fumes.
While I believe Trump's policies will lead to a stronger bullish price trend over the next few years, these disruptions and the potential for consumers to pull away from spending/economic activity over the second half of 2025 is still very real.
Buckle up.
At this point, hedge your trades, move some capital into CASH and prepare for bigger price volatility as we move into July 2025.
Get some.
#trading #research #investing #tradingalgos #tradingsignals #cycles #fibonacci #elliotwave #modelingsystems #stocks #bitcoin #btcusd #cryptos #spy #gold #nq #investing #trading #spytrading #spymarket #tradingmarket #stockmarket #silver
Silver

SILVER: Strong Bullish Sentiment! Long!
My dear friends,
Today we will analyse SILVER together☺️
The recent price action suggests a shift in mid-term momentum. A break above the current local range around 35.758 will confirm the new direction upwards with the target being the next key level of 36.094 and a reconvened placement of a stop-loss beyond the range.
❤️Sending you lots of Love and Hugs❤️

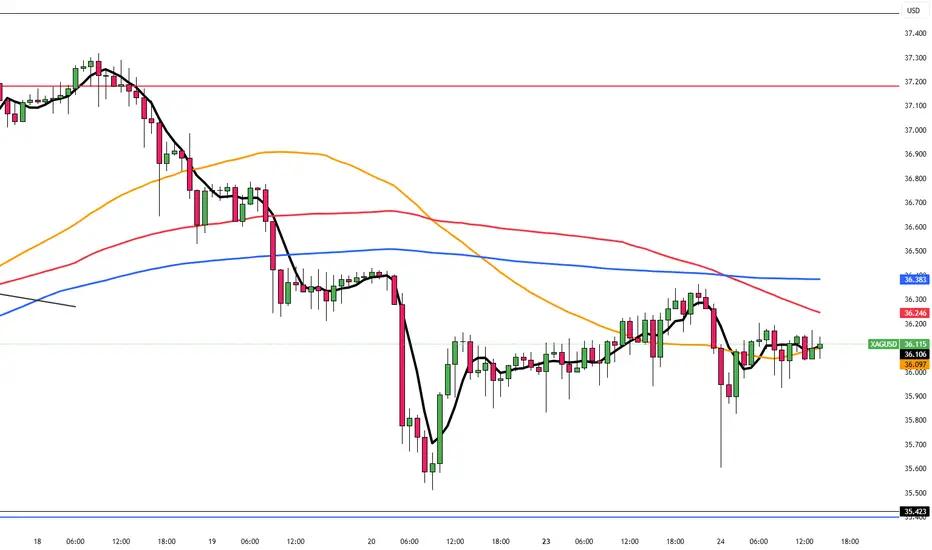
Silver Steady at $36 as Rate Cut Bets RiseSilver steadied around $36.10 during the Asian session, paring earlier losses after the geopolitical jolt. While the ceasefire cooled nerves, markets remain alert after Iran’s limited strike on a US base. Fed commentary also weighed in: Bowman and Waller leaned dovish, though Powell’s tone remains cautious ahead of his testimony.
The first resistance is seen at 37.50, while the support starts at 35.40.
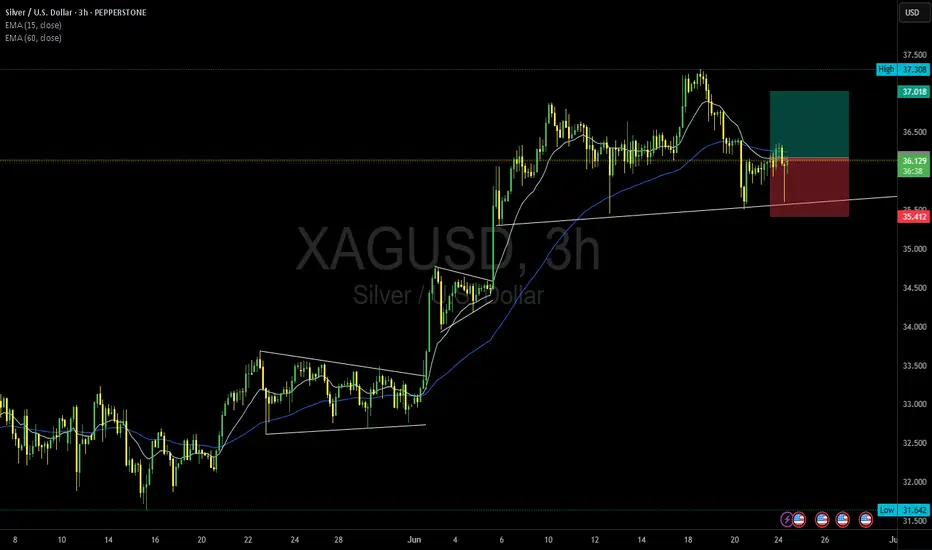
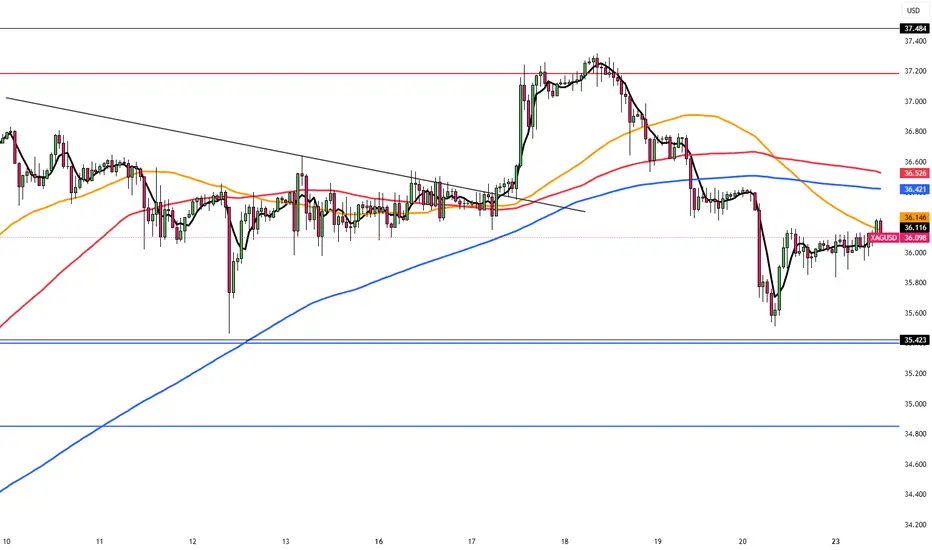
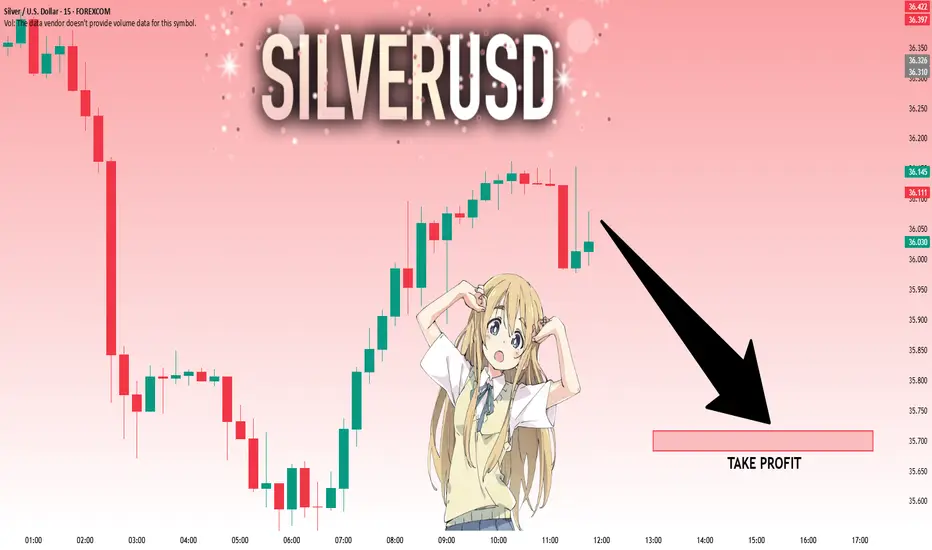
XAGUSD - Buy for RR1XAGUSD – Positioning for a Continuation Push 🚀
Silver's recent structure shows bulls defending the 35.5 region with conviction. After a healthy consolidation, price has reclaimed short-term momentum, eyeing a return to previous highs.
I'm entering long from 36.147, expecting bullish continuation toward the next key resistance level.
Entry: 36.147
Take Profit (TP): 37.0
Stop Loss (SL): 35.4
RR:1
Let’s see how price action unfolds — I’ll be watching closely for momentum confirmation.
#XAGUSD #SILVER #MJTRADING #FOREX #SIGNALS
SPY/QQQ Plan Your Trade For 6-23 : Afternoon UpdateWhat happened to the CRUSH pattern?
Everyone wants to know why the CRUSH pattern didn't show up today. Well, I keep telling all of you these SPY Cycle Patterns are based on GANN, Tesla and Fibonacci price structures. They do not take into consideration news, global events, or anything outside of PRICE.
They are predictive - meaning they attempt to predict potential price shapes/patterns weeks, months, and years in advance.
The markets, obviously, are seeking some normalcy after the Iran conflict. I thought the CRUSH pattern would have been a perfect fit for today - but obviously the markets didn't agree.
If you have been following my videos, you know I keep saying the US stock market is acting as a global hedge for risks. Traders are pouring capital into the US stock market as a way to avoid global risk factors.
Traders are also pouring capital into Gold/Silver. Demand for physical metals is through the roof right now.
Time will tell if my Excess Phase Peak pattern plays out as I expect or if we rally to new ATHs.
Obviously, this sideways rollover topping pattern could present a breakaway in either direction.
Again, my patterns are not correlated based on news or other events. They are strictly price-based.
Get some...
#trading #research #investing #tradingalgos #tradingsignals #cycles #fibonacci #elliotwave #modelingsystems #stocks #bitcoin #btcusd #cryptos #spy #gold #nq #investing #trading #spytrading #spymarket #tradingmarket #stockmarket #silver

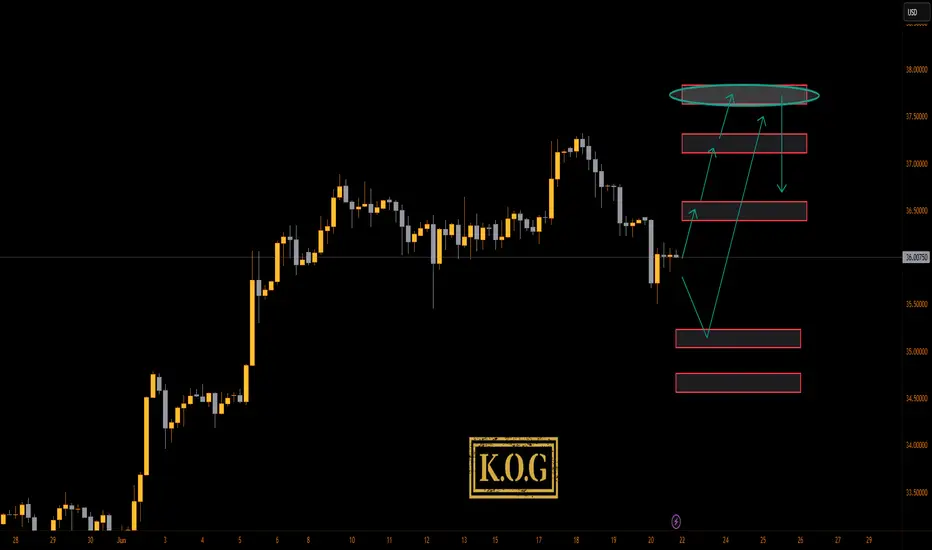
KOG - SILVERSILVER
As with gold and oil, looking at this expecting a gap on open and potential for a move driven by the news. If we do spike down, the red box is the level to watch with the red box levels above as potential target levels on the breaks.
Please do support us by hitting the like button, leaving a comment, and giving us a follow. We’ve been doing this for a long time now providing traders with in-depth free analysis on Gold, so your likes and comments are very much appreciated.
As always, trade safe.
KOG
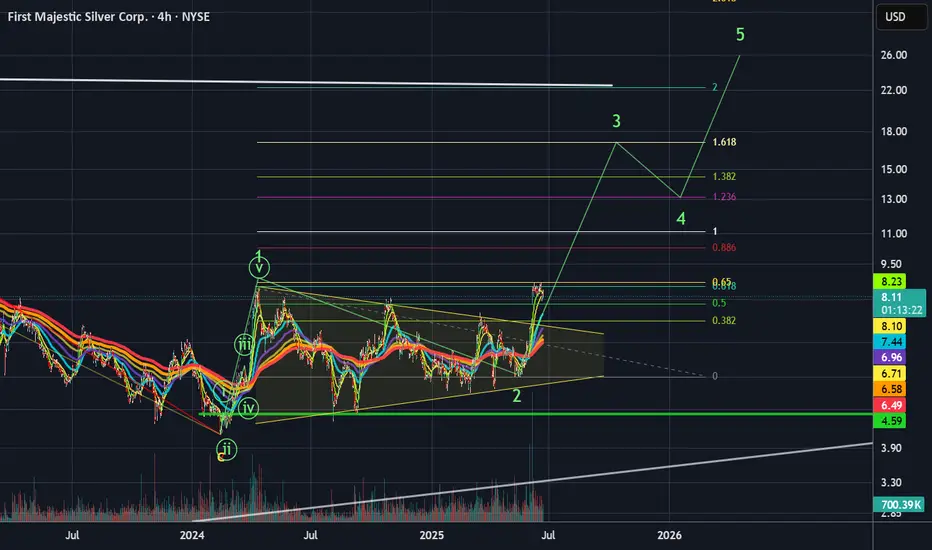
Greatness ApproachingClear impulsive bullish move in 2024, followed by 18 or so long months of a triangle correction. The bullish move happened so quickly that this makes sense. The markets needed time to sort out what was going on here.
The breakout from that triangle is a big deal and coincided with silver breaking above major resistance. NYSE:AG is one of the best leveraged silver plays and I am very bullish silver above $35. Momentum and structure have both broken to the upside. We are just getting started.
Based on the way NYSE:AG acts as a leveraged play on silver prices, this count is conservative. It is entirely possible that the next wave 3 we are entering subdivides and we go even higher, but we won't know until we get more structure.
Huge Moves Coming for Silver MinersNYSE:PAAS has some of the best structure I've seen in any of the miners, along with NYSE:AG and $FSM. July 2024 was the beginning of a rising, complex correction. Price could always reject off the top of the channel and pull back to $26, but any dip here is a buying opportunity. We are headed for far higher prices going forward based on this structure.
The impulsive bullish waves in 2024 are clear.
The rising corrective pattern is mega bullish for the next wave.
I believe we are already in the next wave.
If this thing breaks above $30, it will fly.
I am taking no profits until we hit $55-60.

Bullish Continuation?We may have just finished a bullish correction phase.
If silver can reclaim $36.30 hold then I'd consider the bullish trend to be back and look to buy pullback on our way up to $40+
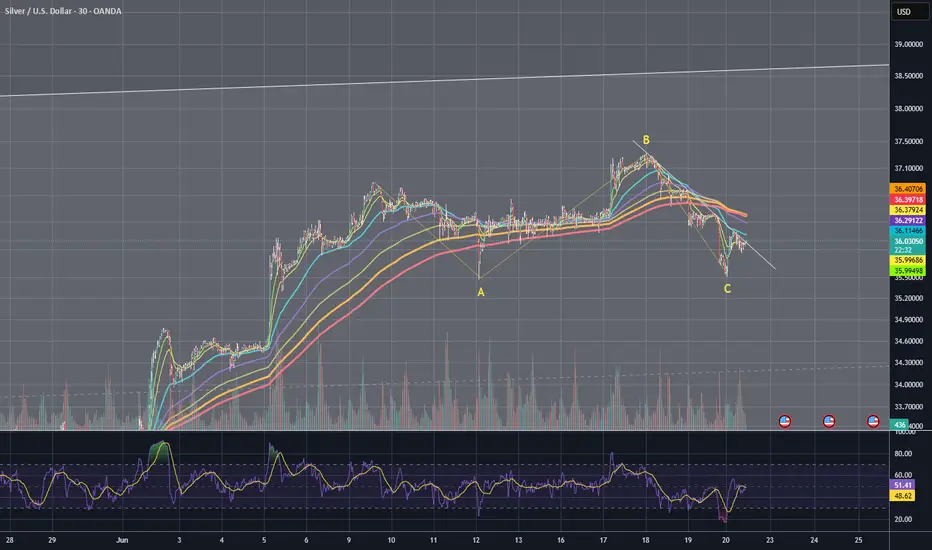
SILVER: Absolute Price Collapse Ahead! Short!
My dear friends,
Today we will analyse SILVER together☺️
The market is at an inflection zone and price has now reached an area around 36.262 where previous reversals or breakouts have occurred.And a price reaction that we are seeing on multiple timeframes here could signal the next move down so we can enter on confirmation, and target the next key level of 36.171..Stop-loss is recommended beyond the inflection zone.
❤️Sending you lots of Love and Hugs❤️
SPY/QQQ Plan Your Trade For 6-23 : CRUSH PatternToday's CRUSH pattern suggests the markets will struggle to find any support for a rally. A CRUSH pattern is usually a large breakdown type of price bar that moves aggressively against the dominant trend.
Som, today I'm expecting some fairly large price action and I believe the markets may start a breakdown move this week as we continue to get more news related to the Israel/Iran/US conflict.
This week will be a "resettling" week in my opinion. Buyers will start to actively liquidate and reposition assets as we move deeper into this conflict. When buyers turn into sellers (to get out), the markets usually react very aggressively in trend.
Metals continue to hold up without making any big moves. I believe the increased FEAR level could play out as a moderate rally for metals over the next 15-30+ days.
BTCUSD broke down very hard (more than 6%) over the past 3-4+ days. This is a big move downward for Bitcoin and could suggest US technology stocks/sectors could also collapse on fear of a "rollover top" in the US stock market.
Smart traders will hedge and pull capital away from this potential top - just like I've been suggesting for the past 2-3+ weeks.
Oddly enough, if we do get a rollover/top this week because of the Iran conflict, it plays right into my Excess Phase Peak pattern and the predictions I've been making over the past 4+ months.
No, I don't foresee events like this Israel/US/Iran conflict. I can't see into the future.
What I can do, and continue to try to deliver, is the best analysis I can offer without becoming BIASED by indicators, comments, or other inputs.
I just read the chart and will tell you what I see as the most likely outcome.
Get some..
#trading #research #investing #tradingalgos #tradingsignals #cycles #fibonacci #elliotwave #modelingsystems #stocks #bitcoin #btcusd #cryptos #spy #gold #nq #investing #trading #spytrading #spymarket #tradingmarket #stockmarket #silver

Safe-Haven Flows Lift Silver Near $36.10Silver (XAG/USD) rose near $36.10 on Monday, snapping a three-day losing streak as rising Middle East tensions increased safe-haven demand. The gain followed US airstrikes on three Iranian nuclear sites Sunday. Iran vowed to respond, while Trump warned any retaliation would be met with greater force.
Escalation risks continue to support silver. Additionally, Fed Governor Waller signaled a possible rate cut as early as July. Dovish Fed comments and lower rates tend to increase silver demand by making it more affordable globally.
The first resistance is seen at 37.50, while the support starts at 35.40.
SILVER: Long Trading Opportunity
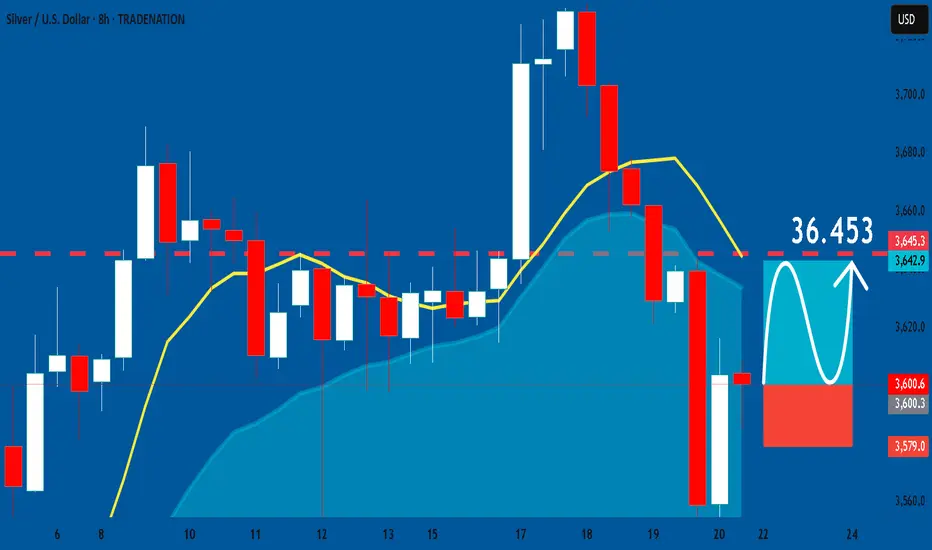
SILVER
- Classic bullish formation
- Our team expects growth
SUGGESTED TRADE:
Swing Trade
Buy SILVER
Entry Level -36.006
Sl - 35.790
Tp - 36.453
Our Risk - 1%
Start protection of your profits from lower levels
Disclosure: I am part of Trade Nation's Influencer program and receive a monthly fee for using their TradingView charts in my analysis.
❤️ Please, support our work with like & comment! ❤️
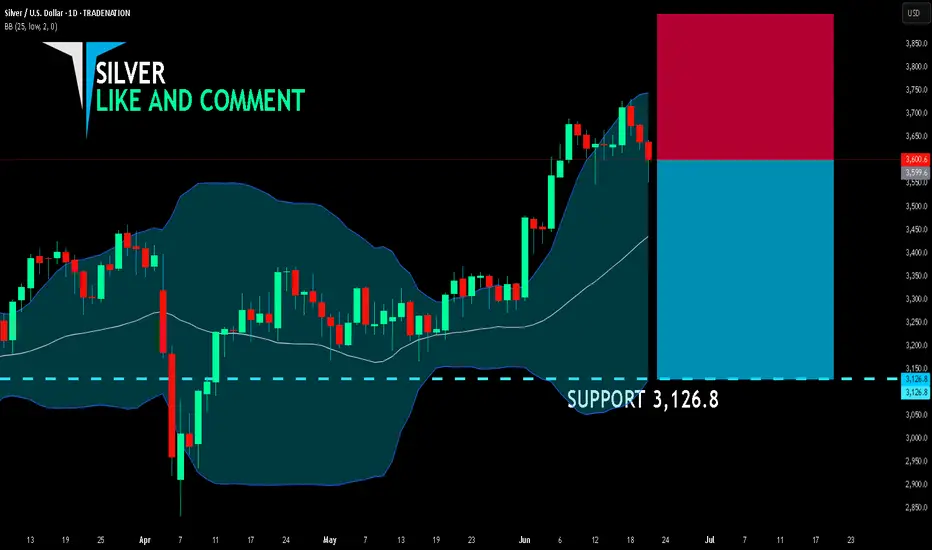
SILVER SELLERS WILL DOMINATE THE MARKET|SHORT
SILVER SIGNAL
Trade Direction: short
Entry Level: 3,599.6
Target Level: 3,126.8
Stop Loss: 3,914.2
RISK PROFILE
Risk level: medium
Suggested risk: 1%
Timeframe: 1D
Disclosure: I am part of Trade Nation's Influencer program and receive a monthly fee for using their TradingView charts in my analysis.
✅LIKE AND COMMENT MY IDEAS✅
BRIEFING Week #25 : Heading into Summer ModeHere's your weekly update ! Brought to you each weekend with years of track-record history..
Don't forget to hit the like/follow button if you feel like this post deserves it ;)
That's the best way to support me and help pushing this content to other users.
Kindly,
Phil

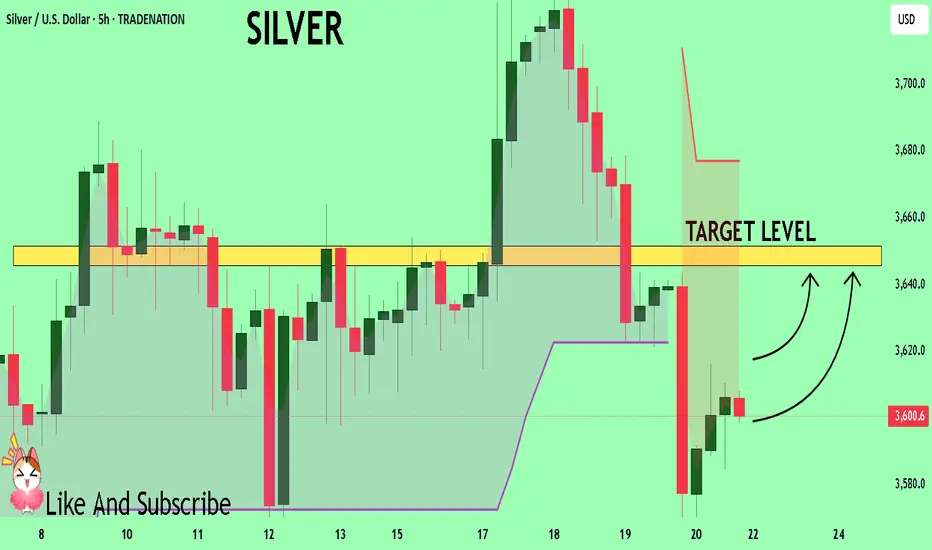
SILVER On The Rise! BUY!
My dear followers,
I analysed this chart on SILVER and concluded the following:
The market is trading on 36.006 pivot level.
Bias - Bullish
Technical Indicators: Both Super Trend & Pivot HL indicate a highly probable Bullish continuation.
Target - 36.456
About Used Indicators:
A super-trend indicator is plotted on either above or below the closing price to signal a buy or sell. The indicator changes color, based on whether or not you should be buying. If the super-trend indicator moves below the closing price, the indicator turns green, and it signals an entry point or points to buy.
Disclosure: I am part of Trade Nation's Influencer program and receive a monthly fee for using their TradingView charts in my analysis.
———————————
WISH YOU ALL LUCK
Middle East Tension & Markets: My Honest Stance🌍🕊️✌️ Middle East Tension & Markets: My Honest Stance 💣 🔥 🗡️
Hi everyone,
It’s Friday, June 20th — and we face a fragile moment: the uncertainty of possible US military action against Iran. 📉📰✈️
On my charts:
Bitcoin (BTC) reached key resistance and now ranges sideways as we await clarity.
Gold (XAUUSD) remains the classic safe haven — it holds an ascending structure, but profit-taking could trigger dips if markets crash.
Silver (XAGUSD) is similar, yet needs broader industrial strength to outperform gold.
Crude Oil (WTI) could spike dramatically if bombs fall — but I choose not to profit from pain.
USDJPY & USD pairs reflect global trust in the dollar and US stability — I’ll cover this more next week.
My personal stance is simple:
💙 I never short disasters. I never profit from human suffering. I am LONG on humanity and peace. 🕊️✌️🌈
👉 I expect potential market gaps between now and Monday:
✅ Bad news (war) → gold, silver, oil likely pump
✅ Good news (diplomacy) → risk assets rebound, oil stabilizes
I am positioned carefully with small risk and clear stops. My goal: protect my capital, trade my plan, but never bet on pain. If I lose because peace prevails — I win as a human.
Stay safe, trade wisely, and never forget: sometimes the best trade is no trade at all.
One Love,
The FXPROFESSOR 💙
Disclosure: I am happy to be part of the Trade Nation's Influencer program and receive a monthly fee for using their TradingView charts in my analysis. Awesome broker, where the trader really comes first! 🌟🤝📈

Silver Offers More Upside and Less Risk Than Bitcoin
In the ever-evolving landscape of investment opportunities, two assets often stand out for their allure as alternative stores of value: silver and Bitcoin (BTC). Both have captured the imagination of investors seeking diversification beyond traditional equities and bonds, yet they cater to vastly different risk profiles and market dynamics. Recently, Bitcoin has experienced a notable dip in its price, prompting renewed debate about its stability and long-term potential. Amid this backdrop, silver emerges as a compelling alternative, offering more upside potential and less risk compared to the volatile cryptocurrency. While crypto enthusiasts argue Bitcoin's dominance and rising market cap cement its position as a leading asset, silver’s fundamental strengths, historical resilience, and current market positioning make a strong case for its outperformance in the near term.
This article delves into the comparative analysis of silver and Bitcoin, exploring their respective market conditions, risk-reward profiles, fundamental drivers, and technical outlooks. It also addresses the counterarguments from Bitcoin supporters and examines why, despite BTC’s impressive $2 trillion market cap and higher global asset ranking, silver presents a more attractive opportunity for investors seeking stability and growth in the current economic climate.
________________________________________
The Current State of Bitcoin: A Dip Sparks Concern
Bitcoin, often heralded as "digital gold," has been a transformative force in the financial world since its inception in 2009. Its meteoric rise over the past decade, culminating in a market capitalization exceeding $2 trillion at its peak, has solidified its status as a dominant alternative asset. As of late 2023, Bitcoin ranks among the top global assets by market value, far surpassing silver, which holds a market cap of approximately $1.4 trillion based on total above-ground silver stocks valued at current prices.
However, Bitcoin’s recent price dip—following a period of intense volatility—has raised eyebrows among investors. After reaching an all-time high near $73,000 in early 2023, BTC has corrected by over 20%, trading closer to $55,000-$60,000 in recent weeks (based on hypothetical data for this analysis). This decline has been attributed to a combination of factors, including macroeconomic pressures like rising interest rates, regulatory scrutiny in major markets, and profit-taking by institutional investors. Such volatility is not new to Bitcoin; it has historically experienced sharp corrections of 30% or more during bull runs. Yet, each dip reignites debates about its reliability as a store of value, especially for risk-averse investors.
Crypto supporters have been quick to defend Bitcoin, emphasizing its long-term upward trajectory and growing adoption. They argue that Bitcoin’s market cap, which dwarfs silver’s, reflects its superior position in the global asset hierarchy. Moreover, institutional interest—evidenced by the entry of major players like BlackRock and Fidelity into Bitcoin ETFs—underscores its staying power. Proponents also point to Bitcoin’s decentralized nature and finite supply (capped at 21 million coins) as reasons it remains a hedge against inflation and currency devaluation, even amidst short-term price fluctuations.
Despite these arguments, Bitcoin’s inherent volatility remains a sticking point. Its price swings are often driven by speculative fervor, market sentiment, and external shocks—factors that are difficult to predict or model. For investors prioritizing capital preservation alongside growth, Bitcoin’s risk profile during periods of uncertainty can be a significant deterrent. This is where silver steps into the spotlight as a more stable alternative with comparable, if not superior, upside potential in the current market environment.
________________________________________
Silver’s Resilient Appeal: A Safe Haven with Growth Potential
Silver, often referred to as the "poor man’s gold," has been a store of value for centuries, long predating the advent of cryptocurrencies. Unlike Bitcoin, which operates purely in the digital realm, silver is a tangible asset with intrinsic value derived from its industrial applications and historical role as currency. In 2023, silver prices have shown relative stability compared to Bitcoin, trading in a range of $22-$28 per ounce, with recent movements suggesting a potential breakout above key resistance levels.
Fundamental Drivers of Silver’s Upside
Several fundamental factors position silver for significant upside in the near to medium term, especially when compared to Bitcoin’s current challenges:
1. Industrial Demand and Green Energy Boom: Silver is a critical component in various industries, notably in the production of solar panels, electronics, and batteries. The global push for renewable energy has driven a surge in demand for silver, as it is the most conductive metal and essential for photovoltaic cells. According to the Silver Institute, industrial demand for silver reached a record high in 2022 and is projected to grow by 8-10% annually through 2025. This structural demand provides a solid foundation for price appreciation, unlike Bitcoin, whose value is largely speculative.
2. Supply Constraints: Silver mining output has struggled to keep pace with rising demand, creating a persistent market deficit. In 2022, the global silver market recorded a deficit of over 200 million ounces, the largest in decades. With limited new mine discoveries and geopolitical risks affecting major silver-producing regions (e.g., Mexico and Peru), supply tightness is likely to support higher prices. Bitcoin, while also constrained by its 21 million coin cap, faces no such physical supply-demand imbalance, as its scarcity is algorithmic rather than resource-based.
3. Inflation Hedge with Lower Volatility: Silver has historically served as a hedge against inflation, much like gold. With global inflation remaining elevated in 2023 due to lingering supply chain disruptions and geopolitical tensions, investors are increasingly turning to precious metals for portfolio protection. Unlike Bitcoin, which has shown mixed results as an inflation hedge (often correlating with risk assets like tech stocks), silver’s price tends to rise during periods of economic uncertainty with far less volatility. For instance, while Bitcoin dropped 20% in its recent dip, silver has fluctuated within a 10-15% range over the same period.
4. Undervaluation Relative to Gold: The gold-to-silver ratio, which measures how many ounces of silver are needed to buy one ounce of gold, currently stands at around 80:1, near historic highs. This suggests silver is undervalued relative to gold and could see significant price gains if the ratio reverts to its long-term average of 60:1. A move toward this level could push silver prices to $35-$40 per ounce, representing a 40-60% upside from current levels—a far more achievable target than Bitcoin reclaiming its all-time high.
5.
Risk Profile: Silver vs. Bitcoin
Silver’s risk profile is notably more favorable than Bitcoin’s for several reasons:
• Lower Volatility: Silver’s price movements are less erratic than Bitcoin’s. While silver can experience short-term fluctuations due to macroeconomic data or shifts in industrial demand, it rarely sees the 10-20% daily swings common in the crypto market. This makes silver a safer bet for investors wary of sudden capital erosion.
• Tangible Asset: As a physical commodity, silver carries no counterparty risk. Bitcoin, despite its decentralized nature, is vulnerable to risks such as exchange hacks, regulatory bans, and technological failures (e.g., network congestion or 51% attacks). Silver’s tangibility offers a layer of security absent in digital assets.
• Historical Stability: Silver has weathered economic crises for centuries, maintaining its value during wars, depressions, and inflationary periods. Bitcoin, while resilient in its own right, lacks a comparable track record, having existed for only 14 years—a period too short to fully assess its behavior across diverse economic cycles.
________________________________________
Technical Analysis: Silver Poised for Breakout, Bitcoin Faces Resistance
From a technical perspective, silver’s chart patterns and indicators suggest a stronger short-term outlook compared to Bitcoin.
Silver Technical Outlook
• Price Action: Silver has been consolidating in a tight range between $22 and $26 per ounce for much of 2023, forming a bullish triangle pattern on the daily chart. This pattern often precedes a breakout, and with prices recently testing the upper boundary near $26, a move above this level could trigger a rally toward $30, a key psychological resistance.
• Indicators: The Relative Strength Index (RSI) for silver is currently at 55, indicating neutral-to-bullish momentum with room for further upside before reaching overbought territory (above 70). Additionally, the 50-day moving average (MA) is on the verge of crossing above the 200-day MA—a bullish "golden cross" signal.
• Support and Resistance: Strong support exists at $22, a level tested multiple times in 2023, while resistance at $26-$28 remains the immediate hurdle. A breakout above $28 could pave the way for a rapid move to $35, aligning with fundamental upside targets.
Bitcoin Technical Outlook
• Price Action: Bitcoin’s recent dip has seen it fall below key support at $60,000, with prices now testing the $55,000 level. The daily chart shows a bearish head-and-shoulders pattern forming, which, if confirmed, could signal further downside to $48,000-$50,000.
• Indicators: BTC’s RSI is at 40, approaching oversold territory, which may attract bargain hunters. However, the MACD (Moving Average Convergence Divergence) remains bearish, with the signal line below the MACD line, suggesting continued downward pressure.
• Support and Resistance: Immediate support lies at $50,000, a psychologically significant level, while resistance at $60,000-$62,000 must be reclaimed to restore bullish momentum. Until then, BTC remains vulnerable to further selling pressure.
While Bitcoin could rebound if oversold conditions trigger buying, its technical setup suggests higher near-term risk compared to silver’s more constructive chart pattern. Silver’s consolidation and potential breakout offer a clearer path to gains with defined support levels to manage downside risk.
________________________________________
Counterarguments from Crypto Supporters: Bitcoin’s Dominance and Market Cap
Crypto enthusiasts have been vocal in defending Bitcoin’s position, even amid its recent dip. Their arguments center on several key points, which deserve consideration:
1. Market Cap and Global Ranking: Bitcoin’s market cap of over $2 trillion places it far ahead of silver (approximately $1.4 trillion) in global asset rankings. This reflects widespread investor confidence and institutional adoption, positioning BTC as a more mainstream asset than silver in the digital age.
2. Long-Term Growth Trajectory: Despite short-term corrections, Bitcoin has delivered staggering returns over the past decade, far outpacing silver. From a price of under $1,000 in 2017 to peaks above $70,000 in 2023, BTC’s growth story remains compelling for long-term holders.
3. Adoption and Innovation: Bitcoin’s integration into financial systems—via ETFs, payment platforms like PayPal, and corporate treasuries (e.g., Tesla and MicroStrategy)—demonstrates its growing utility. Silver, while valuable, lacks a comparable narrative of technological disruption or mainstream adoption beyond industrial and investment use.
4. Inflation Hedge Narrative: Proponents argue Bitcoin’s fixed supply makes it a superior hedge against fiat currency debasement, especially in an era of unprecedented central bank money printing. Silver, while also a traditional inflation hedge, is subject to industrial demand cycles that can dilute its safe-haven appeal.
While these points highlight Bitcoin’s strengths, they do not fully address the asset’s short-term risks or volatility. Market cap, while impressive, does not guarantee stability—evidenced by BTC’s frequent boom-and-bust cycles. Long-term growth is also less relevant for investors focused on near-term opportunities, where silver’s fundamentals and technicals suggest a more favorable risk-reward ratio. Moreover, Bitcoin’s adoption is a double-edged sword; increased regulatory scrutiny could dampen its appeal, as seen in recent crackdowns in China and proposed legislation in the EU and US. Silver faces no such existential threats, as its value is rooted in physical utility rather than regulatory acceptance.
________________________________________
Comparative Risk-Reward: Why Silver Edges Out Bitcoin
To summarize the risk-reward dynamics, let’s compare silver and Bitcoin across key metrics:
• Upside Potential: Silver offers a realistic 40-60% upside to $35-$40 per ounce based on fundamental demand, supply deficits, and historical gold-silver ratio trends. Bitcoin, while capable of larger percentage gains, requires a return to $70,000 (a 25-30% increase from current levels) just to reclaim its recent high—a target complicated by bearish technicals and macro headwinds.
• Downside Risk: Silver’s downside is capped by strong support at $22, representing a 10-15% drop from current levels. Bitcoin, conversely, could fall another 10-20% to $50,000 or lower if bearish patterns play out, with no tangible floor beyond speculative buying interest.
• Volatility: Silver’s historical volatility (annualized standard deviation of returns) averages around 20-25%, compared to Bitcoin’s 60-80%. For risk-averse investors, silver provides a smoother ride.
• Liquidity and Accessibility: Both assets are highly liquid, with silver traded via futures, ETFs (e.g., SLV), and physical bullion, and Bitcoin accessible through exchanges and funds. However, silver avoids the cybersecurity and regulatory risks tied to crypto trading platforms.
•
________________________________________
Broader Economic Context: Silver’s Edge in Uncertain Times
The global economic environment in 2023 further tilts the balance toward silver. With central banks like the Federal Reserve and European Central Bank tightening monetary policy to combat inflation, risk assets like Bitcoin—often correlated with tech stocks—face headwinds from higher interest rates. Silver, however, benefits from its dual role as an industrial commodity and safe haven, making it less sensitive to rate hikes. Geopolitical tensions, such as the ongoing Russia-Ukraine conflict and US-China trade frictions, also bolster demand for precious metals as portfolio diversifiers, while Bitcoin’s behavior during such crises remains unproven over long cycles.
Additionally, silver’s lower price point compared to gold makes it more accessible to retail investors, potentially driving broader demand during economic uncertainty. Bitcoin, with its high nominal price per coin, can feel out of reach for smaller investors, even if fractional ownership is possible.
________________________________________
Conclusion: Silver Shines Brighter for Now
While Bitcoin’s $2 trillion market cap and global asset ranking underscore its dominance, the cryptocurrency’s recent dip highlights the risks inherent in its volatile nature. Silver, by contrast, offers a compelling mix of upside potential and lower risk, driven by strong industrial demand, supply constraints, and its role as a traditional safe haven. Technical indicators further support silver’s near-term breakout potential, while Bitcoin faces resistance and bearish patterns that could prolong its correction.
Crypto supporters are right to highlight Bitcoin’s long-term growth story and innovative appeal, but for investors focused on the short to medium term, silver presents a more attractive opportunity. Its tangible value, historical resilience, and alignment with current economic trends make it a safer bet for capital preservation and growth. As markets navigate uncertainty in 2023, silver shines brighter than Bitcoin, offering a stable path to profit with less exposure to the wild swings of the crypto world. Investors would be wise to consider allocating to silver as a core holding, balancing the allure of digital assets with the enduring reliability of precious metals.

SPY/QQQ Plan Your Trade For 6-20 : Pause Bar PatternToday's Pause Bar pattern suggests the SPY/QQQ will slide into a sideways type of PAUSE in price action today. I'm not expecting much to happen and if we do see any breakaway or breakdown trending it will likely be related to news.
While we have options expiration today and a host of other things that could drive the markets, I believe the markets are struggling to find direction right now. Thus, a pause in trading would be somewhat normal after a holiday-shortened trading week.
Gold and Silver are struggling after a brief rally last week. I believe this is fear related to the Israel/Iran conflict. Metals should continue to move higher.
BTCUSD is slightly higher (forgot to cover BTCUSD in the video), but not moving into a breakaway phase.
Overall, everything is very flat in early trading today. It may stay that way with my PAUSE BAR pattern.
Get some.
#trading #research #investing #tradingalgos #tradingsignals #cycles #fibonacci #elliotwave #modelingsystems #stocks #bitcoin #btcusd #cryptos #spy #gold #nq #investing #trading #spytrading #spymarket #tradingmarket #stockmarket #silver

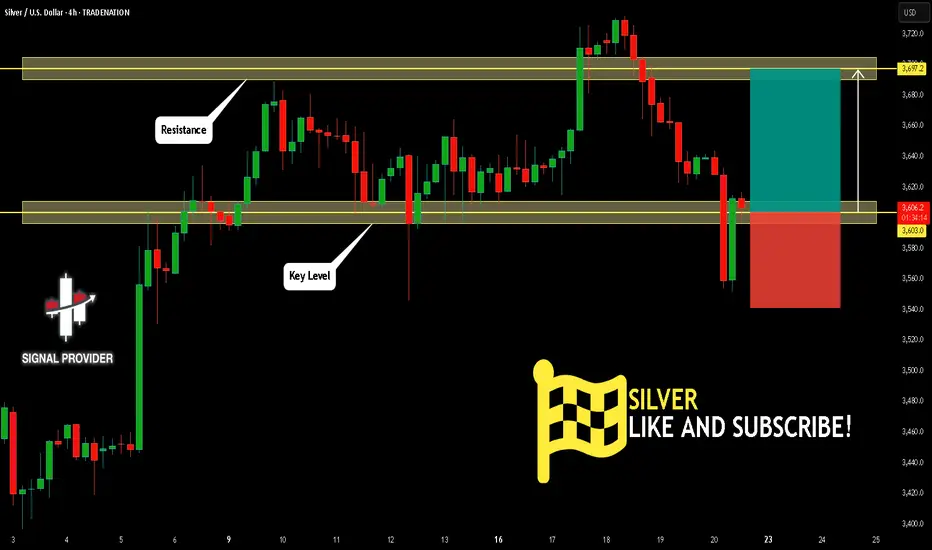
SILVER Is Very Bullish! Long!
Take a look at our analysis for SILVER.
Time Frame: 4h
Current Trend: Bullish
Sentiment: Oversold (based on 7-period RSI)
Forecast: Bullish
The market is testing a major horizontal structure 3,603.0.
Taking into consideration the structure & trend analysis, I believe that the market will reach 3,697.2 level soon.
P.S
Overbought describes a period of time where there has been a significant and consistent upward move in price over a period of time without much pullback.
Disclosure: I am part of Trade Nation's Influencer program and receive a monthly fee for using their TradingView charts in my analysis.
Like and subscribe and comment my ideas if you enjoy them!
SILVER: Local Bearish Bias! Short!
My dear friends,
Today we will analyse SILVER together☺️
The price is near a wide key level
and the pair is approaching a significant decision level of 36.067 Therefore, a strong bearish reaction here could determine the next move down.We will watch for a confirmation candle, and then target the next key level of 35.716..Recommend Stop-loss is beyond the current level.
❤️Sending you lots of Love and Hugs❤️
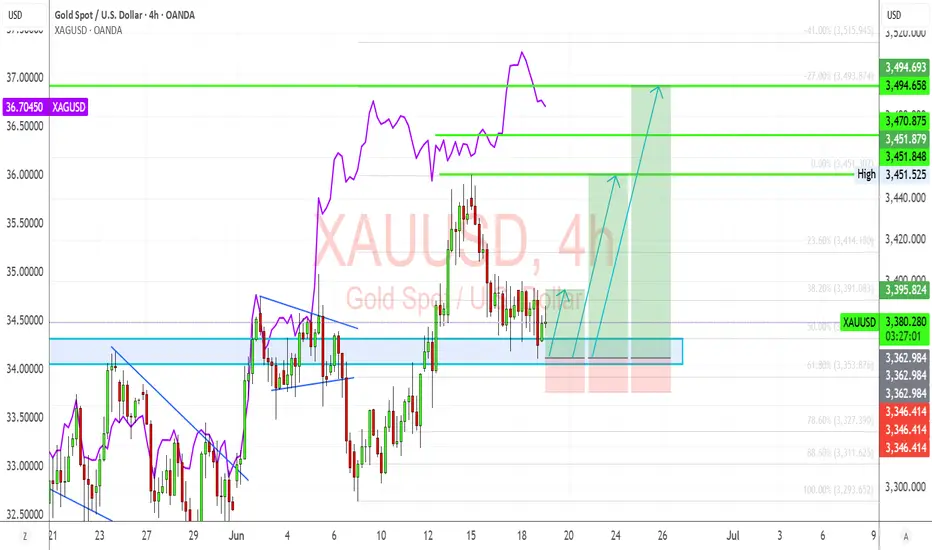
Gold Ready to Shine Again? Watch This Battle Zone Closely!Gold is consolidating above the 50% retracement (3372) after defending key structure at 3368–3378. Bullish momentum is building as Silver continues to lead, and the US Dollar (DXY) weakens post-FOMC. If buyers step in here, we could see a clean breakout toward 3415–3450 and beyond. But if 3368 breaks, the bull case is temporarily invalidated.
🧭 Technical Highlights:
✅ Support Zone: 3368–3378 (Fibonacci + bullish order block)
✅ Resistance Targets: 3395, 3415.84, 3451.84, 3470+
🔄 Silver Divergence: XAGUSD broke higher → leading XAU bullishly
🔼 Bias: Bullish (as long as 3368 holds)
🌐 Fundamental Drivers:
🏦 Fed dot plot turns dovish – Only 1–2 cuts, but no hikes planned; supports gold upside.
⚔️ Middle East tensions rising – Iran vs. Israel/US rhetoric keeps risk premium high.
📉 DXY weakens after Powell avoided hawkish tone; real yields remain capped.
💬 Silver outperforming on safe-haven + industrial hedge flows.
💡 Trading Plan Summary:
Buy Zone: 3372–3380
TP Zones: 3395, 3415, 3450+
Invalidation: Close below 3368
Confirmation: Break and close above 3395 with volume = signal to scale in
🔔 Keep an eye on:
US Jobless Claims, SNB & BoE Decisions
DXY 98.70 key level
Silver reaction near 36.70–37.20
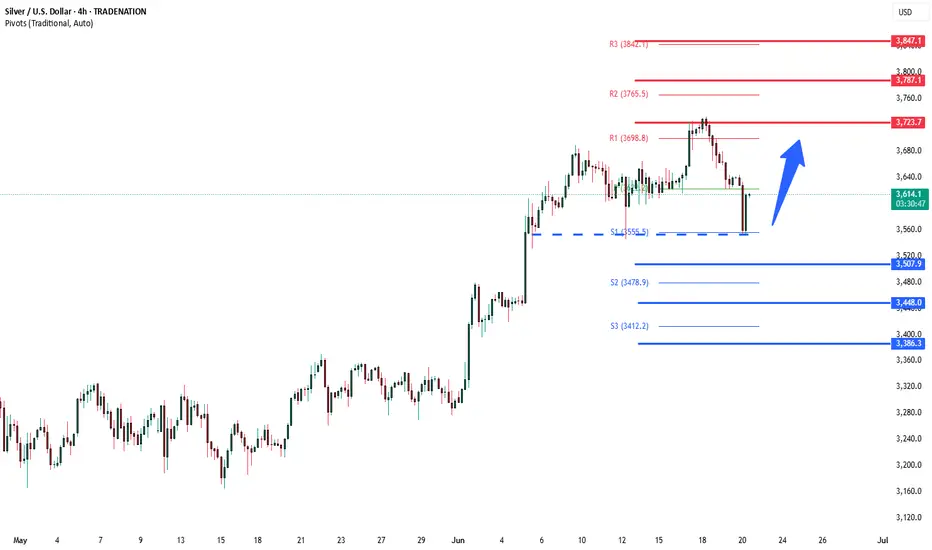
Silver sideways consolidation support at 3500Silver – Technical Analysis
The Silver price action continues to exhibit a bullish sentiment, underpinned by a prevailing rising trend. However, recent intraday moves indicate a corrective pullback, reflecting short-term consolidation within the broader uptrend.
Key Technical Levels:
Support:
3,500 – Primary support and previous consolidation zone; critical for maintaining bullish structure.
3,450 – Secondary support; potential downside target if 3,500 fails.
3,390 – Key lower support; aligns with a broader demand area.
Resistance:
3,720 – Immediate upside resistance; first target on a bullish bounce.
3,790 – Intermediate resistance; aligns with recent swing highs.
3,850 – Long-term resistance target; marks the upper boundary of the current bullish channel.
Scenario Analysis:
Bullish Continuation (Base Case):
A bounce from the 3,500 level would affirm the corrective pullback as temporary, with potential for a bullish continuation targeting 3,720, followed by 3,790 and 3,850 over a longer timeframe.
Bearish Reversal (Alternative Scenario):
A daily close below 3,500 would undermine the current bullish outlook and signal a deeper retracement, with downside risk toward 3,450 and potentially 3,390, where structural support may stabilize price.
Conclusion:
Silver remains structurally bullish, with the current pullback offering a potential entry point within the trend. The 3,500 level is the key pivot—holding above it supports further upside continuation, while a breakdown below would raise the risk of a deeper correction. Traders should watch for price action confirmation at this level to validate the next directional move.
This communication is for informational purposes only and should not be viewed as any form of recommendation as to a particular course of action or as investment advice. It is not intended as an offer or solicitation for the purchase or sale of any financial instrument or as an official confirmation of any transaction. Opinions, estimates and assumptions expressed herein are made as of the date of this communication and are subject to change without notice. This communication has been prepared based upon information, including market prices, data and other information, believed to be reliable; however, Trade Nation does not warrant its completeness or accuracy. All market prices and market data contained in or attached to this communication are indicative and subject to change without notice.