Silver Multi-Timeframe Analysis 30.01Hello Traders,
welcome to this free and educational technical analysis .
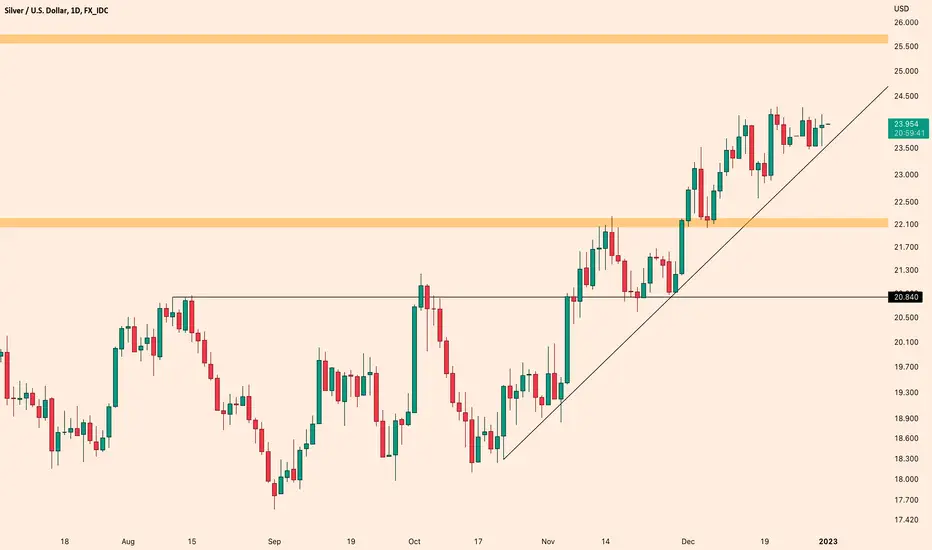
Silver is currently testing a very strong weekly support/resistance area amd after this massive runup there is the possibility that we will see a short term correction away from the zone.
On the daily timeframe you can see a beautiful distribution phase, where the market is starting to create lower highs and lower lows, so I am now just waiting for a break of the very strong previous support zone and then a retest,
and then I will definitely enter a short to capitalize on the continuation to the downside.
Thank you for watching and I will see you tomorrow!
You can also check out my previous analysis of this asset:
Silvercharts

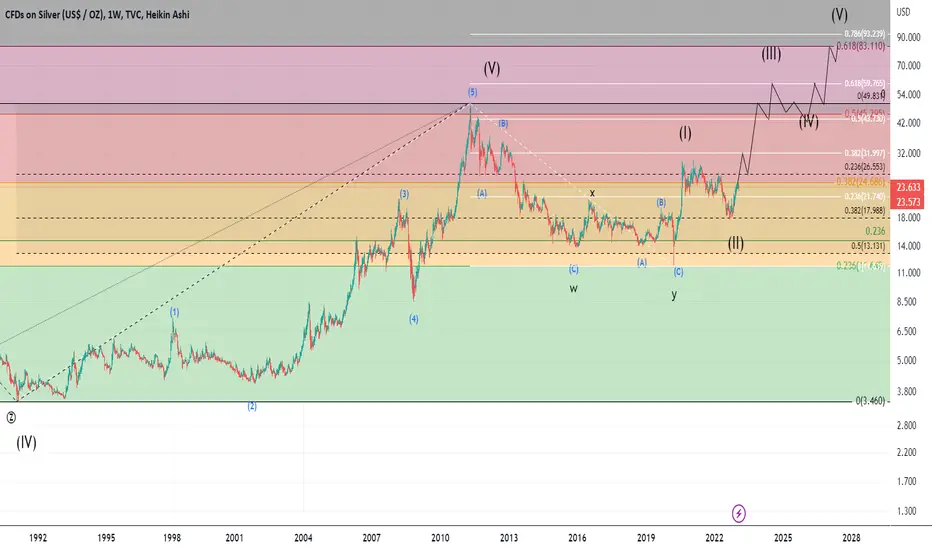
The Road to $80 for SilverThe silver market began the initial subwave of a new, major impulsive wave, marked as the third in a sequence. This cyclical pattern can be traced back to the year 1932, with the completion of wave one in 1968, the corrective wave two in 1971, the impulsive wave three in January 1980, the corrective wave four in 1991, and ultimately, a truncated fifth wave that reached its peak in April 2011. This entire sequence can be considered as the first impulsive wave in an even higher degree. The second corrective wave ended in March 2020, with support being found at the 0.236 Fibonacci level. Currently, silver is preparing for what is expected to be the most explosive and unpredictable impulsive wave three in a very long-term scale.
Resistance points include:
— $24.69 (0.382 Fibonacci extension)
— $26.55 (0.238 Fibonacci extension)
— $31.99 (0.382 Fibonacci extension, last wave)
— $43.73 (0.5 Fibonacci extension, last wave)
— $45.29 (0.382 Fibonacci extension level)
— $49.83 (all-time high)
— $59.77 (0.618 Fibonacci extension, last wave)
— $83.11 (0.618 Fibonacci; golden ratio)
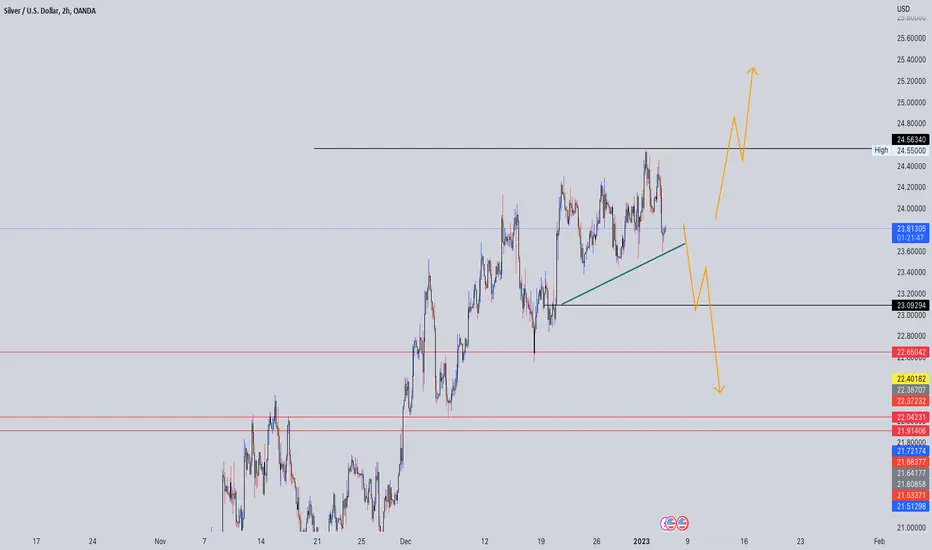
SILVER (XAGUSD): Key Levels to Watch 🪙
Here is my latest structure analysis for Silver.
Resistance 1: 24.27 - 24.55 area
Resistance 2: 25.86 - 26.2 area
Support 1: 23.1 - 23.23 area
Support 2: 22.55 -22.6 area
Support 3: 22.00 - 22.20 area
Consider these structures for pullback/breakout trading.
❤️If you have any questions, please, ask me in the comment section.
Please, support my work with like, thank you!❤️

Silver Uptrend MoveIn the silver chart on the daily timeframe, our trend following level is $23.50, but we can expect a drop to $22.10 at the daily close below this level. As long as it stays on the trend, the $25.50 target will hold.
All silver traders need to watch these six data points It's important to stay informed about the market and various data reports that can affect silver prices. Here are some key data reports that traders should watch when trading silver:
1-Gold-silver ratio: The gold-silver ratio is the number of ounces of silver that are needed to purchase one ounce of gold. A high ratio indicates that silver is relatively cheaper compared to gold, while a low ratio means that silver is relatively more expensive. Traders can use this ratio to assess the relative value of silver and make informed buying and selling decisions.
2-Industrial demand: A significant portion of silver is used in industrial applications, such as electrical conductors, batteries, and medical equipment. Therefore, changes in industrial demand can have a significant impact on silver prices. Traders should watch for data on industrial production and manufacturing activity, as well as any news that could affect the demand for silver in these industries.
3-Investment demand: Silver is also used as a safe haven asset and can be bought and sold as a form of investment. Changes in investor sentiment and demand for silver as an investment can have a significant impact on prices. Traders should watch for data on investment demand, such as the level of silver holdings in exchange-traded funds (ETFs) and the level of silver bullion held by central banks.
4-US dollar strength: Silver prices are often inversely correlated with the strength of the US dollar. When the dollar is strong, silver prices tend to be weaker, and vice versa. This is because a stronger dollar makes silver more expensive for buyers using other currencies, which can decrease demand and lower prices. Conversely, a weaker dollar can increase demand for silver and push prices higher. Traders should watch for data on the value of the dollar, such as the US Dollar Index, to assess the strength of the currency and its potential impact on silver prices.
5-Inflation expectations: Silver is often seen as a hedge against inflation, as its value can potentially increase as the purchasing power of money decreases. Therefore, changes in inflation expectations can affect silver prices. Traders should watch for data on inflation, such as the Consumer Price Index (CPI), to assess the likelihood of future price increases and their potential impact on silver.
6-Interest rates: Changes in interest rates can also affect silver prices, as higher interest rates can make it more expensive for traders to hold silver and other commodities. This can decrease demand for silver and put downward pressure on prices. Conversely, lower interest rates can make it cheaper to hold silver and increase demand, potentially pushing prices higher. Traders should watch for data on interest rates, such as the Federal Reserve's benchmark rate, to assess the impact on silver prices.

Silver hit our target and ready for the next rally to $27.00 in 2022, Silver hit our target price of $24 this was due to a break up and out of a Triple Bottom (3 Rounding Bottoms).
Now we see a new Bullish Diamond formation on Silver.
We just need to wait for breakout
Target $27.00
Fundamentals:
Analysts predict that gold and silver will perform well in the new year as the Federal Reserve is expected to cut interest rates in the second half of 2023. This is due to the belief that a recession is imminent, which will reduce inflationary pressures and lead to falling interest rates. Chief North America economist Paul Ashworth of Capital Economics stated that despite the Fed's current hawkish stance, they still expect interest rates to decline by the end of 2023.

$XAG - Now we wait for the NFP!$XAG - Now we wait for the NFP!
Today we got NFP - exp 200k anywhere above is good number expect then silver to decline 22 handle. However if it's a miss expect silver to climb above towards 23/24 handle
A break to either direction!
Trade safe!
Trade Journal

xagusdmy idea on silver, we can start breaking this uptrend channel highs or lows , the market only knows ,wait for confirmations.
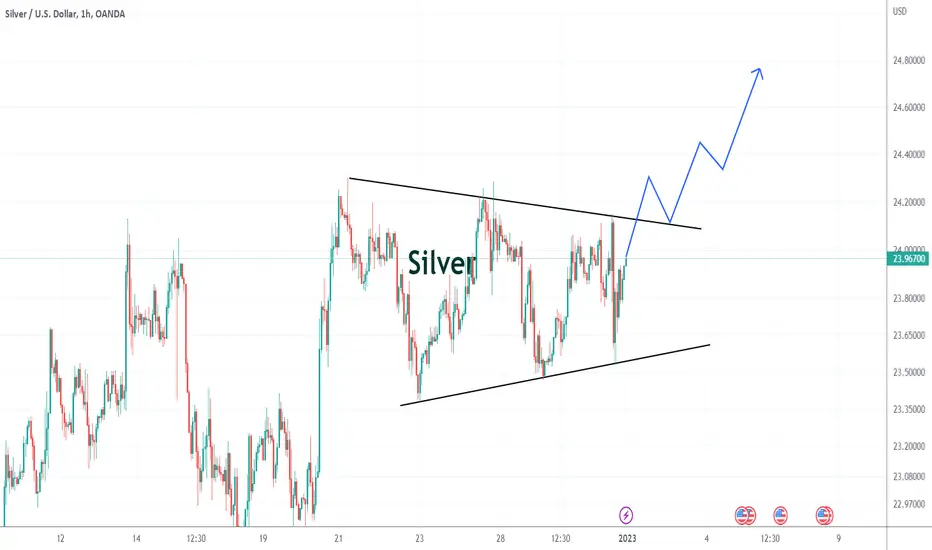
SLIVER, buy from support lineI expect a rebound from the green support line and continued growth.
TP around 24.70.
GG
P.S.
This is not financial advice of course, just my idea.

CFDS ON SILVER52-Week High 27.500
14 Day RSI at 80% 25.112
Pivot Point 3rd Level Resistance 24.219
23.890 3-10 Day MACD Oscillator Stalls
Pivot Point 2nd Level Resistance 23.719
23.642 61.8% Retracement from the 52 Week Low
Pivot Point 1st Resistance Point 23.379
High 23.220 High
1-Month High 23.220
13-Week High 23.220
Last 23.038s Last
14 Day RSI at 70% 22.958
22.879 Pivot Point
22.696 14-3 Day Raw Stochastic at 80%
Previous Close 22.637 Previous Close
Silver Analysis 01.01.2023Hello Traders,
welcome to this free and educational analysis.
I am going to explain where I think this asset is going to go over the next few days and weeks and where I would look for trading opportunities.
If you have any questions or suggestions which asset I should analyse tomorrow, please leave a comment below.
I will personally reply to every single comment!
If you enjoyed this analysis, I would definitely appreciate it, if you smash that like button and maybe consider following my channel.
Thank you for watching and I will see you tomorrow!
You can also check out my previous analysis of this asset:

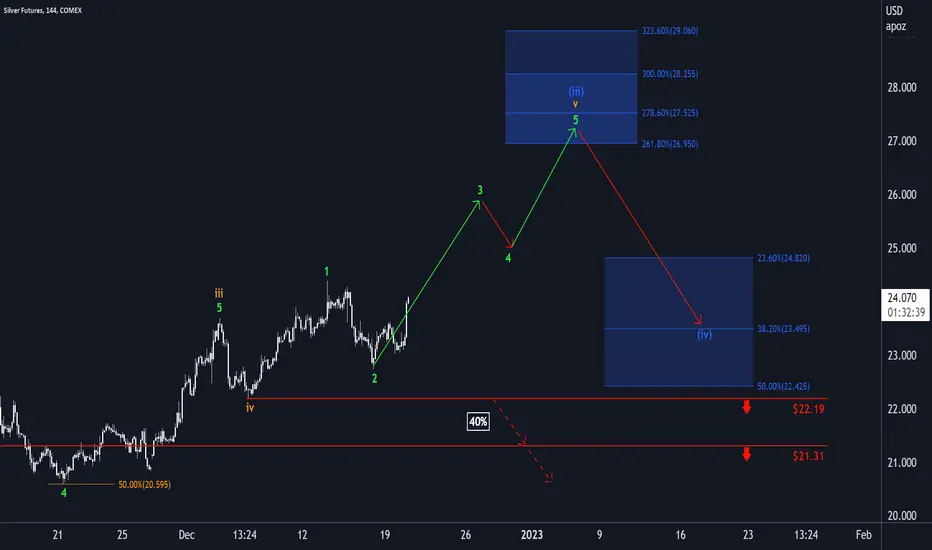
Silver: Next Up 3! 😎The following developments for the silver price should be characterized by further increases until the green wave 3 is completed and forces the bulls to rest a little bit. However, a more prominent 3rd-degree-wave, namely the blue wave (iii), should be completed between $26.95 and $29.06, before pushing the course back down South. In any case, movements below $22.19 would force us to switch to a more bearish outlook.
Is Silver preparing for long bull run?Comparing the last 50 years of the Silver chart along with the 80's market top along with the 2011 market top. We can see a clear cup and handle 42 years in the making.
Price action is laid over 2 indicators
The Extended Golden Ratio Multiplier
The CM Ultimate MA MTF
The focus of this chart is the pink fib line of the Multiplier and the green & red CM Ultimate MA. I have the focus area circled with what seems to be the interesting point of the chart and indicators. In 1987 the price of silver tired to push back through the MA lines but was rejected and in 89 the pink line followed and kept falling. in 2019 and 2020 try's the same move but this time price action pops through then corrects and so far seems to have found support on the MA lines. At the same time the pink line is crossing the now red CM Ultimate line which historically has happen every time price action has made moves up for months and months afterwards.
We also cannot skip or not touch upon the Dragonfly doji caused in the first half of 2020. This too is usually a very indicator that price action could be moving up over the next few candles and beyond.
Although Gold to me is showing some signs of weakness, Silver to me at least from this chart looks like a very bullish for possibly next few years. Let me Know what you think down below.
Thanks for looking
WeAreSat0shi
Stay Blessed!

Short term S&H pattern on Silver INRCould give a quick move the neckline. Expecting Silver to make a higher high

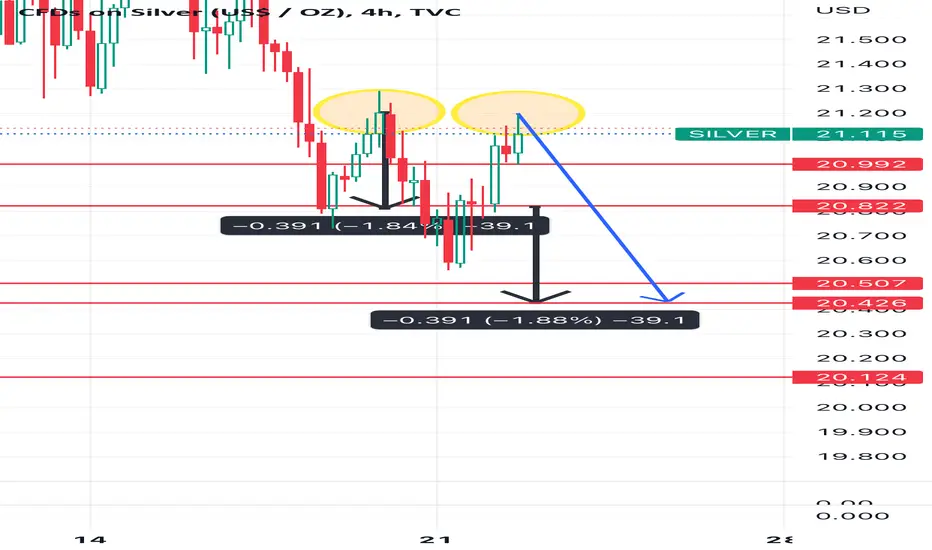
Silver update A nice double top pattern in 4 hour frame
Looking for 20.4-20.5 today
Yesterday was a good play but we dont reach our target
Today will be easy target
GOOD LUCK
Silver update Iam already in profit sold the 22 area 21 area my target still the same 20 $ or below
I believe we can drop
Am not a buyer every upside movement is for sell
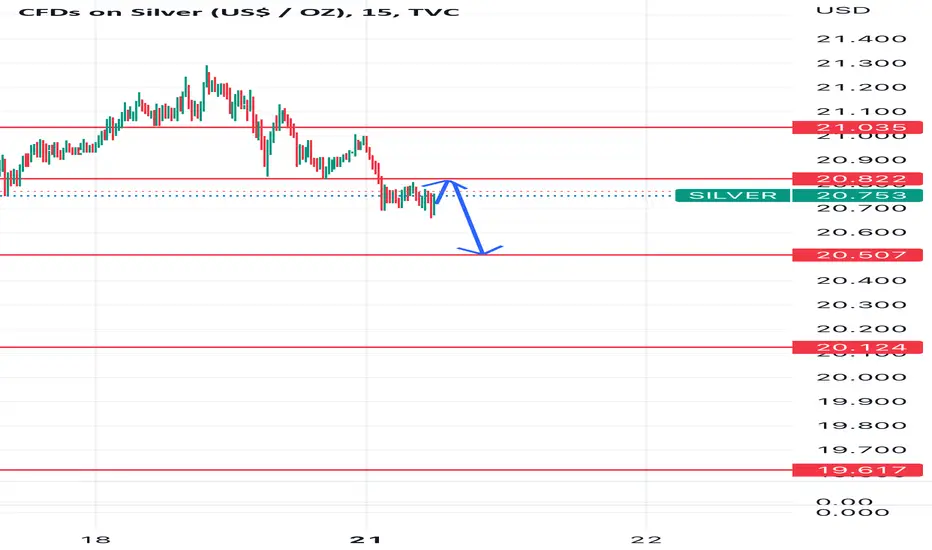
Today target 20.500
GOOD LUCK
Silver quick lookTechnically, silver will test strong support, as what it breached, we may see it again at 22 levels.
The four golden rules of trading
1 Don't be greedy
2 Always use stop loss
3 Never add other positions to the losing positions
4 Use a suitable lot for your account
❤️Please, support our work with like & comment!❤️

Long Silver after reaching support zone.For next week, looking to see Silver go to Buy zone at 18.5 around.
After what we should see Bankers get long on Silver.
The perfect call will be with price falling on that zone...and they buy silver.
For the stop, it will be of course few pips lower that price failure or zone buy zone.
Buying via Future contracts 03-23, so I don't have to pay Swaps.

Silver Levels & Strategy for next few daysDear traders, I have identified chart levels based on my analysis, major support & resistance levels. Please note that I am not a SEBI registered member. Information shared by me here for educational purpose only. Please don’t trust me or anyone for trading/investment purpose as it may lead to financial losses. Focus on learning, how to fish, trust on your own trading skills and please do consult your financial advisor before trading.
Sagar Bhai, Silver had an excellent run in last 1 month from below 55K level to 63K plus level. Silver has made LH-Lower High pattern on chart, trading below VWAP. Showing sign of tiredness after decent up move. Silver is likely to consolidate or correct from this level. This is a good time to book profit. 59000 to 60000 should be good range to enter in long position for few months. We are likely to get a chance near next US FED hike when US Dollar Index will get stronger. Please review & share your thoughts as well.

Silver update Who sold the the top with me ( congratulation! ! )
We may now reach to 20 minimum target
Further if we break 20$ then we go to 19$
This week is for seller
GOOD LUCK

Silver vs CPI numbers !Silver confirm ( bearish rectangular)
CPI TOMORROW
if someone think i hate silver , he is absolutely wrong .
TREND IS YOUR FRIEND
Rectangular bearish pattern mean we can go down same percentage of consolidation range percent
CPI with 75 ppt rise 18 $ in silver is normal
Good luck all!

Silver updateSilver going down to 20 first target
I think a sort of pullback then continuation down to 19
Iam still seeing the 17-13 mid term target
Its 75 ppt rise ( inflation is high)
GOOD LUCK
Silver update (read below)Silver goes up today in down movement of DXY.
However , i believe next target is 22 where it can be rejected down to 20-19
Any ways there will be no upside more than 22 this week and the coming week .
Ill short the 22 $
GOOD LUCK
