GOLD/SILVER RATIO STRATEGY #2 BETTER SILVER FUTURES LONG TRADEDETERMINE WHICH IS THE STRONGEST METAL BETWEEN GOLD AND SILVER
** If the gold silver ratio is in Uptrend and gold & silver in Downtrend: Buy Silver.
If the gold silver ratio is in Uptrend and gold&silver in Uptrend: Buy Gold.
If the gold silver ratio is in Downtrend and gold&silver in Uptrend: Buy Silver.
If the gold silver ratio is in Downtrend and gold&silver in Downtrend: Sell Gold.
The Intermarket relationship between the gold and silver price can reveal a better way to time the metal market.
There may be times when the price of silver makes a new low, but the price of gold doesn’t track that movement.
When something like that happens a possible trading opportunity can emerge.
We can note that the silver price has broken to a new low while the gold price has made a higher low.
This is a break in the gold and silver correlation.
It means that one or the other is lying.
To find out which one, we simply use the gold silver trading strategy rules revealed at step #3.
Based on those rules when the gold silver ratio is up and both gold and silver are moving down, the signal is to buy silver.
For timing the market, we have applied a 20 period MA over the silver chart.
A break above the 20 MA will trigger our entry.
Simple as that!
Final Words – Gold Silver Trading Strategy
When we use the gold silver chart ratio in conjunction with the individual price trends of gold and silver we can determine strong buying and selling opportunities. You can also ride massive trends with the gold silver ratio, especially when we have historical readings. However, since these only happen once or twice in a lifetime you can use our gold silver trading strategy to navigate the day-to-date price action.
The ratio can also be used to determine the overall market sentiment, which is a precious thing that can be used to trade other markets. Usually, a high gold to silver ratio is signaling a slowdown in the global activity, while a low gold to silver ratio is signaling improving risk sentiment.
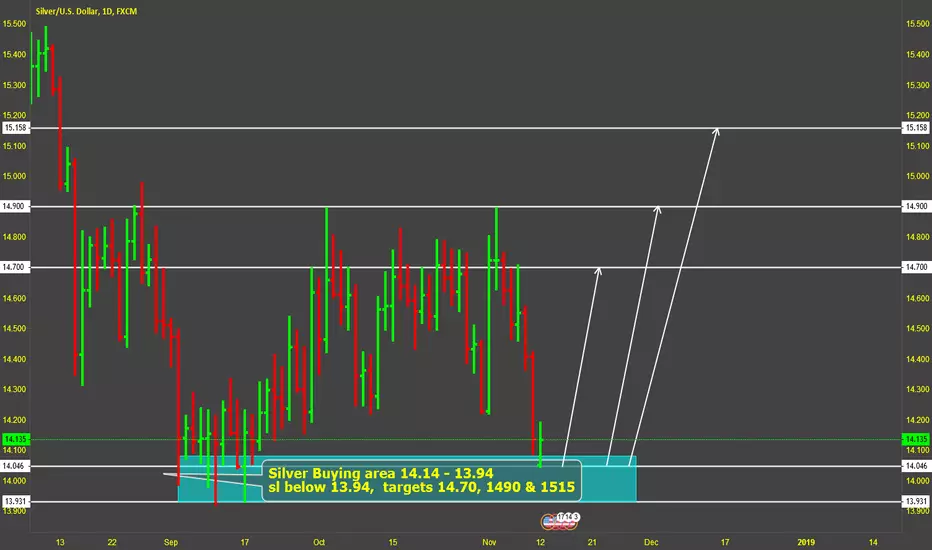
Silvertrading

Silver (XAGUSD): Short term action plan.Silver is trading within a Channel Down on the 4H chart (RSI = 43.954, MACD = -0.061, Highs/Lows = -0.0197) since January 7th. The RSI sequence however is currently posting a short term bullish signal. Our Target Zone is 18.000 - 18.100. If however the dashed Higher Low line breaks then the pattern will most likely complete the Lower Low on a roughly -5% sequence near 17.170.
** If you like our free content follow our profile (tradingview.sweetlogin.com) to get more daily ideas. **
Comments and likes are greatly appreciated.

SILVER: Bearish Fundamental & Technical outlook.This is a break down analysis of Silver (XAGUSD) in the aftermath of key U.S manufacturing news.
Fundamental Analysis:
- The ISM Manufacturing PMI rose yesterday to 50.9 in January, up from 47.2 a month earlier, marking the first expansion reading since July. This improved risk appetite and is applying selling pressure on Silver. The U.S. manufacturing sector has been kept low for months as the U.S. China trade war unfolded but the phase one deal prompts investors for even stronger manufacturing readings this year.
- Based on the last 12 ISM Manufacturing PMI reports, Silver followed the statistics that gave a 66.7% probability to go lower on the 4H and 12H timeframe if the Actual reading was higher (>) that the forecast. The prediction is equal (66.7% probability to go lower) on a 2 day time frame as well.
Technical Analysis:
- The pattern is a Channel Down in the last 30 days.
- The Resistance is set at 18.115 and the Support at 17.350.
- Death Cross (MA50 crossing below the MA200) formed on the 4H chart.
- The MACD remains bearish with no sign yet to turn, following the Lower High on the Channel Down yesterday.
The above mix indicates that Silver is bearish both fundamentally (strong manufacturing numbers = lower Silver price) and technically (Channel Down). The last two declines after a Lower High were around -5.30% and we expect Silver to fulfil this sequence in the coming days.
If you like this idea give us a like, follow and share your thoughts in the comments section below. Remember to stay tuned for future technical analysis , news, updates, and more from PrimeXBT!

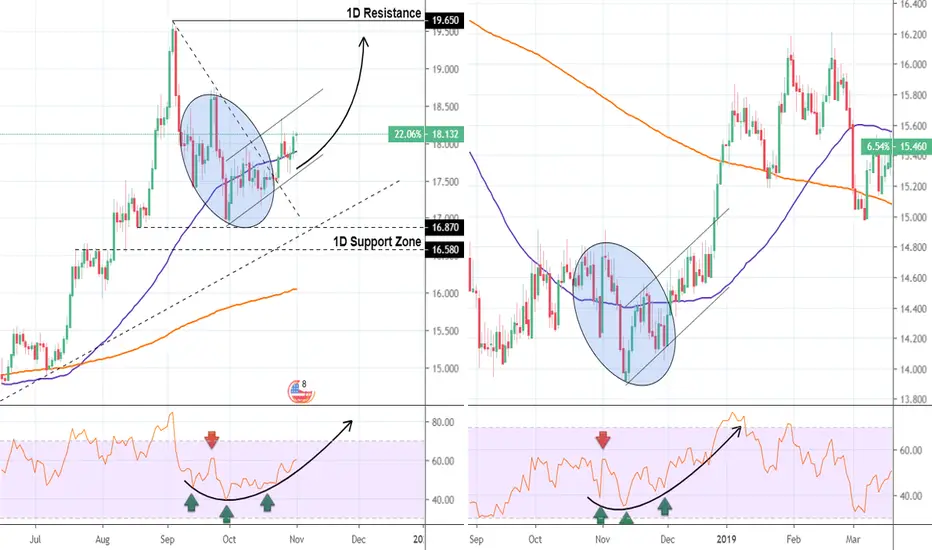
Silver (XAGUSD): Bullish pattern spotted.Silver (XAGUSD) is trading within a newly emerged Channel Up on the 1D chart (RSI = 60.617, MACD = 0.050, Highs/Lows = 0.2338) following the October 1st bottom just above the 1D Support Zone.
Both the 1D candle action and the RSI sequence resembles and October/ November 2018 fractal which delivered a strong rise once the Channel Up broke. Our advice is to take a careful long approach towards 19.000 - 19.500 moving the stop loss on the Higher Low of the Channel each time to limit the potential loss while keeping a maximum gain perspective.
Check out also how we expect its relationship with Gold to trade:
** If you like our free content follow our profile (tradingview.sweetlogin.com) to get more daily ideas. **
Comments and likes are greatly appreciated.
XAGUSD (SILVER) Trend Breakout LongTrend breakout + if we take a look on the weekly timeframe we see a clear dragonfly doji (bullish sign).
Feel free to comment below!

Flag continuation pattern on SILVER!The shakedown of US and Iran crisis and threat of war clearly gave a damaging impact on US Dollar. Investors are worried about the state of world economy and started to accumulate precious metals to protect their wealth against devaluation of Dollar. With a lot of alarming issues happening all around the globe, the demands for precious metals will continue to rise, increasing their prices. I would appreciate to hear any comment or idea from you guys. Whatever happen, Trade Safely!

SILVER Sell SignalPattern: Ascending Triangle on 4H.
Signal: Bearish after the 1D Resistance is being tested for the 3rd time (possibility for a Triple Top).
Target: The 4H Support levels (14.900, 14.760, 14.630).

SILVER Two Sell TargetsPattern: Channel Down on 1D.
Signal: Bearish as long as the Lower High sequence holds.
Target: 14.400 and if the price bounces back to the resistance then aim at 14.250.

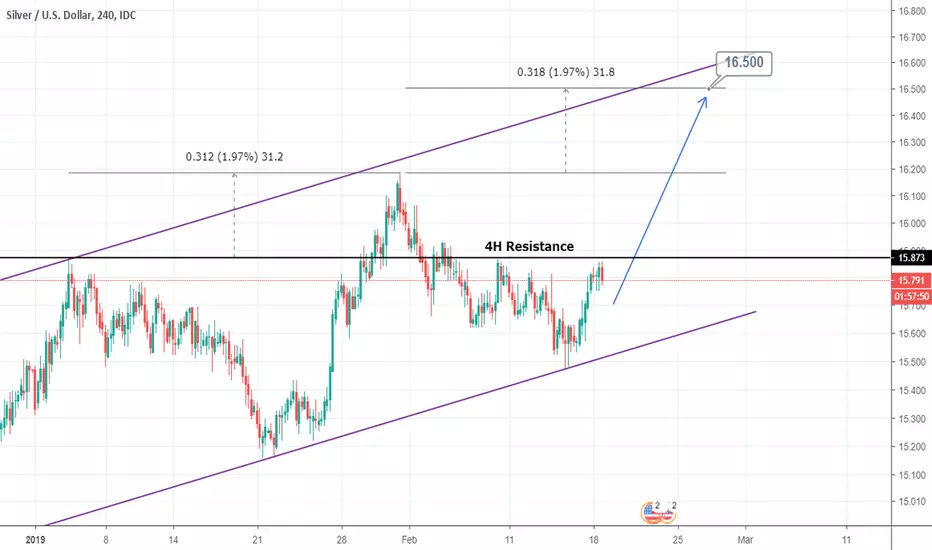
XAGUSD (Silver) Buy SignalPattern: Channel Up on 1D.
Signal: Bullish as last week the 1D Channel Up made its Higher Low.
Target: 16.500 which is the technical Higher High based on the basis difference between HHs.
GOLD Trade SetupXAUUSD, GOLD long increased 6k by last week. long% increase 1% while short% decreased 1%. professionals open long in small number while closed short in large number. $index no change in short and long in this week.
XAGUSD (Silver) Bullish setupXAGUSD, silver trimmed short 6k by last week. long% increased 2%, short% decreased 2%. speculators profit taking by closing positions of both sides, while non-speculators open short.
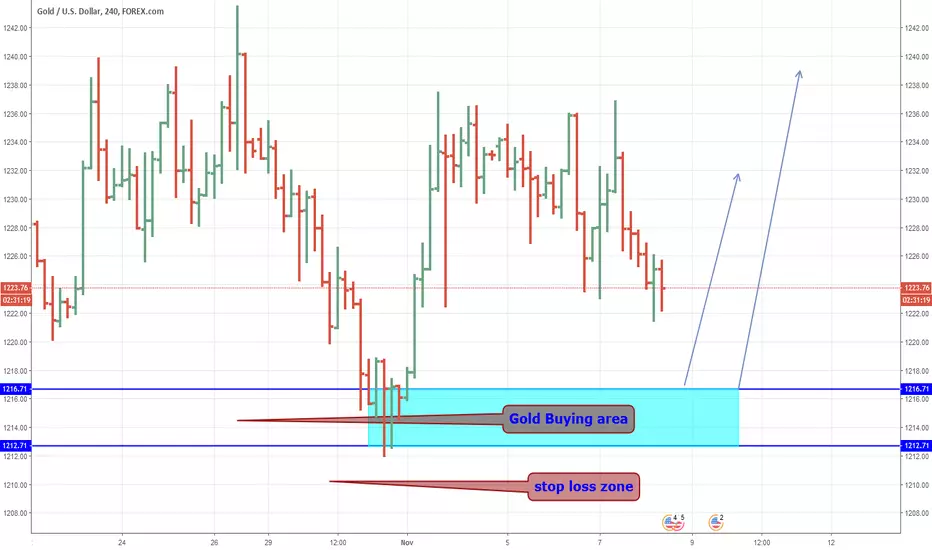
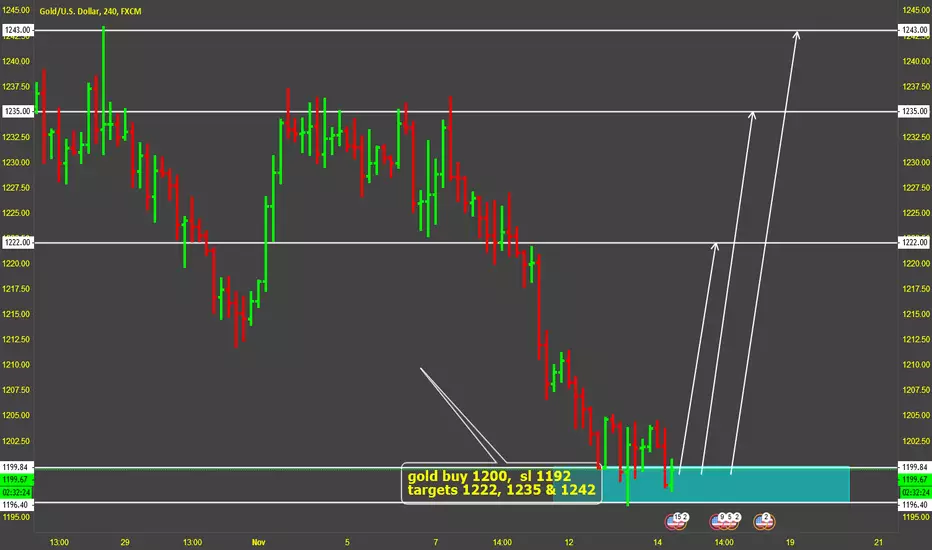
Gold Bullish setup#xauusd, xauusd, uptrend line support area 1215-1212, price may test support then fly.