Gold Sliver Spread is Pointing Downward - Silver to TrendGold-silver ratio dropped from 107 to current 91. What does this mean? Does it indicate that silver is about to trend higher, or is it a sign that gold will continue its trend?
If you take the gold prices on 'Liberation Day' on 2nd April 2025 - Gold at $3,509 divided by Silver at $35 = 100.25
Today, the gold prices at 3,400 divided by the silver prices at 37.36, you will get the ratio as 91.
Based on this historical development over the last 50 years, gold silver spread has range bound within this range of 40 and 100, and likely it should remain this way.
Studies shown it has just reached 100, forming a potential inverted hammer, and could be on the way down to its lower band. Either the 65 band or 40 band.
If that were to happen, this also means the Silver’s trend is likely to pick-up faster than gold did.
On 05 April 2024 a video analysis I have published, title “Silver is Next to Rally After Gold”, then I presented on its fundamental and its technical reasons.
By the way the cup & handle formation, it is taking a very good shape today.
On that analysis, I suggested in time to come, when Silver to catch-up with gold, it will be fast and furious. And I believe the time is near as the ratio now dip to around 91, and it seems more room for more downside.
This means with so many uncertainties and fear of inflation coming back again, Gold may still trend higher, but this time the rate-of-change for the silver to move higher is faster than that of gold. If the ratio continue to decline, we should see a much firmer silver prices from the current.
Historically, gold and silver have been used as money, and even today, if you take any grams or an ounce of gold or silver to banks with bullion departments, you can exchange it for cash.
As the world searches for the next reserve currency, precious metals have become a safe haven. That’s why gold has been trending upward over the years, especially when inflation hit a high of 9% in 2022. When gold becomes too pricey, investors often look for alternatives like silver. This also explains why, during most financial crises, the gold-silver ratio dips, indicating that silver is catching up with gold.
Micro Silver Futures
Ticker: SIL
Minimum fluctuation:
0.005 per troy ounce = $5.00
Disclaimer:
• What presented here is not a recommendation, please consult your licensed broker.
• Our mission is to create lateral thinking skills for every investor and trader, knowing when to take a calculated risk with market uncertainty and a bolder risk when opportunity arises.
CME Real-time Market Data help identify trading set-ups in real-time and express my market views. If you have futures in your trading portfolio, you can check out on CME Group data plans available that suit your trading needs tradingview.sweetlogin.com
Trading the Micro: www.cmegroup.com
www.cmegroup.com
Silvertrend

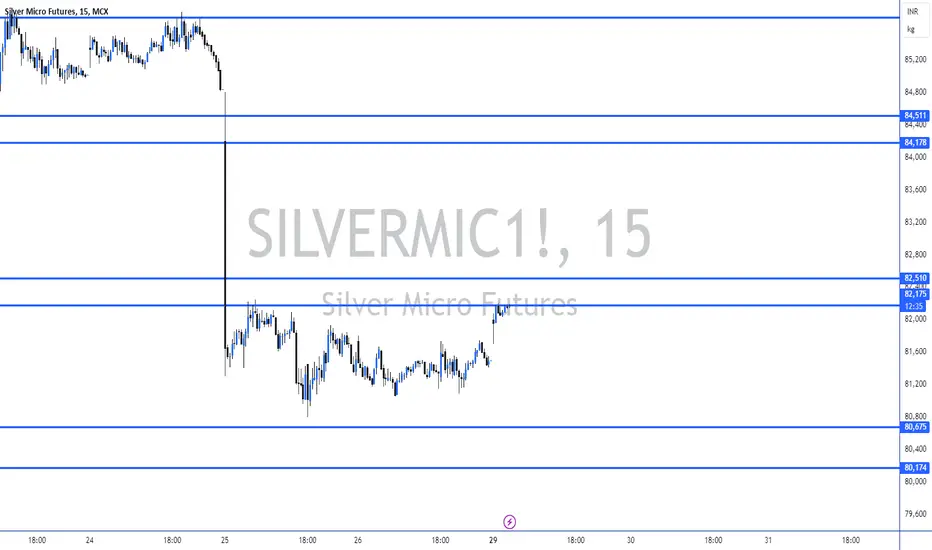
SilverMic Levels For 29th July -2nd Augustimportant support and Resistance Levels For SilverMic.
When Market touches the level, the price action plays important roles.
SILVER Analysis 1Sep2023Silver prices are stuck in the SND area for now and are also in the SR Flip area. The possibility of sideways until the release of the news tonight. the possibility of a bearish correction to the price of 21,500

Potential Double Top Forming on SI Daily ChartSilver touching major resistance area and potentially forming a double top if it can't break above 26.50.
I also noticed a double bottom that's playing out on the 15 minute chart that I missed while being away.
Could go either way, but I think fundamentals support bulls.

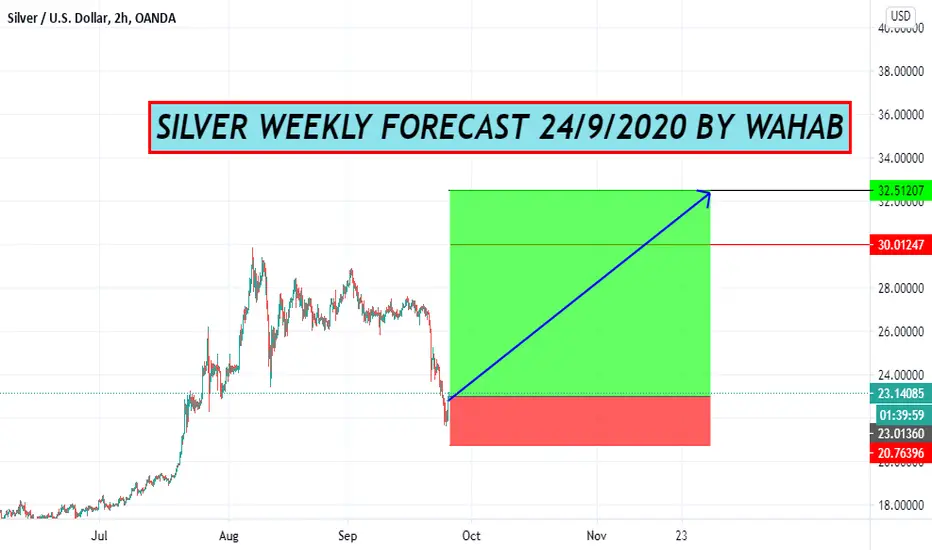
XAGUSD/ SILVER WEEKLY FORECAST 24/9/2020LOOK FOR LONG SILVER NEAR 22.80/50 FOR THE TARGETS 30$ 32 $ IN FEW WEEKS JUST TRADE WITH PROPER MONEY MANGEMENT THANKS

SILVER - BUYSilver is a very important commodity, in fact it is even more useful that Gold. As only about 10% of produced Gold is used in various manufacturing, rest 90% goes for jewelry and just as safe haven, where Silver's 50% goes for manufacturing as an example your touch-screens, solar energy and medical sectors... But I'm not here to predict future of humanity :)
Key things to note before analysis:
- Top countries producing silver are Mexico, China, Peru, Russia, Australia, etc. Take into account their relationships with US, tariffs, their currencies vs USD. AUD/USD for instance, started to rebound already and has a huge way up to go. USD even if strong (as always) may strengthen a bit more, but has to go for correction anytime very soon.
- Commodity market, for ex. Gold have shown reversal. Now Gold is a "Buy on dips" for majority and by far not many want to trade against its Bullish trend.
- Assuming the average production price globally is $11.74 price still can go down, despite already some smaller producers are selling for a cheaper price (as their production cost is around $15). That is ok(ish) because the demand has lowered during last 2 years. But, India (which is major buyer) has increased its demand this year.
- Demand will keep rising for Silver, but producers will definitely not want to increase production. For example Jewelry demand has already risen. "Why would I buy expensive gold jewelry during these crisis times. I want to save. Also silver is useful for health, it kills one-cell bacteria..." ;)
- If commodity currencies rise, commodities prices will rise. Duh?!
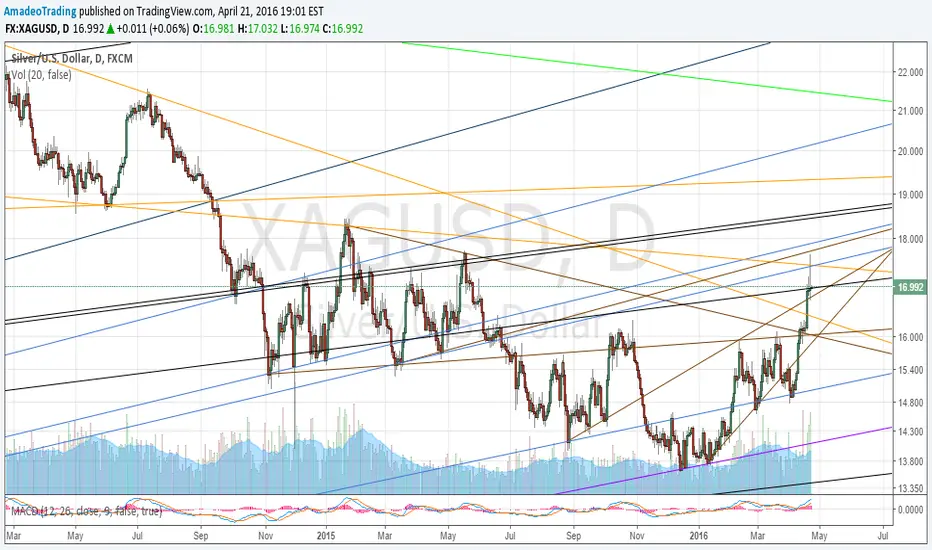
Ok, now the chart:
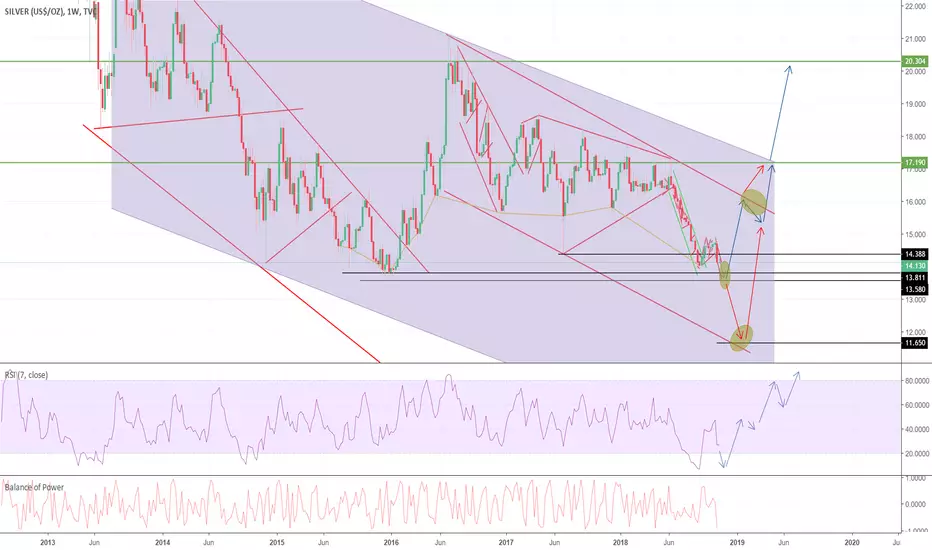
Please pay attention to corrections, how they are broken and movements inside the channels. I have marked with red arrows price action which is less likely to happen and blue arrows show most likely to happen. So, I am expecting the price to test $16 latest by Feb 2019 and reach around $20.30 by April. The buy zone is reached for me and will SL at around key levels. If $13.58 is broken, I will look to start adding more at around $12 So this is a longer term trade. Please comment, share and like.
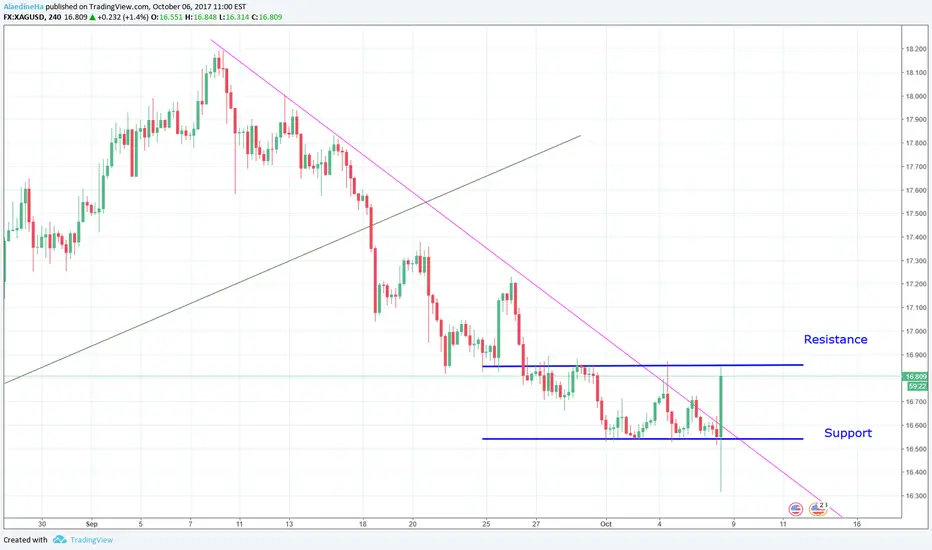
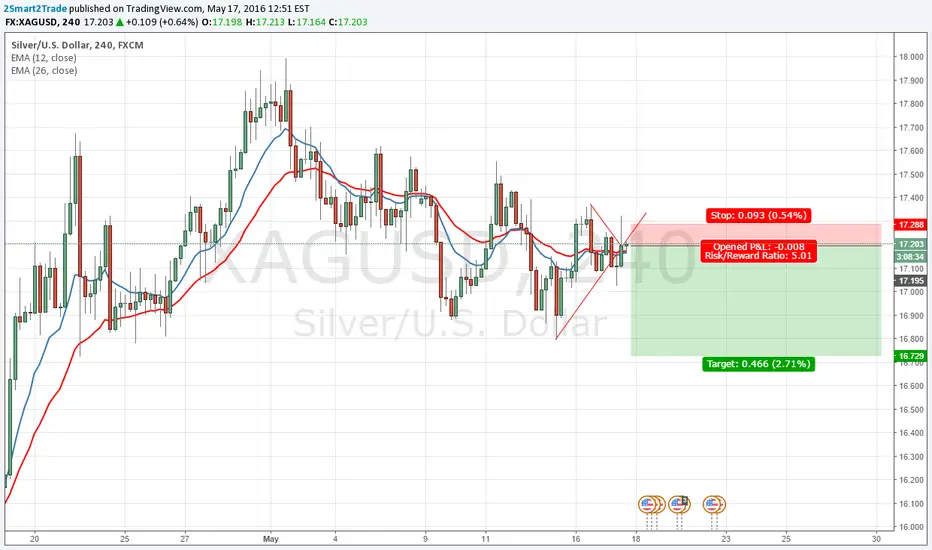
Silver in the test resistance level 16.8A break of resistance will support the price for a rise in the case of a false break. The price will repeat the previous support level 16.50 Any breach of the two levels will give the direction of the future price movement directly with caution from the false fractures
Silver Trend ChangeAs always guys trade with your own mind, if have any question feel free to leave a comment.
TVC:SILVER
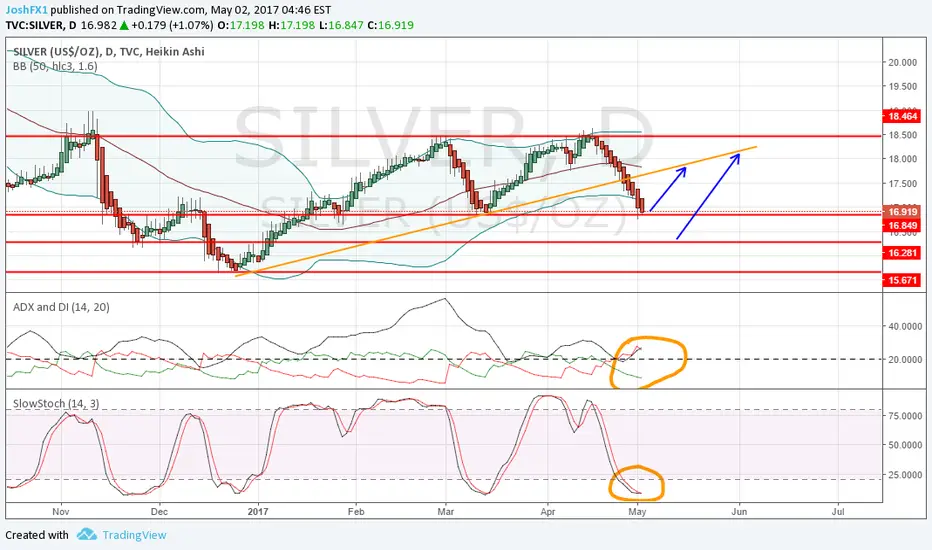
Silver turning bullishSilver on the daily time frame is now at a resistance, with Stoch Rsi showing that the selling pressure is fading and Adx shows that the bearish trend is also fading (bearish line makes crossover downwards with the trend strength line).
This means that after selling Silver from 17.900 (which I published a week ago) it's now time to look for a buy entry.
How to trade:
Since there are multiple resistance levels and it's now approaching the 1st one I advice to start with a small buy position so that you have the space to add more if it might go 16.281. A break of 17.200 is also a nice entry for another buy positions. Take profit would be in the 18.000-18.500 region. A stop-loss at 15.400 is preferable.
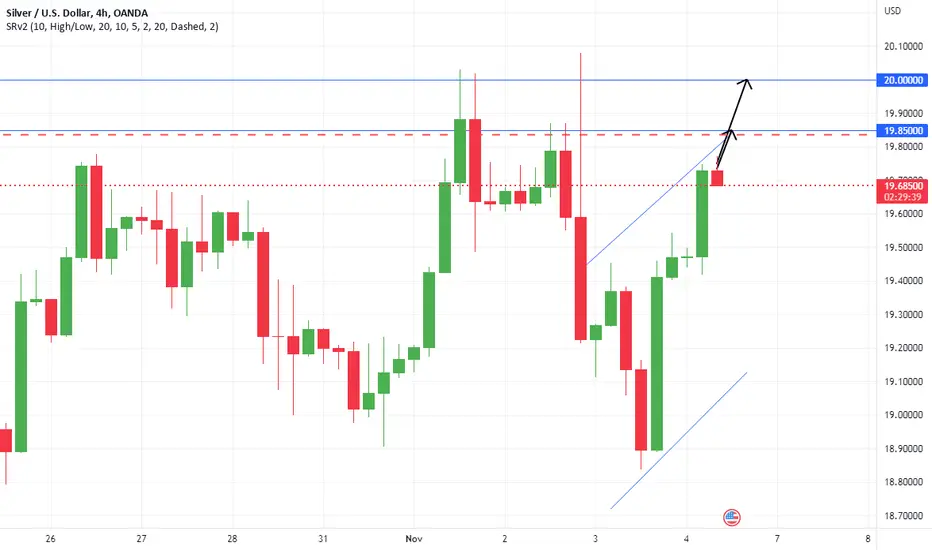
Xagusd Looking like Another Move Down Before Monthly Up MoveI am expecting a Drop on H4 Due to Following Reasons
Symetrical Triangle Breakout
Upward Rejection
High Volume
H4 Short Does not Gonna Affect Monthly Silver Gains
Consolidating at this area for a long time
Let us see how this trade goes
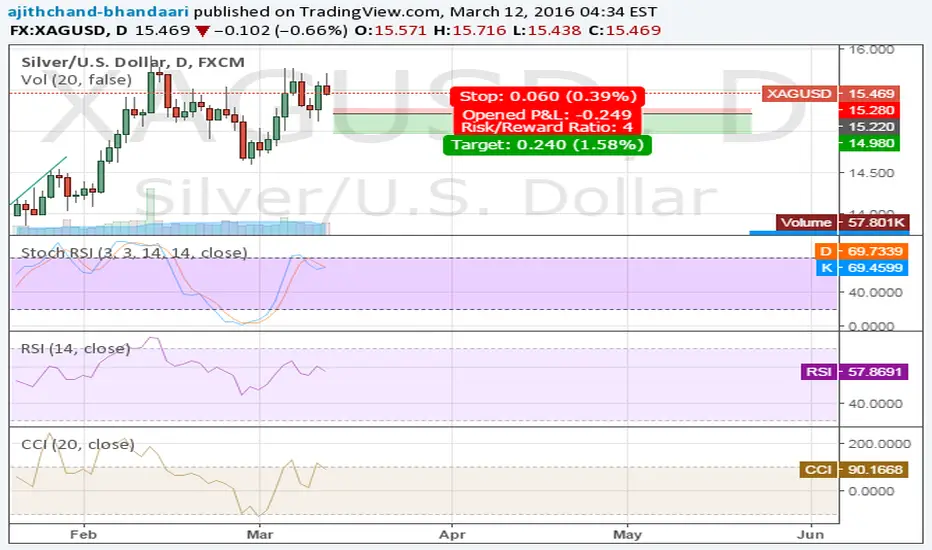
SH SIORTLVER ::: RISK CALL :::SILVER is expected to SINK now.
The reason why we feel SILVER may SINK.
* On weekly basis it has just started SINKING
* To Rise and come near 14.98 levels
* Stoch RSI (3,3,14,Close) is SINKING.
* RSI (14,CLOSE) is SINKING.
* CCI (20,CLOSE) is SINKING.
Keeping all the above indicators in view along with the chart pattern we expect it to Rise. Our SELL call shall be from SELL BELOW :15.22, SL: 15.28, Tgt 01: 15.05, Tgt 02: 14.98, Tgt 03: 14.76.
The view expressed here is on weekly basis. [b ]Caution: The above is our personal view. Neither a recommendation nor a tip nor an advice for trade. Please consult your personal financial advisor before investing.