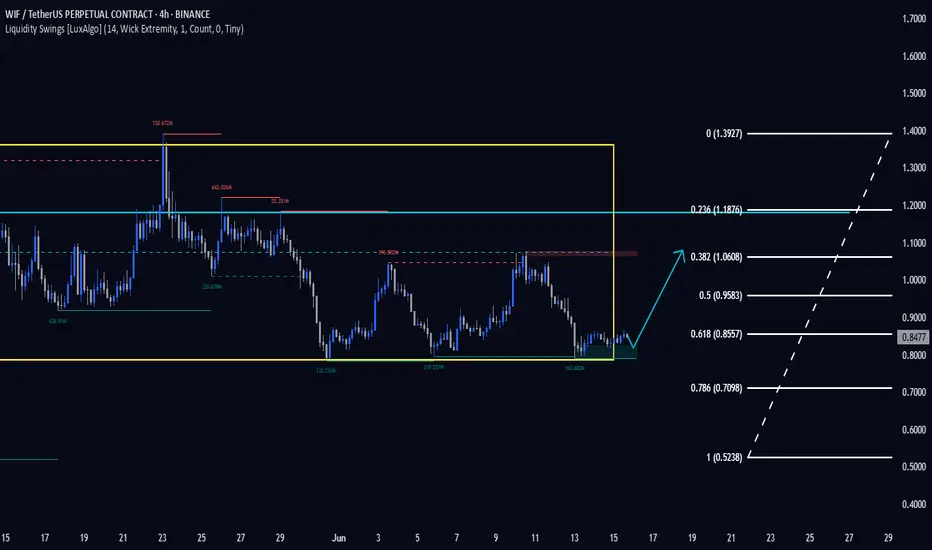
WIF 4H. Make or Break ZoneBINANCE:WIFUSDT The asset is still moving within a defined range and is now brushing against the lower boundary of its structure. This area has historically triggered buyer interest — and if that repeats, we could be looking at a recovery toward $0.97+ in the short term.
However, failure to defend this support could send price cascading down to the $0.58–$0.60 zone.
Given the ongoing uncertainty in global markets, especially due to rising geopolitical tension, any long positions should be executed with tight risk management and a hard stop-loss.
Entry range (EP):
• Market
• $0.8120
• $0.7790
Take-Profit targets (TP):
• $0.8880
• $0.9425
• $0.9765
I’m managing risk carefully and limiting exposure per trade to no more than 2% of my portfolio. This is my personal trading log and not financial advice — always DYOR and trade responsibly.
Let the market decide — I'm prepared either way.
Stay sharp. Stay safe. 🧠📊
Singal
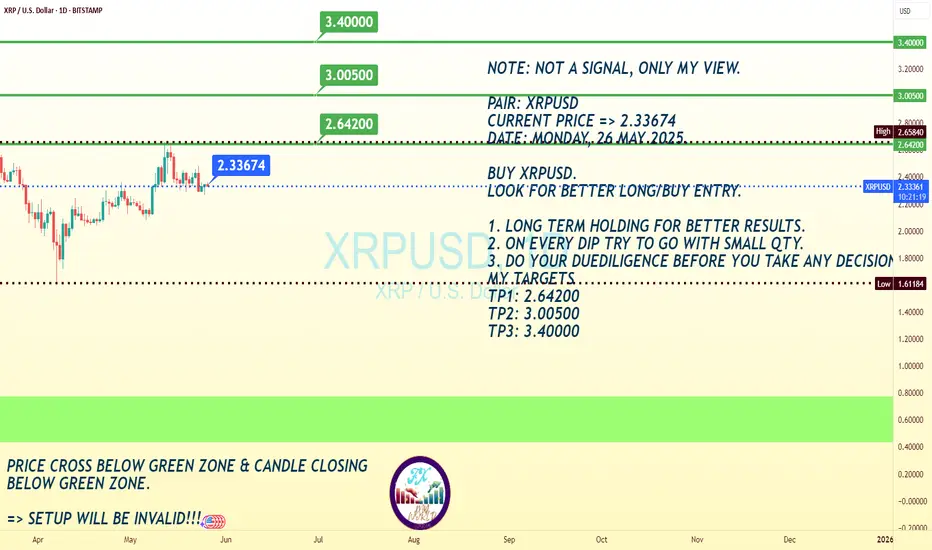
XRUSD Price Market Trend Day TF Long Term BUYXRPUSD is trading at 2.33674, with a strong recommendation to buy for long-term gains. The chart indicates a potential upward trajectory, with price targets set at:
TP1: 2.44200 (Near-term resistance)
TP2: 3.00500 (Mid-term target)
TP3: 3.40000 (Long-term bullish goal)
The mention of 3.40000 at the top of the chart suggests this is a psychological resistance level, reinforcing the optimistic outlook if bullish momentum sustains.
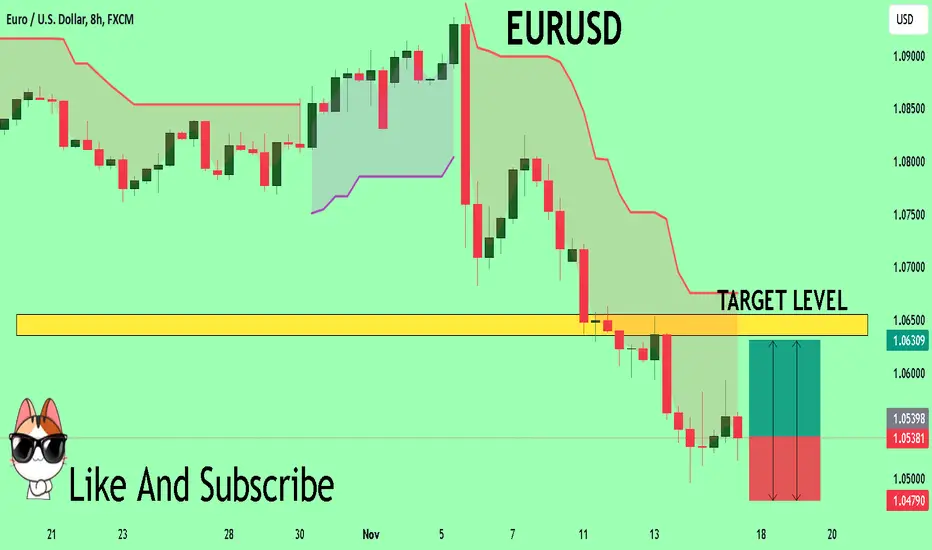
EURUSD Expected Growth! BUY!
My dear subscribers,
My technical analysis for EURUSD is below:
The price is coiling around a solid key level - 1.0538
Bias - Bullish
Technical Indicators: Pivot Points Low anticipates a potential price reversal.
Super trend shows a clear buy, giving a perfect indicators' convergence.
Goal - 1.0635
My Stop Loss - 1.0479
About Used Indicators:
By the very nature of the supertrend indicator, it offers firm support and resistance levels for traders to enter and exit trades. Additionally, it also provides signals for setting stop losses
———————————
WISH YOU ALL LUCK
XAU/USD SELLHi Trade XAU/USD Trade sent today is running in profit about 60+ profit. Rentry can be added as well.
Please share your results.
Enjoy your day!!!!
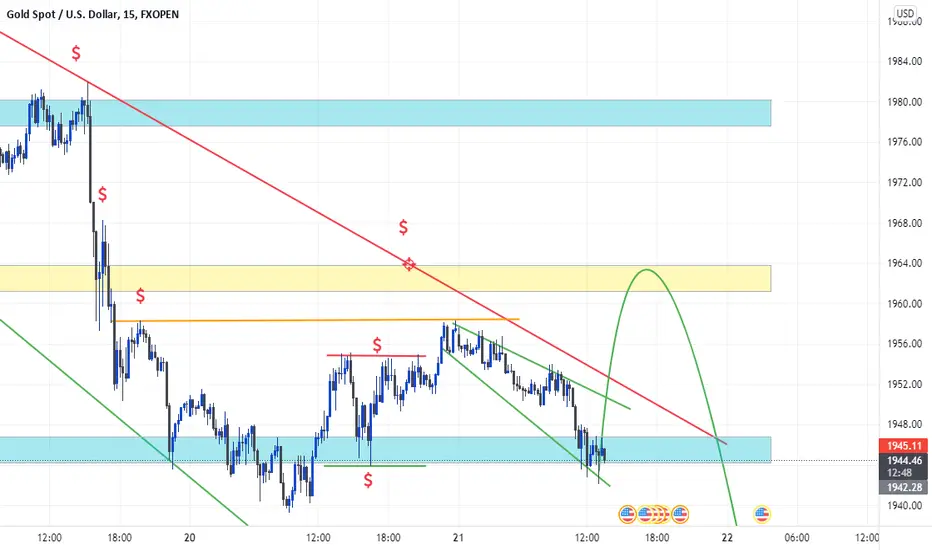
GBPUSD Day Plan we have long context on 1h timeframe with OF, my target for today is PDL, higher we do have an IMB that can give us reaction.

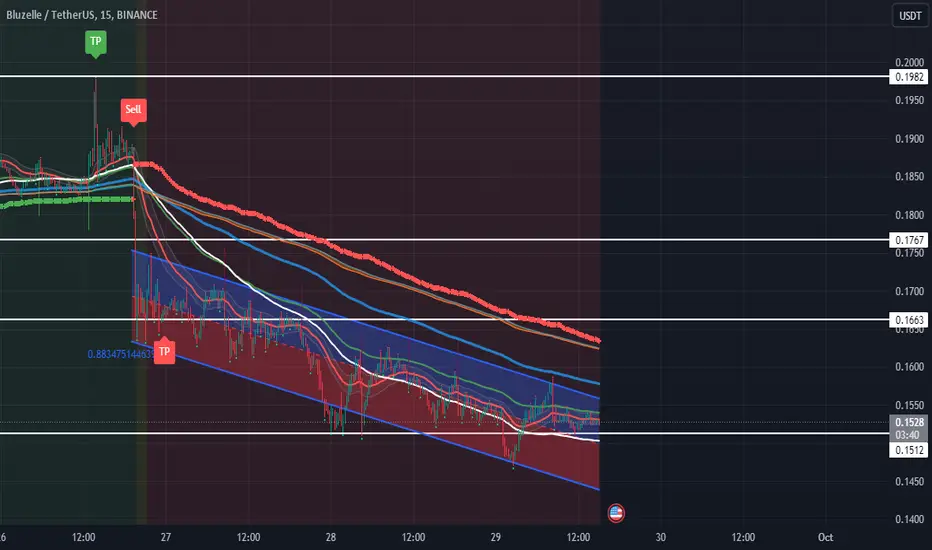
BLZ/USDT Signal Alert: Charting the Course! 📈🚀 BLZ/USDT Signal Alert: Charting the Course! 📈
Spotting the Levels:
📍 Current Spot: $0.1512
📈 Potential Resident: $0.1633
📉 Downward Watch: New Spot
🚀 Upward Targets: $0.1767 and $0.1982
📊 Analysis: BLZ/USDT is navigating the crypto seas. Here's your roadmap:
🟢 Stability: If it holds steady at $0.1512, the path to $0.1633 is in sight.
🟠 Uncertainty: Should it dip further, a new spot may form.
🔵 Optimism: In the upward scenario, we aim for $0.1767 and $0.1982.
📢 Trade Strategy: Keep a close eye on BLZ. Be ready to act as per the market's mood. Enjoy the ride with Bitxer! 🌊🌟
🚀 *Bitxer Signal Premium ID#284-3 Target Done🚀 *Bitxer Signal Premium ID# 284-3
ZIL/USDT on Binance Futures (10x Cross)*
📈 *Trade Direction:* Long ⬆️
📈 *Entry Point:* 0.01652
🎯 *Targets:*
🎯 Target 1: 0.01720 🚀
🎯 Target 2: 0.01764 🚀
🚀🚀🚀🚀🚀
🛡️ *Stop Loss:* 0.01627
💰 *Risk Management:* Wallet Size - 3-4% (Protect those funds!)
🚀🚀 Ready to blast off with Bitxer signals! We've got our sights on those targets! 🌠🛸

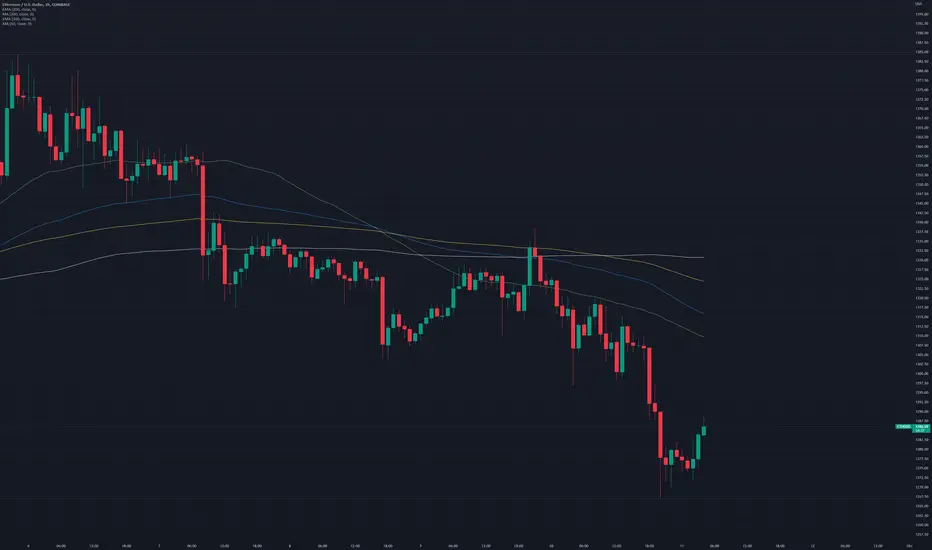
ETH USDT LONG SWING | ETHUSDT | LONG @ 1270 - 1285 | TP @ 1290, 1295, 1300, 1305, 1310 | SL @ 1180 | PATTERN = DOUBLE TOP BREAKOUT | COINBASE |
Swing trade idea. Kindly follow targets and stop loss. Will update with new targets once all 5 are achieved. Mostly trading with PNF charts, MACD, RSI, Stoch, BPI, Cipher, MA/EMA, Support/Resistance on hourly timeframes and higher time frames
BINANCE:ETHUSDT BITSTAMP:ETHUSD COINBASE:ETHUSD BYBIT:ETHUSDT KUCOIN:ETHUSDT FTX:ETHPERP BINANCE:ETHPERP FTX:ETHUSD
CADJPY : Current Situation & Technical , Fundamental View#CADJPY
- At this point, CADJPY is selling very well due to the current MARKET SENTIMENT. So CAD automatically went down. And unexpectedly, a JPY STRONG came in the last few days. This was because the Bank of Japan intervened to strengthen the JPY. In the meantime, CAD has become very weak in the last few days because the price of OIL has gone down.
- But after that the price of OIL went down very fast. Due to this reason CAD was sold very fast before. You can check it by going to CAD CHARTS.
But now with JPY WEAKNESS, CADJPY is getting a bit SELL.
- Currently, the MARKET is slightly RISK OFF, JPY is going UP, therefore, CADJPY is being SELL.
- Definitely CADJPY should be slightly DOWN until 104.60 LEVEL. After that, the possibility of moving to 110.06 LEVEL is very high. The reason for that is because even now OIL PRICES are going up a bit.

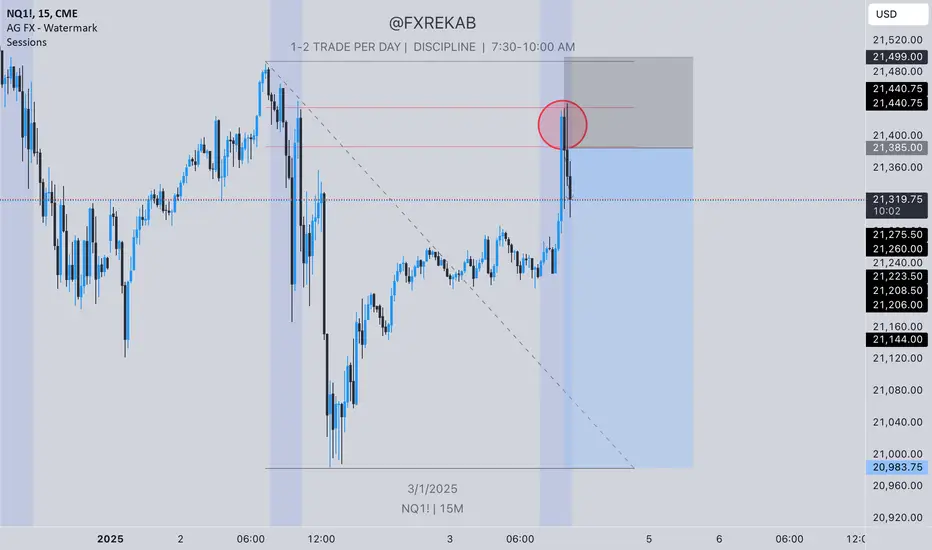
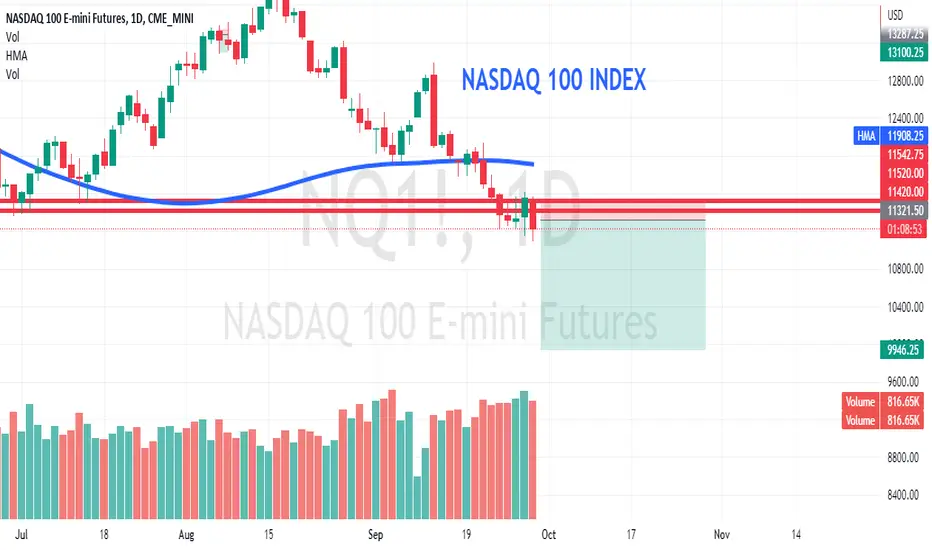
Nasdaq100 Bearish With High Probability!Hello ladies and gentlemen,
according to my chart analysis of the NASDAQ 100, there is a high probability of a decline toward the $1375.25 level in the next few weeks!
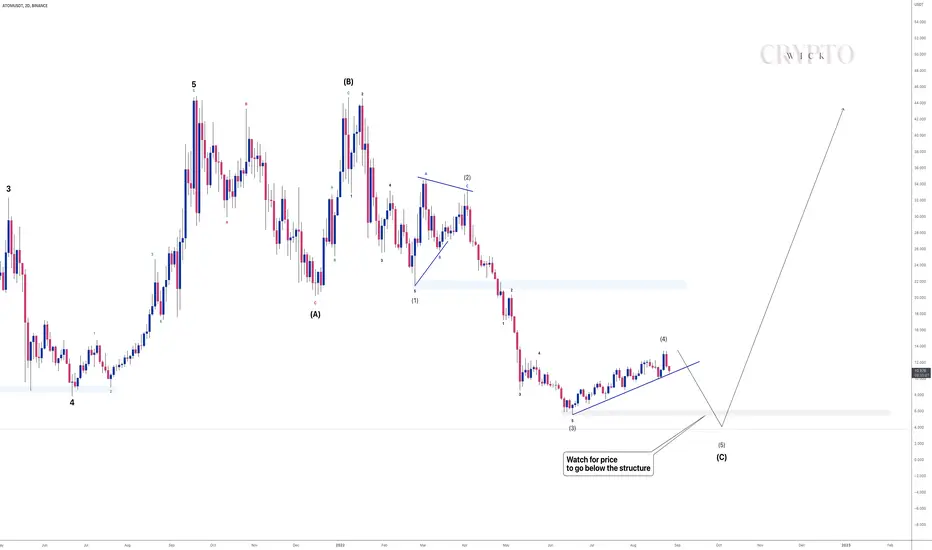
ATOM - BIG GAINS 💰Atom is almost at the end of its corrective wave. We are now anticipating the 5th wave, which should go below the end of Wave 3, hence why we want price to go below the structure.
Atom is offering one of the best returns. If we buy it at $4 and close at $40 , that's a 1000% return on your investment (atleast).
Trade Idea:
- Watch for price to go below the structure (below $6)
- Once we're there, look for bullish reversal signs such as trendline break, BOS etc.
- Targets: 20, 40, 60, HODL the rest
Goodluck and trade safe!
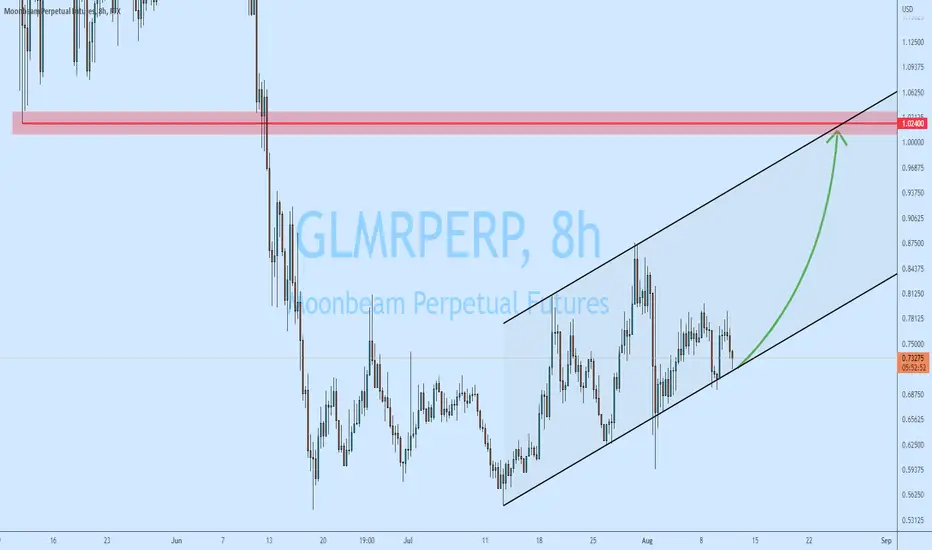
Moonbeam (GLM/USDT) time to buyWhat a nice long-term trade setup it might become. Of course, in our analysis, we are only looking for a short-term upswing. However, overall, the current price is so attractive for a buy-and-hold approach.
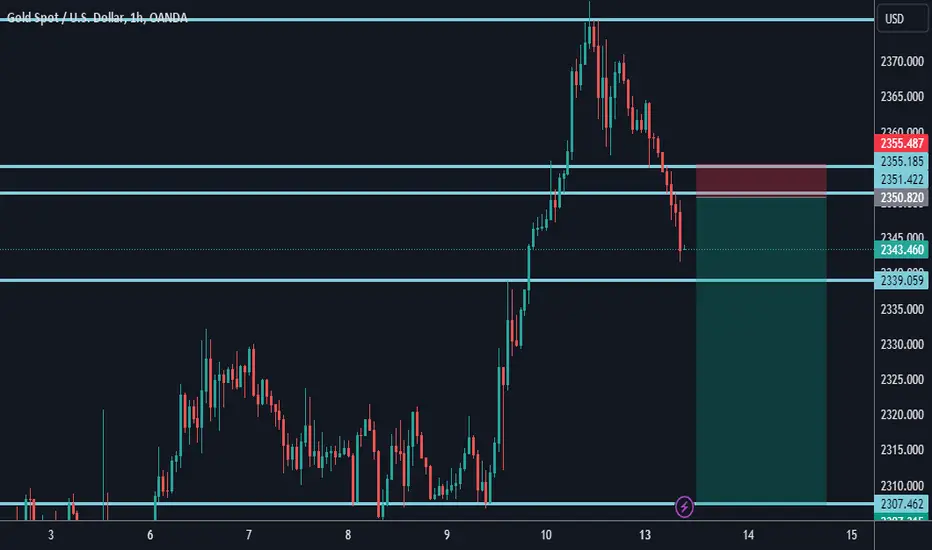
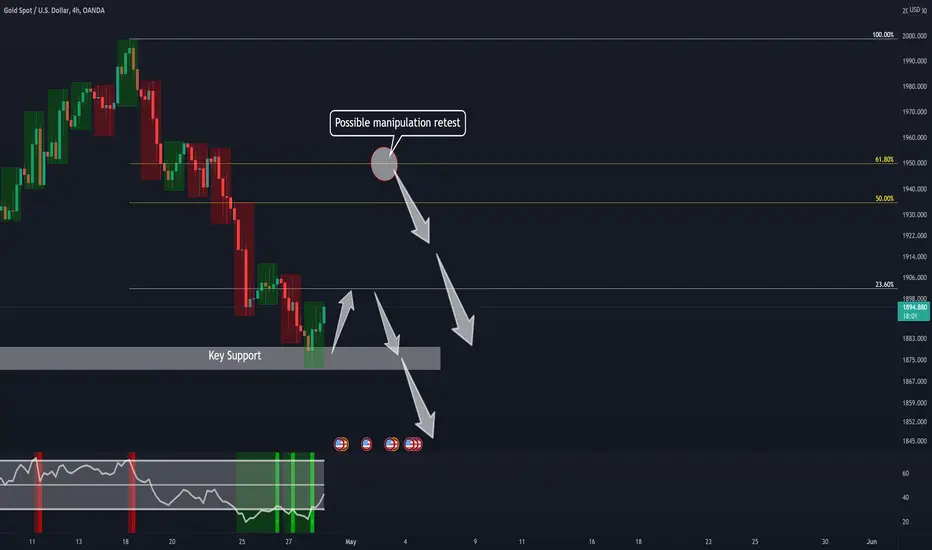
Gold Retest for Bears!!Hello Traders!
✔XAUUSD Is Bearish and has been pushing towards the downside for the last couple days
✔Price has had an continuation for the downside to a key support level
✔RSI is in Sellers position so Seller has most control
✔Fib can test a continuation level such as 23.6% (or 61.8%) BE MINDFUL!
5568 PIP Analysis
GRT AT BOTTOM???This is very risky trade but risk to reward is very small.
So enter at about 0.3195
sl 0.3139
tp1 0.48
tp2 0.65
Reason behind this trade is break ofs trucutre on 4h timeframe and grt is currently in weekly demand zone that caused pump of 2.8
This is risky trade because of btc movement also but we will see. Risk is only about 1 % (times your leverage you use) and possible profit is 60%
Giving out 1:60 rr
This tread depnds only on btc movement.

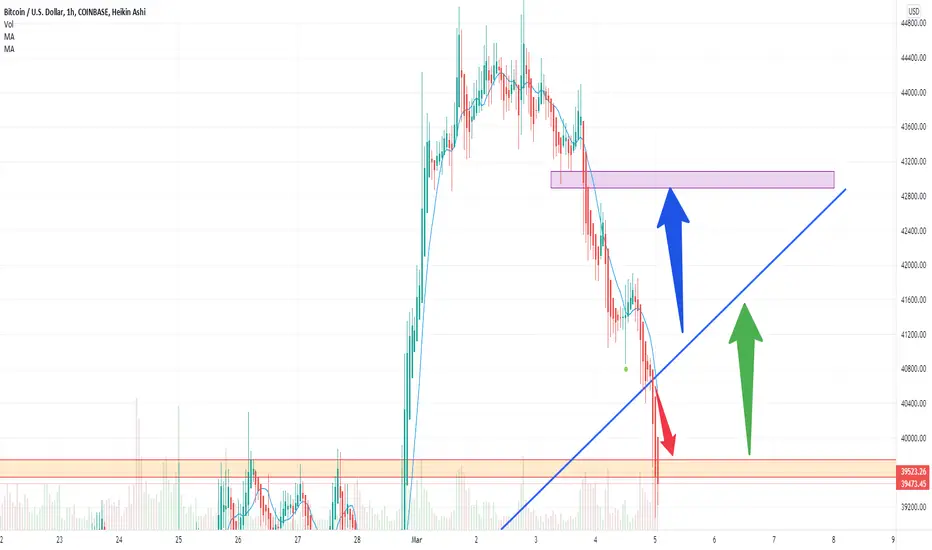
BTC/USD In Support Zone and will Up SoonThe price forms a double bottom pattern on the correction at 34350 and reverses. The level of 40950 was broken from below upwards, followed by a rollback to the level. I look forward to fixing the price above the level and growth. My target is the strong resistance level of 48200
Traders, if you liked this idea or if you have your own opinion about it, write in the comments. I will be glad 👩💻
short term buy on oilwaiting for the oullback to finish to look for an entry. May enter before market closes or after it opens around 6pm. going for about 150 pips to (8.oo to see if it will break this pervious resistance.
Russia has not begun backing down from Ukriane. they bombed Kharkiv, Ukrainian. Dozens were killed and hundreds wounded. ALso there is a possibility that oil will be pulled out of storage. U.S. storage is already the lowest its been since 2002. Supply fears causes oil to go up, they will have a decision by today or tomorrow.

XAUUSD (GOLD) 4H ChartTechnical:
The near–term support is around $1840, violation below targets $1830/$1818. Significant reversal only below $1750.The yellow metal faces strong resistance of $1880, any violation above will take to the next level $1900/$1912/1925 is possible.
It is good to buy on dips for $1868-70 with SL around $1840 for TP of $1900.
DISCLAIMER: ((trade based on your own decision ))
<>

Gold (XAUUSD) 4H ChartTechnical:
The near–term support is around $1815, violation below targets $1800/$1770/$1750. Significant reversal only below $1750.The yellow metal faces strong resistance of $1835, any violation above will take to the next level $1860/$1877/$1912 is possible.
Markets eye US CPI data on Thursday for further direction.
DISCLAIMER: ((trade based on your own decision ))
<>

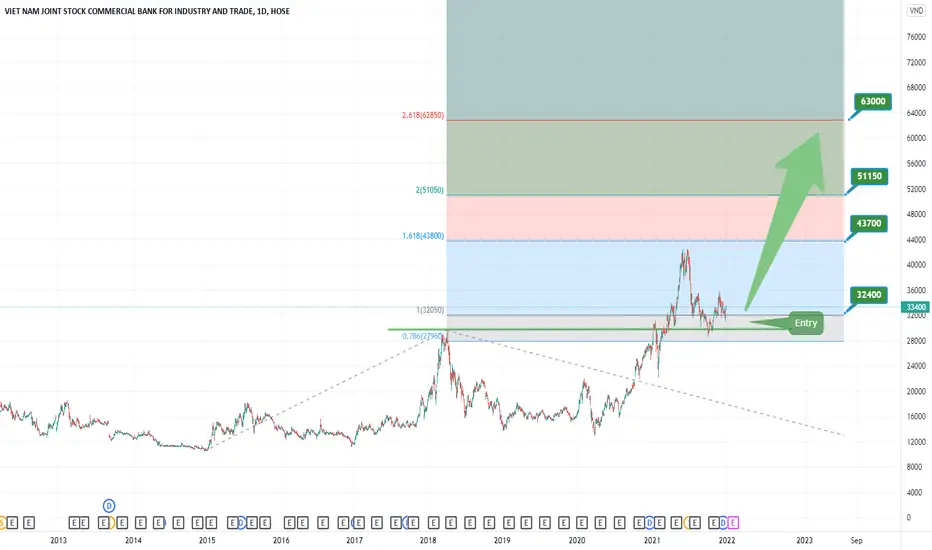
CTG VN30 Viettinbank LongThe price chart of viettinbank is currently at wave 4, which is also the price area at the support line created by wave 1. Currently, this is a relatively long accumulated price zone, there are signals showing strong growth in the near future.
Price target as shown in the picture. It is recommended that investors who reach their target exit the market and keep a good profit margin.
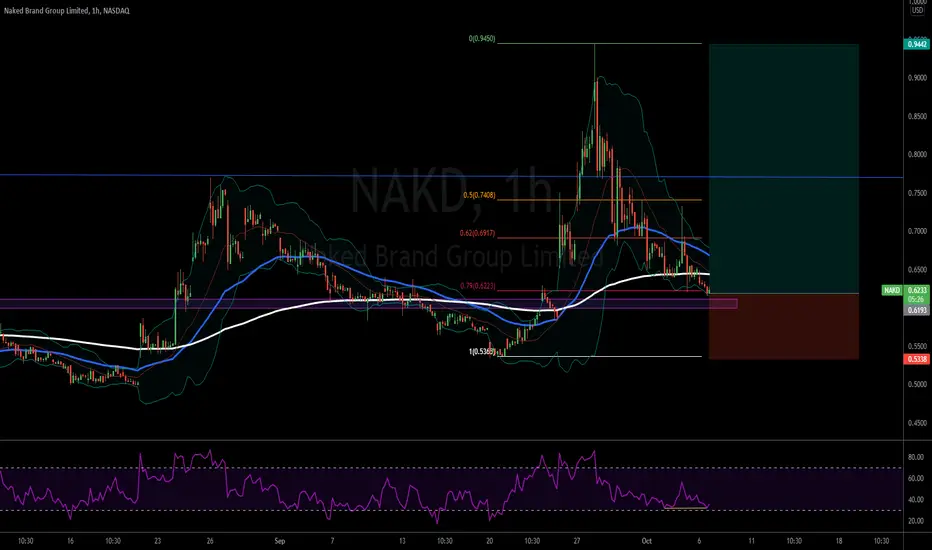
NAKD BuyPrice should return to at least past .7, the market has been pushing and making higher highs.