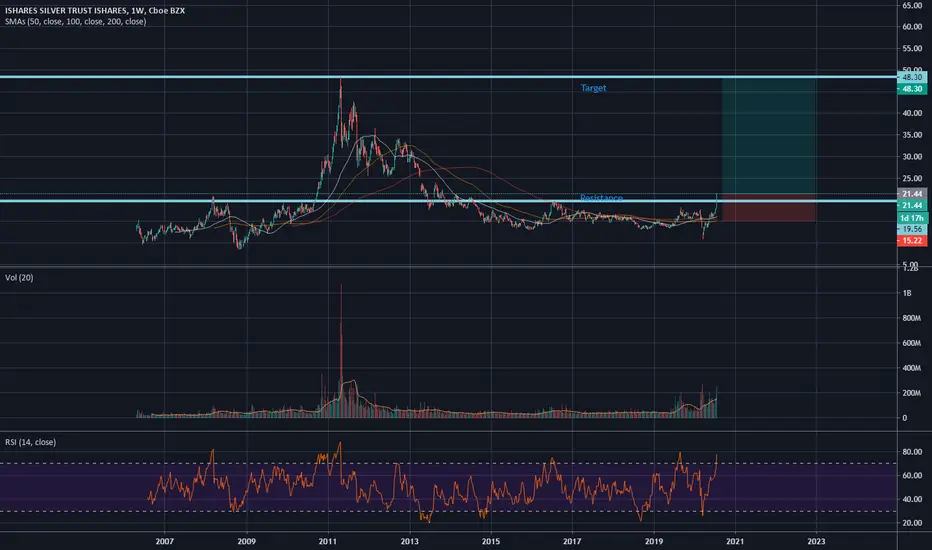
SLV LongFundamentals: Inflation hedge to record levels of global, central bank QE.
Technical Analysis: Bullish technical breakout of multi-year resistance.
Entry: $21:50 Target: $48
SLV
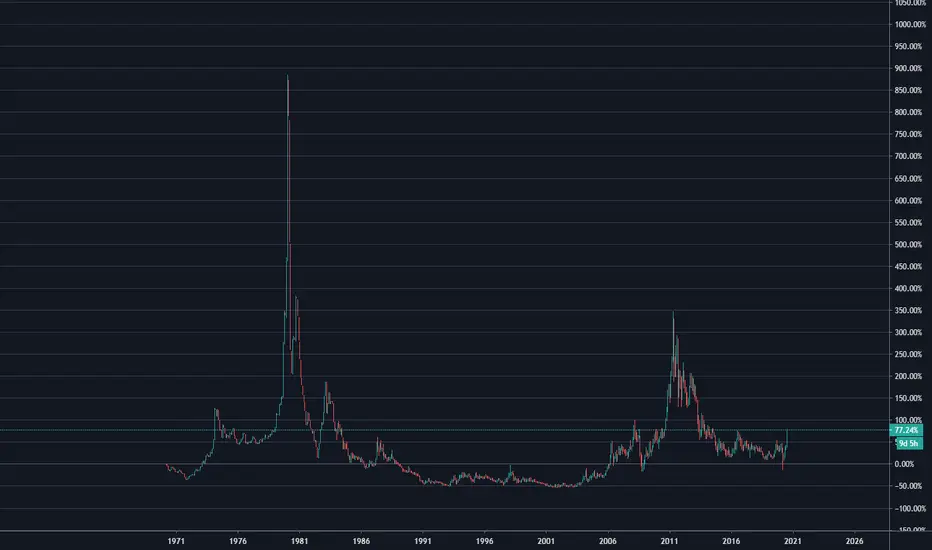
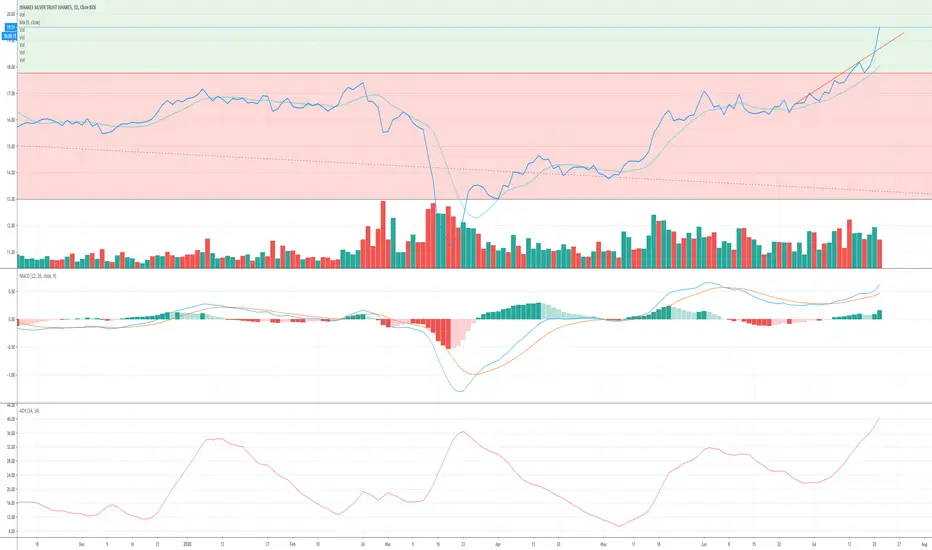
silver closer to the floor than the ceilingThe silver to gold ratio is telling a story worth listening to. It seems to be telling us that silver is still incredibly cheap compared to gold and is closer to the floor than the ceiling in terms of value when compared to gold.

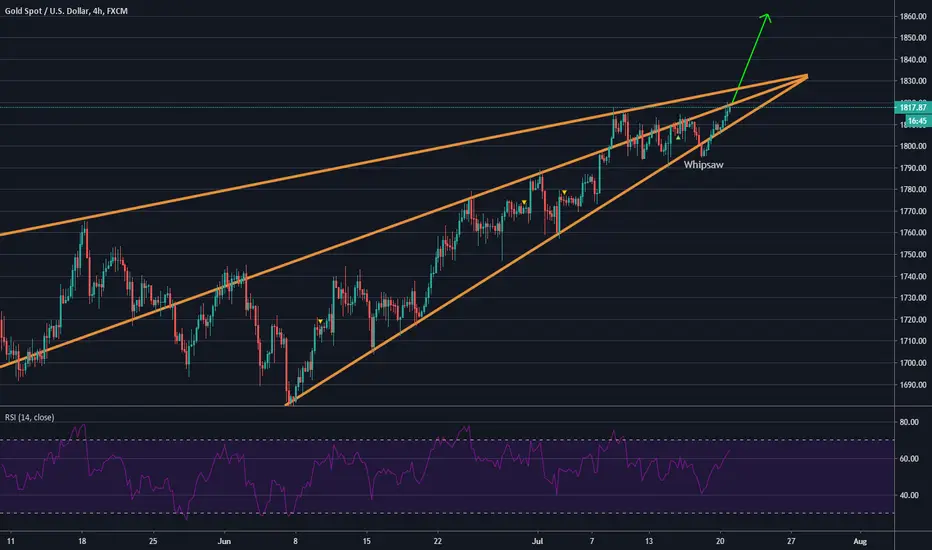
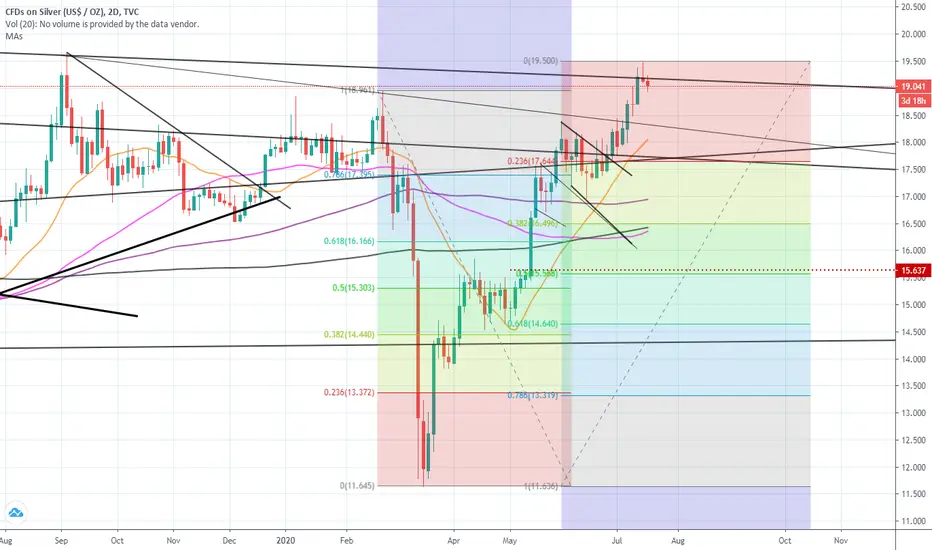
SLV - Silver triangleWe have the same setup in SLV like in XAGUSD.
Same triangle. Same multi month trendline.
The question is will the banks allow the rally or they just create a false breakout.
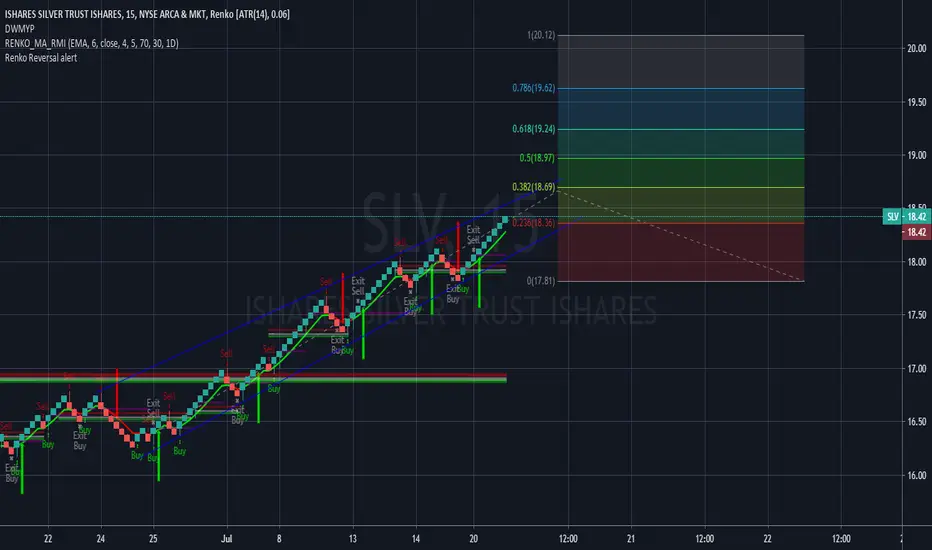
Volume looks good in SLV.

SLV and InflationGoing off of my previous chart on DXY, SLV showed multiple bounces off the 200MA before trading upwards in a channel, and just today breaking out with a huge bullish kicker. As the Fed may work to avoid rising inflation levels and reverse the price action of DXY, SLV ma look to fall back into its channel and fill the gap down.

$DXY and Inflation$DXY, the U.S. Dollar Currency Index has been steadily declining for some time now. Based on a chart analysis, we can see a double-top formation followed by a price consolidation that ultimately led to a breakdown once closing under a support trend line. After a fall of about 4%, an attempt was made to retrace. After a pullback, a second attempt was made, but that uptrend was much weaker, leading to the current downtrend. (Also noteworthy is the death cross of the 50SMA below the 200SMA which was followed by a strong bearish candle the next day). As the USD's value falls, we are getting closer to inflation, however it is approaching a support line. Additionally, GLD and SLV, the Gold and Silver ETFs have been on a strong bull run lately. While DXY may look to reverse back into a stronger value area, Silver and Gold, which are strong fallbacks when the value of the USD decreases, may look to pair the DXY reversal with an inverse price action.

Silver going parabolicSilver breaks $19 and reaches ATH in around 4 years, next resistance level @20.7
Silver still looks cheap especially compared to gold.
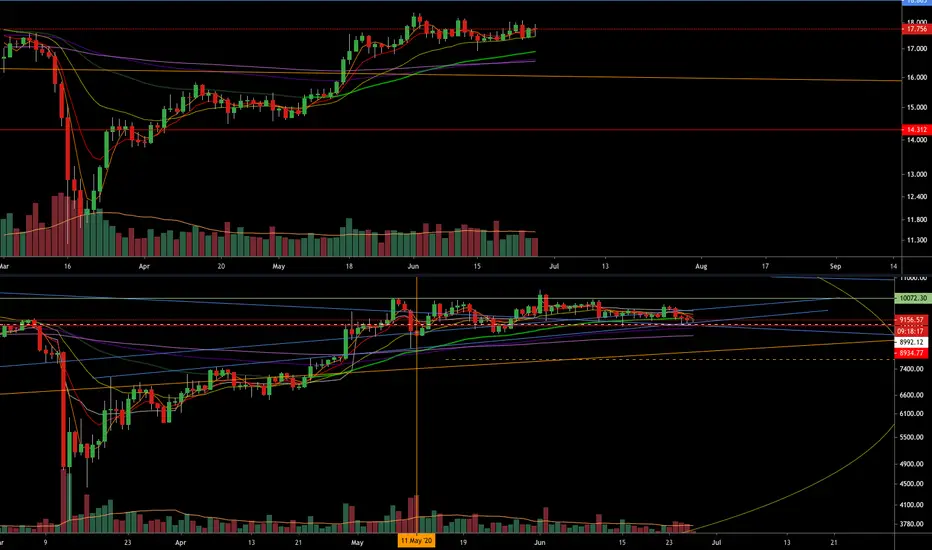
!GDX, !SLV Trade Updates Holding both positions long from the entry given on back in June here on my tradingview.

It has begun...It appears the path has been chosen. Bears may have a chance at the primary trend, but bulls look very very strong. A new all time high is in the cards for the summer season. Technically it should arrive in about 6 weeks.
Sept 1st prediction
AXUUSD 1900
GDX 52
GDXJ 66
XAGUSD this wild beast has broken free today. Who knows where he will fly to...
Strong Silver move SLV XAUUSD Remove "time" and look a price trends with Fibonacci ... see any patterns here?
I'll post 5-15 min moves also
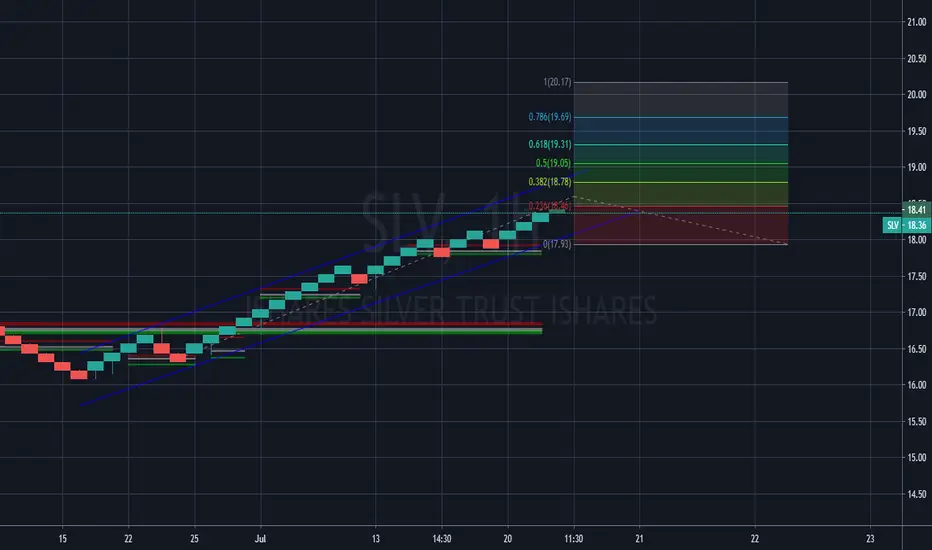
Long term? Silver $20
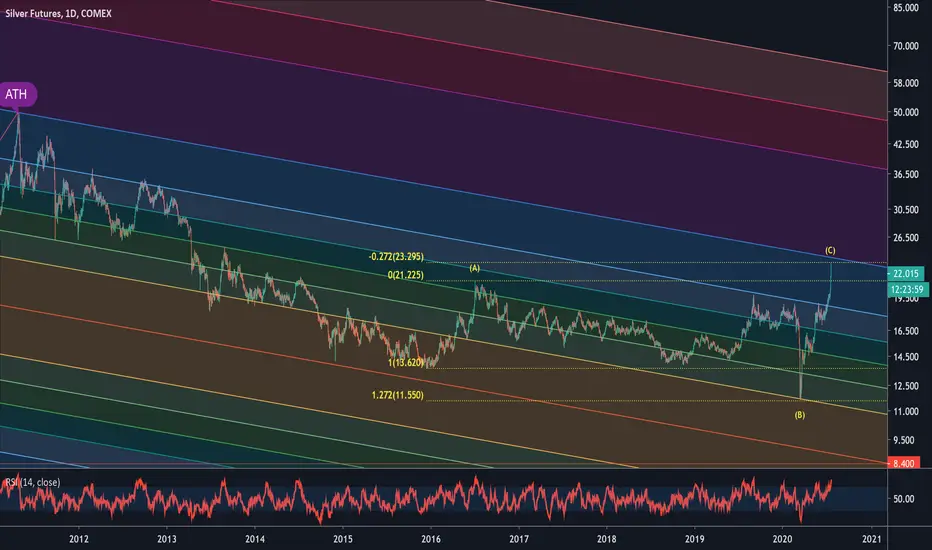
$SLV SILVER LONG TERM VIEW ~5-10 years Elliot Wave Theory EWTconsidering how long the initial move down took, i'd think the last wave down before we complete the correction that began in 2011 may take just as long or longer? still think pivot at median line of channel and those fibs though.

Eyeing a potential pullback in SilverI longed some silver via SLV since $15.50 spot. Silver is now at a major trendline and horizontal resistance area . I am looking for a correction in metals ( gold , silver ) to shake out weak hands, which may be a buying opportunity for the future. Ideally, silver may get back to the $16-14 handle. Above $20, I may add to my position on a breakout.
Gold is at a similar resistance; I would expect them to correct together.
Silver has been following BitcoinBitcoin price action has been leading Silver for about a week ahead. Can we use this to predict Silver prices?


$DXY Head and Shoulders PatternYES... that is the neckline. Check the link below and compare charts. You're welcome.
Link: www.mql5.com


Silver Breaking Out: Target $21$19 has been a key level for #silver for 4 years, getting rejected each time except for the false breakout in September. A breakout here would be meaningful. RSI still not overbought and price looks like it has some room to run. A breakout targets $21 initially

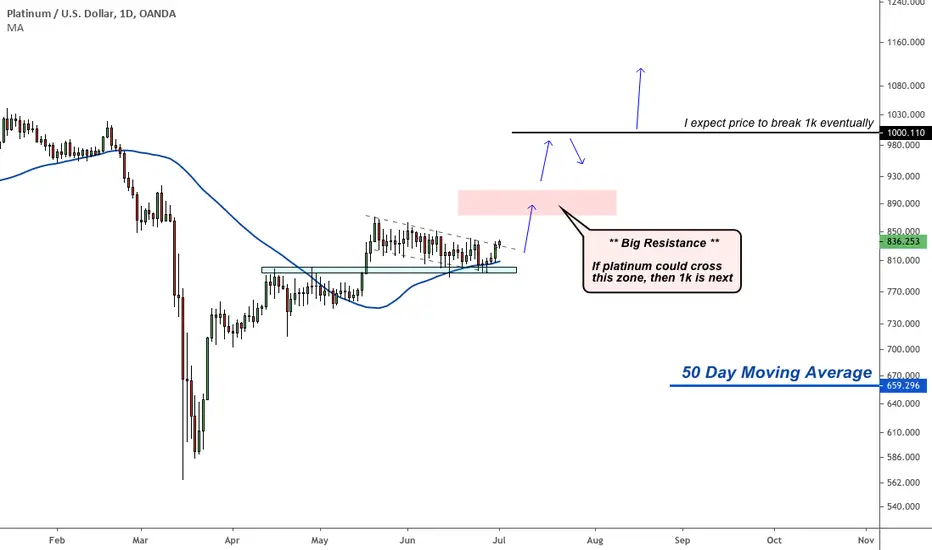
Major bull flag in PlatinumPlatinum is breaking out of a 5-6 week bull flag after tagging its 50 day moving average and reversing from major structure. Precious metals seem to be breaking out in general, but I particularly like the pattern in platinum. I am long all three (gold, silver and platinum).