Like Gold, Silver May Be Headed LowerI'm a little agnostic on the metals, because on the one hand, unprecedented central bank interventions should lead to inflation, and these are the two most accessible and obvious hedges against that. On the other hand, I believe that the deflationary forces trying to assert themselves in the world were abruptly arrested by those very interventions.
So, do we go up because of inflation or down because of deflation? I tend to lean toward further deflation.
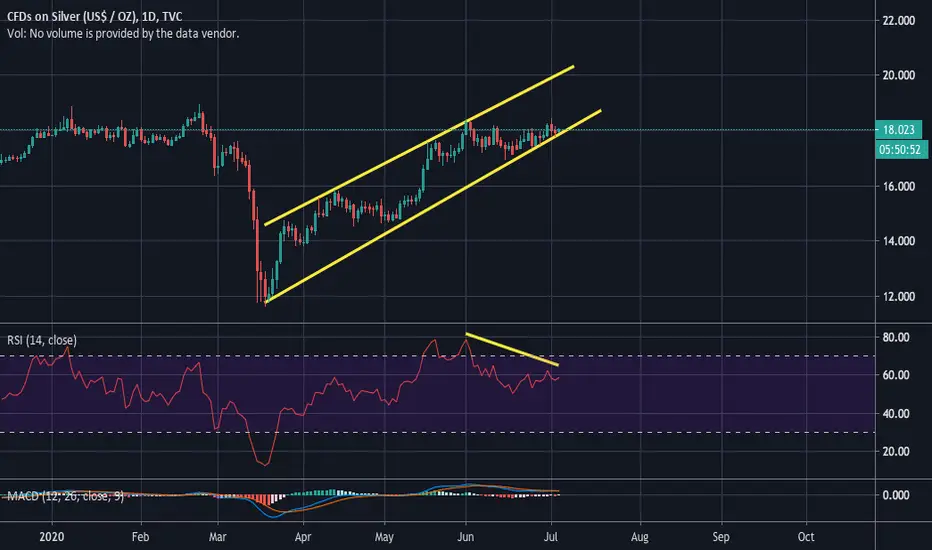
Now, my gold chart, which I have posted several times, still stands: I see a rising wedge with weakening buying. Likewise, with silver, I see a similar structure, though on a shorter time-frame than gold. Interestingly with silver, the RSI bearish divergence is quite sharp between the last two recent daily highs at 18.38 and 18.44. While eking out a new high in price on the first of July, it came nowhere near printing a higher high on the RSI.
That said, keep an eye on it. If it shoots to the moon, that divergence can be reversed into convergence. But I believe it would take a very large move to do so.
SLV
Silver Attempting $18/oz Support After BreakoutAfter trending mostly below $18/oz for nearly two months silver has recently broken above that resistance level and is currently testing $18/oz as support. If price can manage to hold above $18/oz and see a continued push higher then $19 will be the next level to watch for resistance. Should price fall back within the $17-$18/oz range then $17 will be the main level to watch for potential price support based on recent history. Below $17/oz would indicate the potential for a dip back to $16/oz.
The Relative Strength Index(RSI) shows the green RSI line holding just above the 50 level. 50 represents the midway point in the total RSI range(0-100) and in general an RSI reading above 50 indicates bullish short-term price momentum while an RSI reading below 50 indicates bearish short-term price momentum. The purple line indicates intermediate-term price momentum, which is also above the 50 level. In general, during an uptrend in price you want to see the green RSI line rising above the purple signal line and for both lines to be above 50. If both lines continue to hold at 50 and move higher it would indicate that short-term and intermediate-term momentum is shifting bullish. If both lines cross below the 50 level it would indicate a potential shift to bearish price momentum.
The Price Percent Oscillator(PPO) shows the green PPO line overlapping its purple signal line which indicates a loss in price momentum since the green line crossed down into the purple line. In an uptrend in price you want to see the green PPO line rising above the purple signal line, and for both lines to be above the 0 level, or centerline, as an indication of bullish price momentum. Both lines trending down and below the 0 level would be an indication of bearish price momentum. For now the PPO is showing a drop in short-term momentum while remaining bullish overall since both the green and purple lines remain above the 0 level.
The Average Directional Movement Index(ADX) show the green directional line overlapping the purple directional line which indicates a pullback in the short-term uptrend in price. When the green line is above the purple line it indicates an overall bullish trend behind price, while a purple line above green indicates an overall bearish trend behind price. The histogram in the background indicates trend strength. When the histogram is rising the dominant trend is increasing in strength, when the histogram is declining it indicates that the dominant trend is decreasing in strength.
Overall silver looks good for more gains going forward this year, especially if gold continues to move higher. Silver has severely underperformed gold in the rally this year as gold is back to 2011 levels up in the $1,800/oz range. If silver had kept up and went back to its 2011 levels price would be above $34-$40/oz today. Silver seems cheap here, as do mining stocks, if price begins to catch up to gold in gains.
My currently held gold and silver mining stocks/ETF’s: GDX, GDXJ, AG, GPL, KGC, HL, NGD, MUX, EXK, CDE.

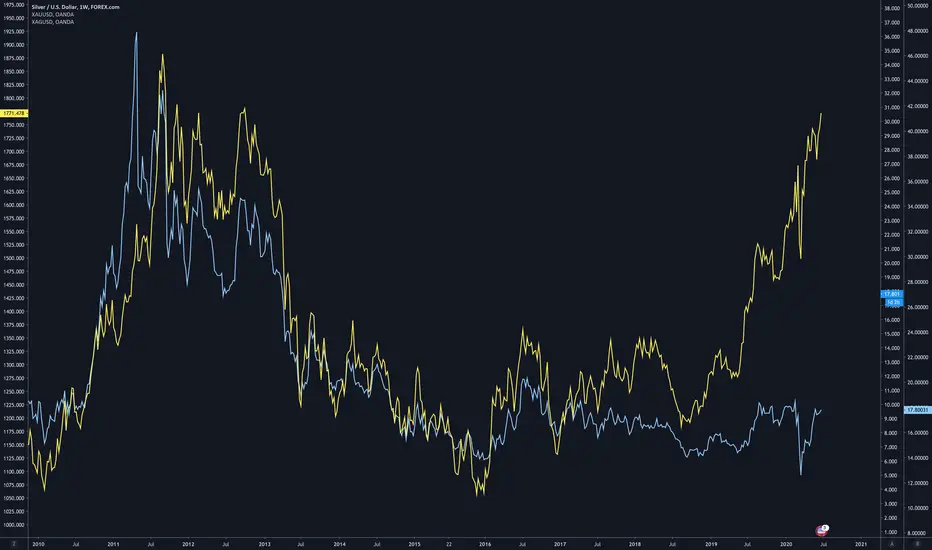
Gold/Silver Ratio Is FlaggingWhen the gold/silver ratio is high, gold is relatively more expensive than silver, by historical standards. Some people use this ratio to trade between the metals.
For a very long-term investor, the trade works like this: when the ratio is high, buy silver, and wait for the ratio to revert towards its mean. Then, sell the silver and buy gold at a better relative price and wait for the ratio to rise.
Using this oscillation you can accumulate precious metal using nothing but the mean reversion between the two metals.
Now, that said, the 19th century average gold/silver ratio, I believe, is around 47. By those standards, the ratio is extremely high right now. On the other hand, the rise has occurred in a very steady long-term rising trend channel that began during the Great Financial Crisis.
Long-term chart:
It seems to spend ages along one side of the channel before moving to the other and inhabiting that region for quite some time.
The question I cannot answer is: will the historical mean be revisited any time soon, or is the inflated ratio somehow a byproduct of unprecedented central bank intervention?
That said, I will add a couple of comments regarding the short-term picture. During the crash the ratio mooned, breaking out of the channel for the first time in geologic eons, and has since worked its way back in. The process of reentry looks to be taking the form of easily identifiable flagging, and that last flag looks to be breaking.
How would one trade this, if they were so inclined? I if they thought we were heading to the lower bound of the channel, one would buy silver now, and then if we find the bottom of that channel, perhaps swap it for gold, since the channel is gradually rising. That's just a guess. We live in unprecedented times and these assets might become quite volatile in the coming weeks and months.
If one believes we will ever revisit the ratio's very long-term mean in the 40s, they would only hold silver until it does. I have no idea if that will happen.


Hi Ho Silver!!!Silver historically has followed gold so according to this chart we should see a massive spike in silver over the next couple months... Past performance is not indicative of future results but this is as close as it gets.
Tight SLV play around Fib RangeSilver trapped in a range for Options with Straddles, Strangles and IC or BWB plays over next few days.
A breakout or drop will happen with inverse correlation with SPY. If XAUUSD breaks to new highs (1790?) then see XAGUSD and SLV lag by a few days/hours as well...
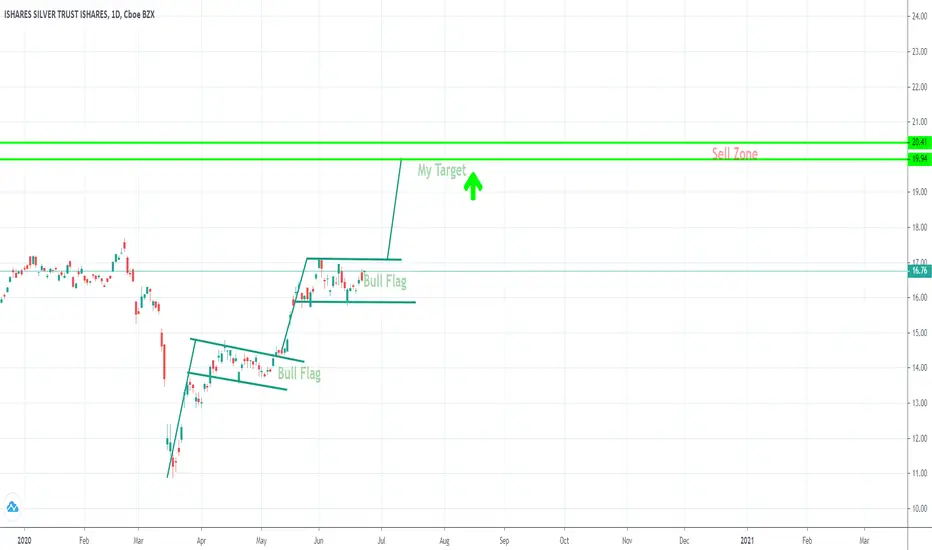
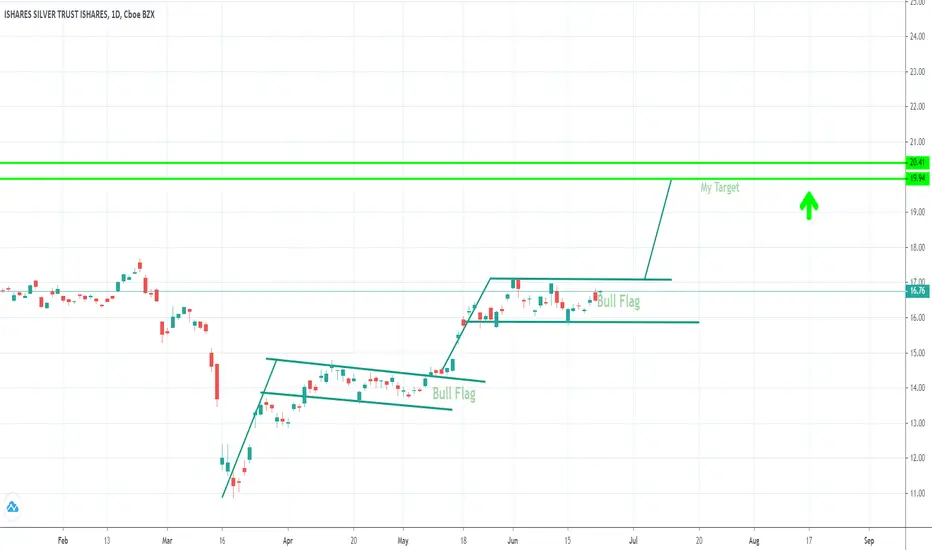

$SLV Lines Up Potential Bull Market Trend AheadSLV put in a perfect candidate for a long-term cycle low with the dive under $12 in March because it sliced through stops for even the most committed longs, leading to a world where metals are strong and stimulus is through the roof, forcing those same victims of the liquidity crash to stampede back in.
Bulls shouldn't hang on under $13.75 at this point.

XAGUSD SHORT 8 HOUR!!!Trend line is broken watch this one especially if the S&P keeps getting fed monopoly money lol
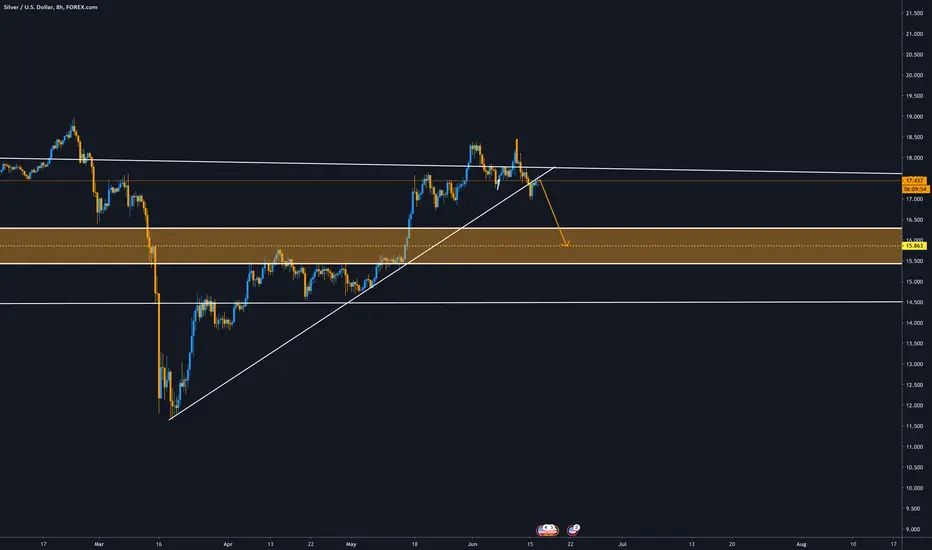
Short silverH&S, broadening desc wedge, hit resistance level, lots of targets below. Aggressively take this play, double down at broadening wedge resistance.
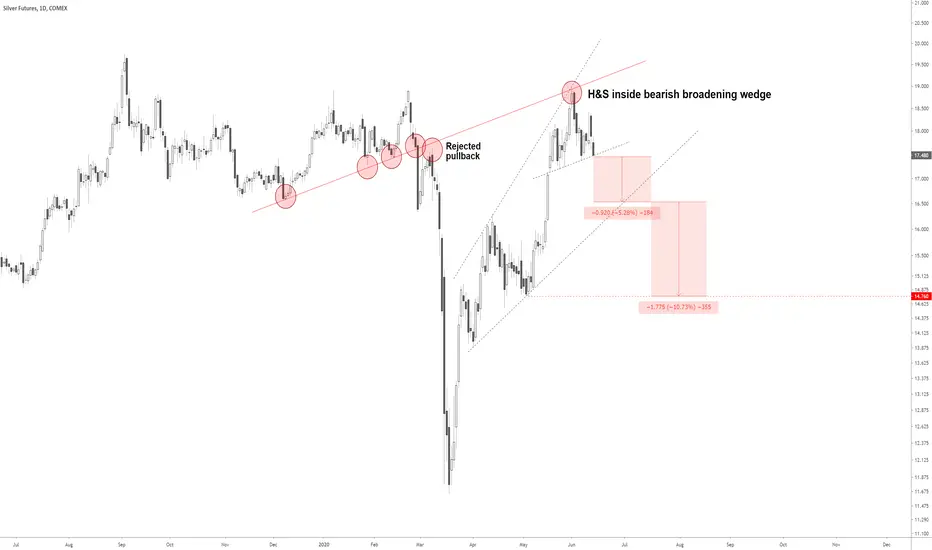


Short $AGShort $AG
10.37
SL 10.86 (-4.7%)
TG1 2.34 (+77.4%)
TG2 0.67 (+93.5%)
TD Sequential 9 Weekly

Rising support holds for Silver. Another test of 18.90 on deck?#Silver with a nice break out of the falling wedge this morning. Rising support from the March low held nicely. Price really needs to get above 18.18 for another run to 18.90. The next test of 18.90 will be the third since February. $SLV


