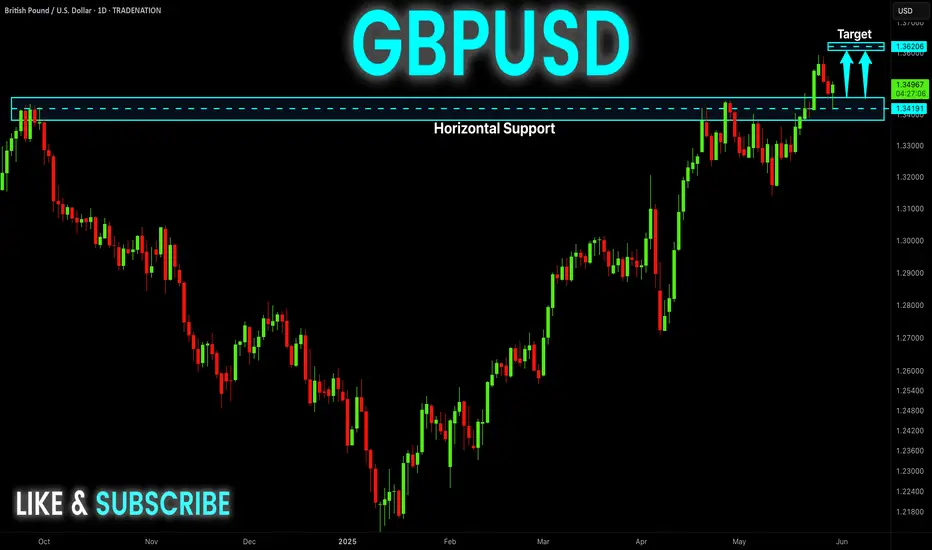
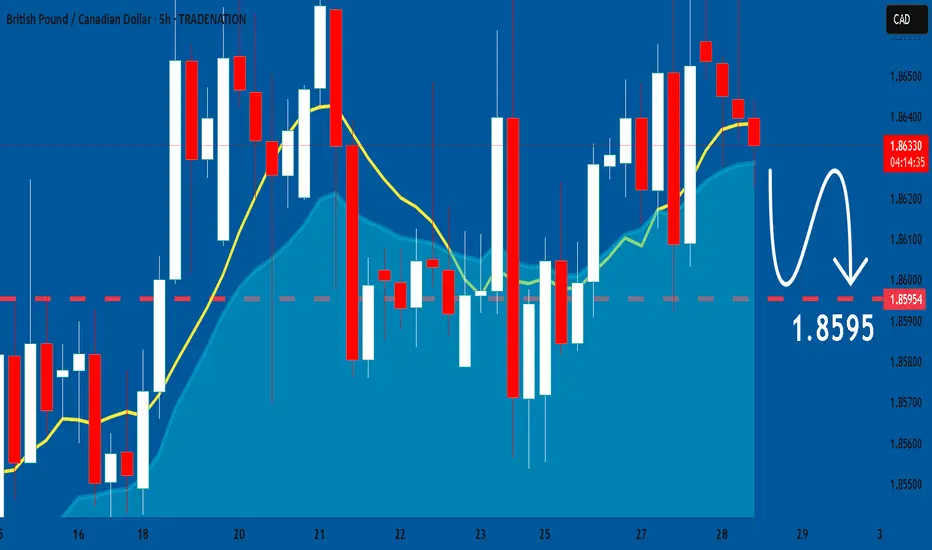
GBP-USD Swing Long! Buy!
Hello,Traders!
GBP-USD is trading in an
Uptrend and the pair made
A retest of the horizontal
Support of 1.3419 from where
We are already seeing a
Bullish rebound so we will be
Expecting a further
Bullish move up
Buy!
Comment and subscribe to help us grow!
Check out other forecasts below too!
Disclosure: I am part of Trade Nation's Influencer program and receive a monthly fee for using their TradingView charts in my analysis.
Smartmoney
XAUUSD Rejection from Fib + OB Combo | Bearish Continuation?XAUUSD | Premium Smart Money Short Setup 🎯
This GOLD setup is a straight-up institutional-grade bearish continuation. Let’s break down why this is a high-probability short for Smart Money Traders.
🔍 1. Market Context
Price is trending inside a clear descending channel, tapping into the lower boundary and now pulling back.
We just had a reaction from the mid-supply zone, and price is now rebalancing into the Order Block (OB) aligned with:
🔻 79% Fibonacci Retracement
🔻 Previous Structure Break
🔻 OB + imbalance fill zone
🧱 2. Bearish Confluences
📉 Descending Channel = bearish structure
🟣 Order Block Zone = high-value area for institutional entries
📐 Fibonacci Levels = 61.8%, 70.5%, and 79% all stacked
💥 OB + 79% = high-prob sniper short
🕳 Imbalance + Liquidity Sweep = likely short continuation
🎯 3. Trade Idea
Entry: 3282.00–3290.00 (OB + 79% Fib)
Stop Loss: 3294.00 (above OB wick)
Take Profit: 3245.00 zone (channel bottom)
Perfect RR setup 👇
⚖️ 4. RRR (Risk-Reward Ratio)
💰 Entry: ~3285
🔒 SL: ~3294
📍 TP: ~3245
✅ RRR ≈ 1:4.3 = sniper level swing short 🎯
🧠 5. Smart Money Logic
Liquidity Sweep above minor high before short = engineered trap
OB reaction at fib premium zone = smart entry
Continuation expected unless price closes above 3295
📌 Save this chart — this is Smart Money flow in action
💬 Drop “Gold OB SMC 🔥” in comments if you saw this coming
🔁 Repost to help fellow traders master fib+OB sniper entries

CHFJPY: Short Trade Explained
CHFJPY
- Classic bearish setup
- Our team expects bearish continuation
SUGGESTED TRADE:
Swing Trade
Short CHFJPY
Entry Point - 175.08
Stop Loss - 175.56
Take Profit - 174.16
Our Risk - 1%
Start protection of your profits from lower levels
Disclosure: I am part of Trade Nation's Influencer program and receive a monthly fee for using their TradingView charts in my analysis.
❤️ Please, support our work with like & comment! ❤️

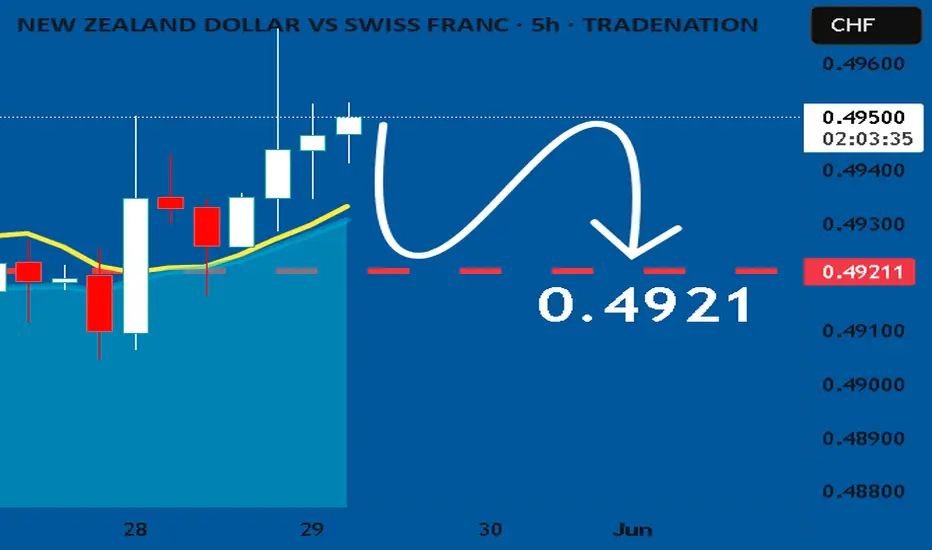
NZDCHF: Weak Market & Bearish Forecast
It is essential that we apply multitimeframe technical analysis and there is no better example of why that is the case than the current NZDCHF chart which, if analyzed properly, clearly points in the downward direction.
Disclosure: I am part of Trade Nation's Influencer program and receive a monthly fee for using their TradingView charts in my analysis.
❤️ Please, support our work with like & comment! ❤️
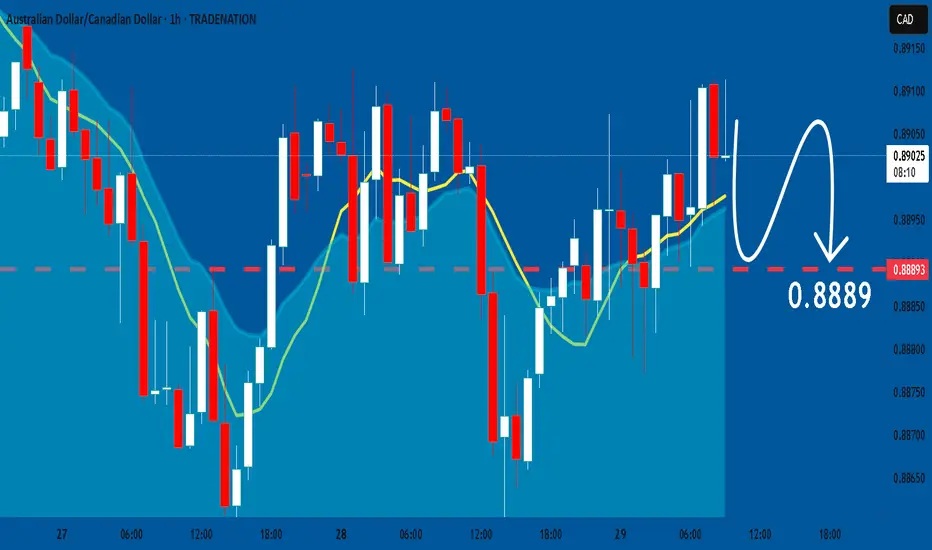
AUDCAD: Bearish Forecast & Outlook
The analysis of the AUDCAD chart clearly shows us that the pair is finally about to tank due to the rising pressure from the sellers.
Disclosure: I am part of Trade Nation's Influencer program and receive a monthly fee for using their TradingView charts in my analysis.
❤️ Please, support our work with like & comment! ❤️
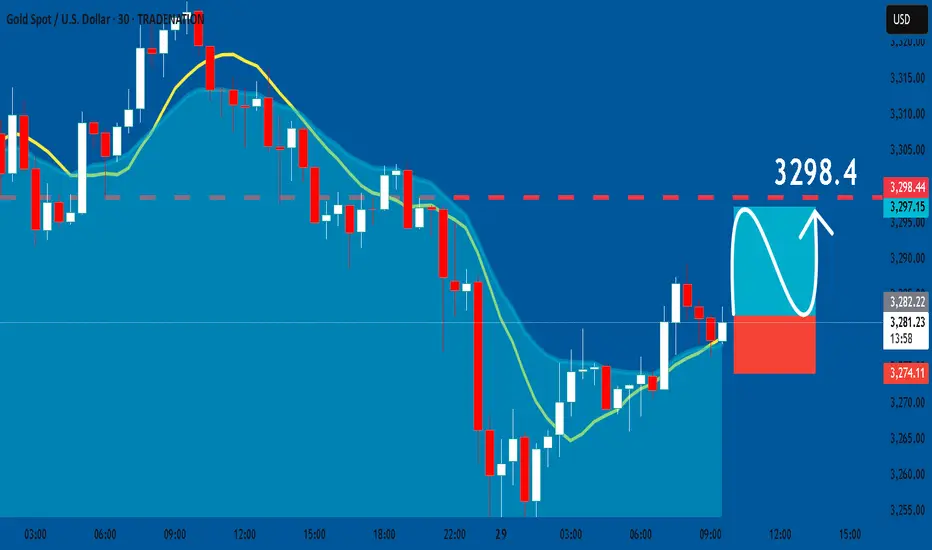
GOLD: Bullish Continuation & Long Signal
GOLD
- Classic bullish pattern
- Our team expects retracement
SUGGESTED TRADE:
Swing Trade
Buy GOLD
Entry - 3282.5
Stop - 3274.1
Take - 3298.4
Our Risk - 1%
Start protection of your profits from lower levels
Disclosure: I am part of Trade Nation's Influencer program and receive a monthly fee for using their TradingView charts in my analysis.
❤️ Please, support our work with like & comment! ❤️
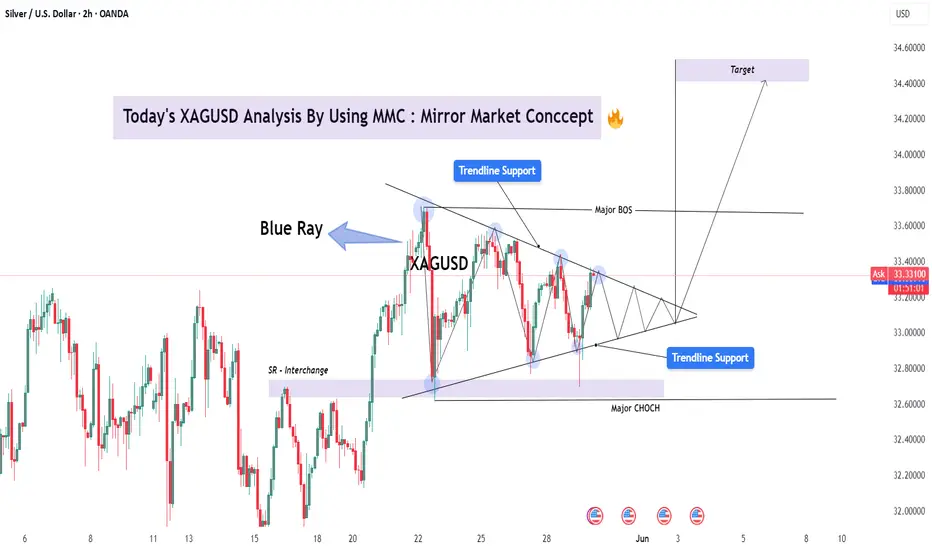
XAGUSD Analysis with MMC | Trendline + CHoCH Insight + Target🔍 Overview
This XAGUSD chart presents a classic Mirror Market Concept (MMC) pattern – a fractal, symmetrical market behavior often observed at key inflection points. The structure is currently forming a tight triangle pattern within two converging trendlines, signaling a compression phase before a significant breakout.
Mirror Market Concept relies on the idea that historical emotional market structures tend to repeat or reflect, especially in psychologically sensitive zones such as trendline tests, liquidity pools, and BOS/CHoCH areas.
📐 Technical Structure Breakdown
🔷 1. Trendline Resistance & Support (Triangle Compression)
Upper trendline connects successive lower highs, reflecting consistent seller pressure.
Lower trendline aligns with higher lows, showing bullish defense and accumulation pressure.
The result is a symmetrical triangle, often preceding explosive directional moves.
🔹 2. Blue Ray Zone
The "Blue Ray" acts as a historical liquidity pivot — a region where large wicks and rejections happened in both directions.
Price has respected this zone repeatedly, making it a likely impulse trigger area if revisited.
🔄 3. BOS (Break of Structure) and CHoCH (Change of Character)
Major BOS near the $33.60 area indicates a shift in market structure to bullish. The break above previous swing highs suggests buyers gained control temporarily.
Major CHoCH at the base of the triangle reflects where market sentiment shifted, initiating the current series of higher lows.
📍 4. SR Interchange Zone
Previous resistance around $32.80–$33.00 is now acting as support (interchange level), creating a confluence zone with the lower trendline and CHoCH point.
🎯 Forecast & Targets
✅ Bullish Scenario (Primary):
A breakout above the upper triangle trendline and confirmation above $33.60 will validate the bullish breakout setup.
Price Target: $34.40 – $34.60 (based on triangle height + measured move theory)
Expect impulsive follow-through as trapped shorts exit and fresh longs enter.
🚫 Bearish Alternative:
A breakdown below $33.00 with strong volume and bearish retest may invalidate the bullish setup.
In such case, a fall toward $32.20–32.40 is possible — completing a deeper retracement before any resumption of the upward move.
🔍 Market Psychology Behind the Pattern
This triangle represents market indecision, a "coil" where both bulls and bears are losing volatility while absorbing liquidity. The MMC concept teaches us that price often mirrors previous patterns — and the compressed energy inside triangles typically resolves in sharp momentum moves, mirroring the prior impulse.
Expect a strong breakout that "mirrors" the breakout leg from May 22 to May 23. This type of reflection-based logic is a cornerstone of MMC.
🔔 Trading Plan & Strategy
Entry: Wait for breakout and retest of the triangle boundary (ideally on 1H/2H close).
Stop Loss: Below the most recent swing low inside the triangle.
TP1: $34.10
TP2: $34.40
TP3: $34.60 (psychological level and measured move)
⚠️ Risk & News Considerations
Upcoming U.S. economic data events (highlighted on the chart) could act as catalysts. Be prepared for volatility spikes and fakeouts. Always use solid risk management.
GOLD (XAUUSD) Full Analysis – MMC Strategy in Action + Target🧠 What is Mirror Market Concepts (MMC)?
MMC is a psychological and technical framework that interprets market movements as mirrors of past behaviors, often using curves, rays, and emotional imprints to forecast price flow. It assumes that price reacts not just to levels but to memory zones left by institutional actions.
🧭 Chart Overview and Interpretation
1. Black Mind Curve Resistance:
The black curved line represents a dynamic resistance zone where the market previously showed sensitivity.
It aligns with psychological levels where institutional interest faded, marking a high-probability rejection point.
Note the smooth arc — MMC suggests such curves reflect subconscious market resistance.
2. Blue Ray – Institutional Reaction Line:
The blue ray points to a previous impulsive reaction zone near 3,320, marking an emotional high.
Price sharply rejected this area again, creating a mirror rejection.
This symmetry is key in MMC — the present move is reflecting the structure of the past.
3. SR Interchange Zone (Support-turned-Resistance):
Around the 3,290 level, price previously bounced from this zone (demand), but it has now flipped to act as resistance.
This SR Interchange is significant in MMC as it represents a "mental switch" — demand has turned into fear-based supply.
4. Break of Market Structure + Retest:
A clean break below the short-term bullish trendline followed by a rejection retest confirms the shift in structure.
This breakdown confirms bears are in control for now.
The recent candles show clear rejection wicks from the retest zone.
🎯 Trade Plan (Bearish Setup)
Entry Zone:
🔹 Enter between 3,275 – 3,285, where price is rejecting the SR flip and mind curve.
Target Zone:
🎯 First TP: 3,250 (MMC Support Zone – highlighted in purple below)
🛑 Optional Second TP: 3,240 if momentum continues post-news event.
Stop Loss:
🔺 Above 3,300 to allow space for false spikes, just beyond the curve rejection zone.
📉 Why This Setup Works (Psychological Flow)
The current price action is mirroring the left side of the chart — the same way price impulsively rose from a zone, it's now impulsively falling back into it.
The rejection from the Black Curve and Blue Ray are not just technical — they are emotional resistance zones, meaning institutions remember the reaction.
This creates internal balance that MMC traders look to exploit, riding the memory of the market.
🔔 Risk Factors & Considerations
Watch for the USD-related news event on the calendar (noted on chart). If high-impact, it can cause volatility and short-term spikes.
If price breaks and holds above 3,300, the bearish idea becomes invalid — don’t fight the market.
🧵 MMC Concepts Highlighted in This Chart
Black Mind Curve Zone – Dynamic psychological resistance
Blue Ray – Emotional ray from institutional rejection
SR Interchange – Support becomes resistance
Mirror Symmetry – Price behavior is reflecting the past
Emotional Imprint Zones – Past reactions leave future footprints
🗨️ Community Call-to-Action (CTA)
💬 What’s your view on GOLD today? Are you using Mirror Market Concepts in your trading?
Drop your thoughts, charts, or alternate views below — let’s build solid MMC case studies together!

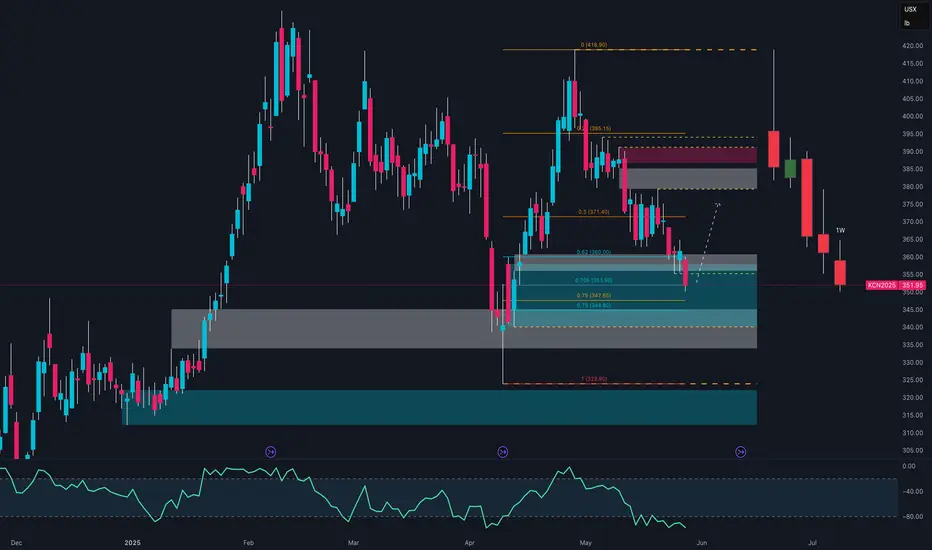
Coffee Pullback or Opportunity?The COT report dated May 20, 2025, reveals a gradual cooling of speculative sentiment in the coffee market. Non-commercials (speculative funds and money managers), who had largely fueled the strong rally towards the 420 USX/lb highs, are now closing long positions (–2,599 contracts), though they still maintain a significantly positive net exposure (+43,300 net contracts).
At the same time, commercials (industry operators such as roasters, exporters, and processors) have reduced both their long and short positions. However, the drop in short hedges (–4,103 contracts) is an important signal—it may suggest less need for downside protection at current prices, often an early sign of a potential market bottom.
Total open interest has decreased by 4,406 contracts, signaling a phase of liquidation and consolidation, where traders are reducing exposure rather than initiating new positions.
📌 Fundamental conclusion: The market is undergoing a healthy reset following the Q1 2025 boom, with speculators stepping back and commercials cautiously optimistic.
📈 Seasonal Analysis
Seasonal tendencies align well with the current technical outlook. May is historically a weak month, with negative average returns across most time frames (10y, 15y, 20y).
However, from June—especially July onward, data shows a strong seasonal rebound, with July–August being statistically the best-performing period of the year for coffee. This is partly due to climate-related risks (Brazilian winter, frost risk) and harvest/logistics cycles in key producing regions.
📌 Seasonal conclusion: June may offer a strategic accumulation window ahead of the traditional summer coffee rally.
🧭 Technical Analysis (Daily)
The KC1! daily chart clearly reflects a distribution and correction phase following the early March peak at 420 USX/lb.
Price has broken below the 355–360 demand zone and is currently testing a key support area between 340 and 325, previously established as a demand base during January–February 2025.
The medium-term trend remains bullish, but the market is now in a downward corrective channel, with lower highs and lower lows.
The weekly RSI sits in a low-neutral range—not yet fully oversold, suggesting there may still be room for further downside, though the bulk of the correction may already be priced in.
📌 Technical conclusion: The market is undergoing a deep pullback within a broader uptrend and is approaching potential reversal zones.
🔎 Strategic Outlook
The coffee market is in the midst of a cyclical and technical correction following its sharp Q1 2025 rally. The COT report reflects a rebalancing of speculative positioning, while commercials appear less aggressive on the short side. Seasonality favors a rebound starting June, and the technicals point to a potential long-entry zone around 340–325, attractive for medium-term positioning.
✅ Recommended Trading Setup
Base scenario (medium-term long):
Entry: Between 340 and 325 USX/lb (gradual accumulation)
Stop Loss: Weekly close below 320 (bearish confirmation)
Target 1: 390 (intermediate supply zone)
Target 2: 410–420 (return to highs)
Confluence: RSI support, COT shift, seasonal upside, technical demand zone
Alternative scenario (bearish breakdown):
Only if weekly closes below 320
This would open room toward 300–285 USX/lb
📌 Final Conclusion
While short-term caution is warranted, current conditions offer attractive long re-entry opportunities for those who await confirmation around the 325–340 support area.
The ideal setup would include:
Weekly stabilization with higher lows
Renewed speculative long positioning in COT
Seasonal momentum kicking in from mid-June
Gold isn't breaking out — it’s breaking down.What we're seeing in gold right now is not a temporary pause — it's a calculated, smart money-driven transition from impulsive expansion into controlled redistribution. The rally from 3120 to 3357 wasn’t organic or trend-based — it was mechanical, steep, and uncorrected. And that’s the first red flag. When price travels that far without building any real base or demand, it’s often not aiming for continuation, but to reach a liquidity target. This was a liquidity run, not a sustainable breakout.
Then comes May 24 — a pivotal moment. Price breaks above 3357, spikes volume +19% over average — but delivers a weak candle body. The next bar doesn’t confirm, doesn’t expand, doesn’t even push the high. Instead, we get a failed breakout followed by retreat. That’s textbook deviation — a classic trap where market makers dump inventory while retail rushes to chase the breakout.
This happens inside the derivation area — that thin, deceptive range between 3357 and 3370. It’s where distribution is masked as strength. But price behavior reveals the truth: after tapping that zone, it didn’t hold. Price fell back inside the range. No retest. No follow-through. And most importantly — price has now closed beneath the anchored VWAP from May 13, shifting the control of the tape.
Anchored VWAP matters — it's the average weighted cost of the dominant positioning from smart money. And once price falls below it and stays there, we know demand has dried up. Add to that: shrinking candle ranges, decreasing volume, soft closes — all signs of exhaustion. RSI has already pulled off from overbought levels, Stochastic is turning down, and ADX shows trend strength fading.
But those indicators are just the shadow of what price already told us. We’ve lost structure. A lower high is forming. Price was rejected from the same zone that was previously supposed to be the breakout. It’s not consolidation anymore — it’s redistribution.
The path forward is tactical and logical. Price is likely headed first toward 3275 — that’s the shallow liquidity pocket. From there, we might get a pullback to 3305–3315 — not a rally, but a retest of the old sell zone. That’s where another leg of short interest can build. Then comes 3250 — the bottom of the last structural block. If that fails to hold, gold opens the door to 3205–3215 — a historical volume shelf and the next real support.
There’s no guessing here. The breakout failed. VWAP is broken. Momentum is gone. This isn’t the start of something higher — this is the start of the unwind. And while retail waits for 3400, smart money is already loading their next leg short.

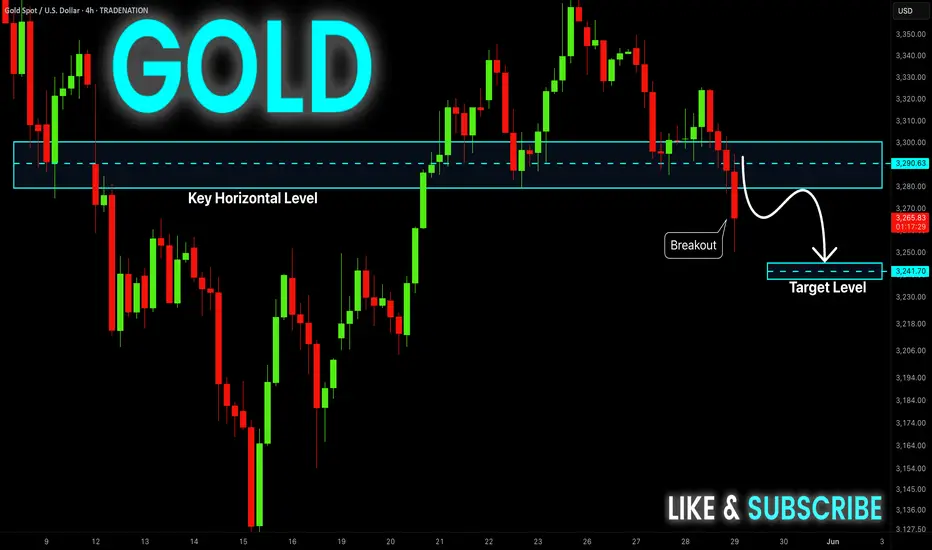
GOLD Bearish Breakout! Sell!
Hello,Traders!
GOLD made a bearish
Breakout of the key horizontal
Level of 3285$ which also
Seems to have been a neckline
Of the small H&S pattern so
We are locally bearish biased
And we will be expecting a
Further bearish move down
Sell!
Comment and subscribe to help us grow!
Check out other forecasts below too!
Disclosure: I am part of Trade Nation's Influencer program and receive a monthly fee for using their TradingView charts in my analysis.
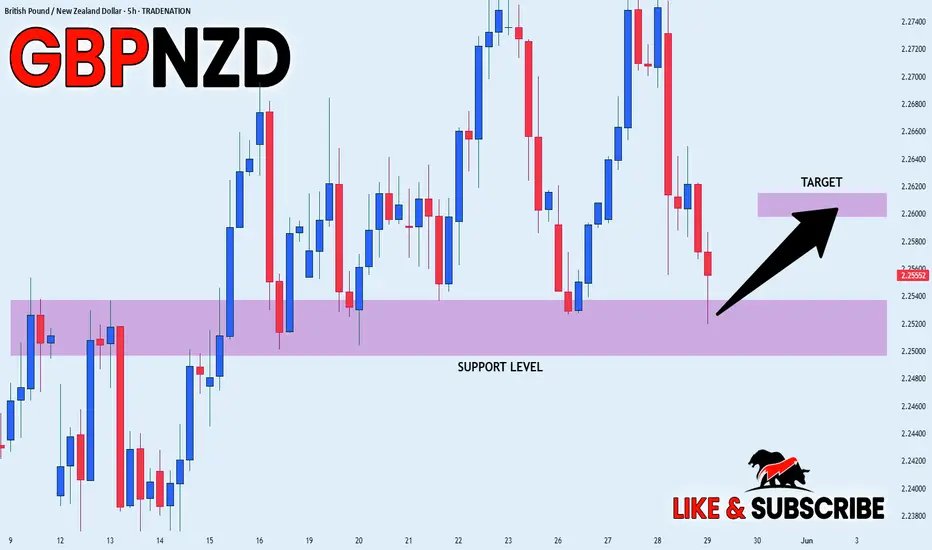
GBP_NZD RISKY LONG|
✅GBP_NZD is going down now
But a strong support level is ahead at 2.2520
Thus I am expecting a rebound
And a move up towards the target of 2.2609
LONG🚀
✅Like and subscribe to never miss a new idea!✅
Disclosure: I am part of Trade Nation's Influencer program and receive a monthly fee for using their TradingView charts in my analysis.
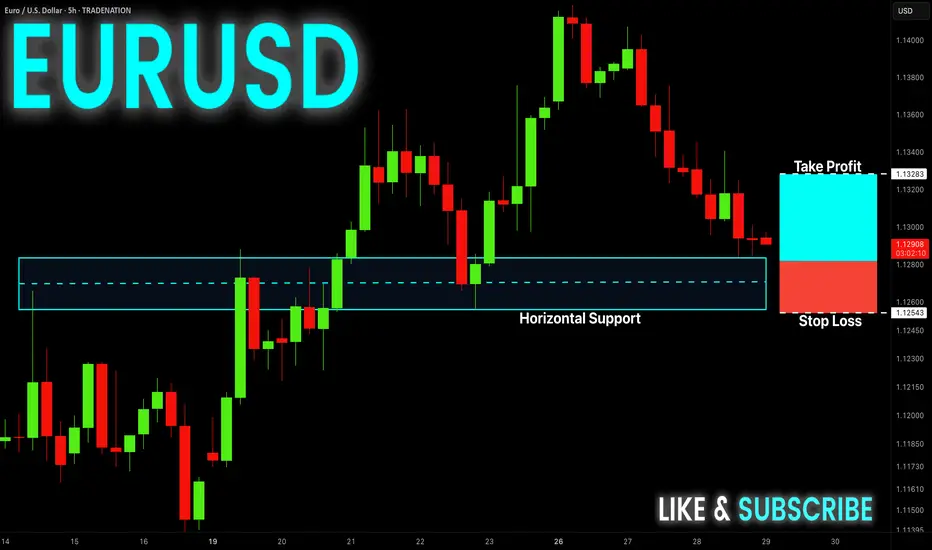
EUR-USD Free Signal! Buy!
Hello,Traders!
EUR-USD is going down
And the pair will soon hit
A horizontal support level
Around 1.1270 from where
We will be able to go long
With the Take Profit of 1.1328
And the Stop Loss of 1.1254
Buy!
Comment and subscribe to help us grow!
Check out other forecasts below too!
Disclosure: I am part of Trade Nation's Influencer program and receive a monthly fee for using their TradingView charts in my analysis.
USDJPY | Smart Money Long Setup – Deep Fib + OB Reaction💴 USDJPY | Institutional Long Play with Perfect OB + Fib Confluence
Price gave us an aggressive push off the demand zone, showing clear Smart Money accumulation behavior. This setup is high probability based on Smart Money Concepts (SMC).
🔍 1. Technical Breakdown
Strong impulse move upward
Clean pullback into the Order Block
Confluence with 70.5%–79% Fibonacci retracement zone
Price respected the OB zone and printed higher highs
That reaction was institutional — no cap 🧢.
🧱 2. Bullish Confluences
🔥 Order Block (OB): Purple demand zone = unmitigated
📐 Fib Sweet Spot: 70.5%–79% = institutional re-entry levels
✅ Strong Wick Rejection: Shows absorption of sell-side liquidity
📈 Market Structure Shift: Break of structure to the upside
🎯 3. Trade Plan
Entry: 142.89 (within OB + 70.5%)
Stop Loss: 142.00
Take Profit: 145.49 zone
This setup targets the -27% fib extension — a classic institutional TP level.
⚖️ 4. RRR (Risk-Reward Ratio)
💰 Entry: 142.89
🔒 SL: 142.00
📍 TP: 145.49
✅ RRR ≈ 1:2.9
Solid intraday-to-swing play with clean structure.
🧠 5. Key Confirmation Points
Break and close above 144.36 = confirmed bullish intent
Price respecting 143.44 OB = bulls still in control
SL below OB = protected by demand block
💬 Comment “SMC Long Sniper 💹” if you caught this move!
🔄 Share this if you love OB + fib sniper entries
📌 Save this setup for your next demand zone playbook

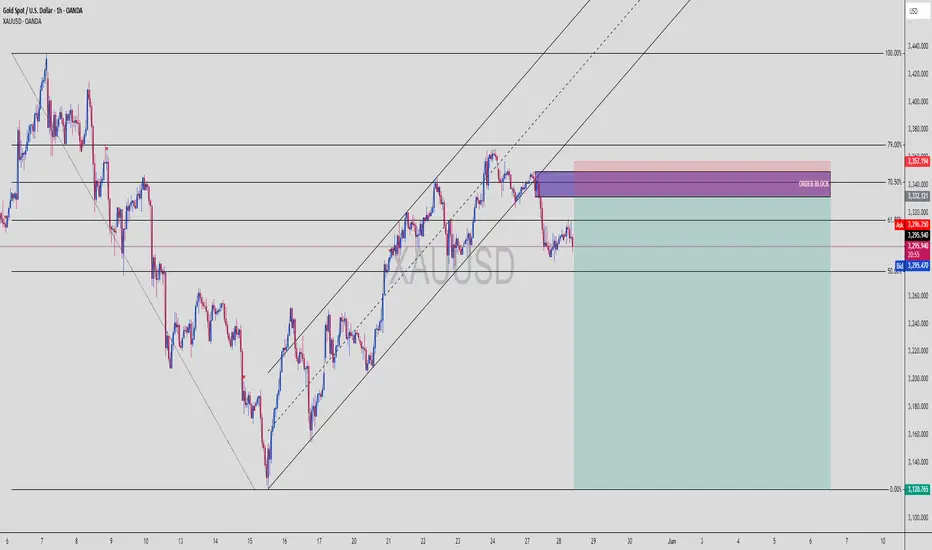
XAUUSD | Institutional Sell Setup – OB + 79% Fib Confluence🪙 XAUUSD | Gold Sell Setup Based on Smart Money Concepts
This is a classic example of how institutions lure in retail traders — tap the golden zone, reject hard, and leave a trail of liquidated longs.
🔍 1. Technical Breakdown
Price aggressively climbed into a strong Order Block zone
Rejection from the 70.5%–79% Fibonacci retracement area
Broken ascending channel confirms shift in momentum
Bearish BOS already occurred = Smart Money in control
This zone (3332–3357) is a magnet for institutional sells.
🧱 2. Bearish Confluences
💀 OB Rejection: Previous up candle before the sharp drop
📐 Fib Overlap: 70.5–79% = premium zone for shorts
📉 Structure Shift: Channel break + bearish order flow
⚠️ No Candle Close Above OB: = market respecting supply
🎯 3. Trade Plan
Entry: 3332–3357 (executed)
Stop Loss: 3360 (above OB)
Take Profit: 3120 zone
This is a deep sell-side liquidity hunt.
⚖️ 4. RRR (Risk-Reward Ratio)
📥 Entry: ~3345
🔒 SL: 3360
💰 TP: 3120
✅ RRR ≈ 1:15
This is a "swing short with conviction" kind of setup, where patience = profit.
🔁 5. Key Confirmation Points
Watch for lower lows and lower highs to continue
Price closing below 3290 = full confirmation
If Gold reclaims 3360 = setup invalidated
💬 Comment “Sniped Gold 🥷💰” if you took this short!
📌 Save this chart for OB + Fib zone study
🎯 Post your entry/exit levels — let’s compare setups
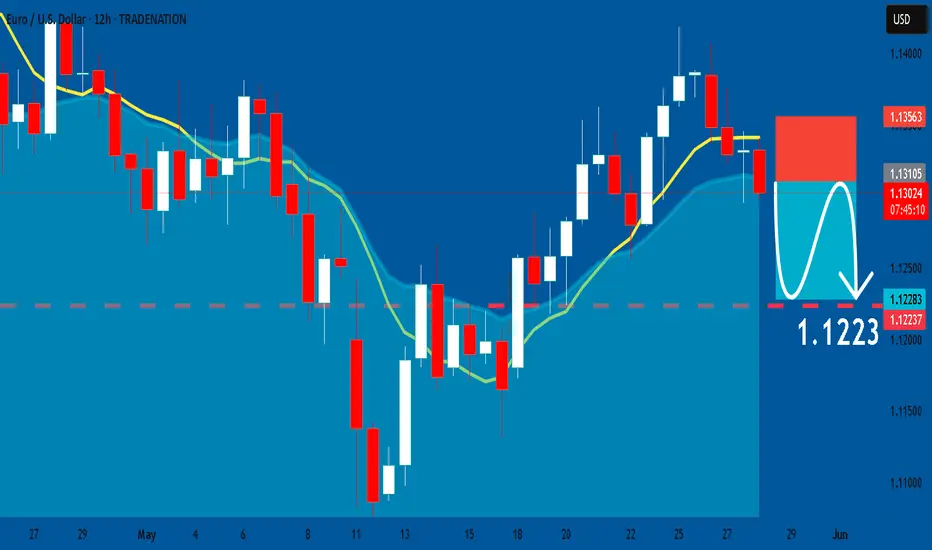
EURUSD: Bearish Continuation & Short Trade
EURUSD
- Classic bearish formation
- Our team expects fall
SUGGESTED TRADE:
Swing Trade
Sell EURUSD
Entry Level - 1.1312
Sl - 1.1356
Tp - 1.1223
Our Risk - 1%
Start protection of your profits from lower levels
Disclosure: I am part of Trade Nation's Influencer program and receive a monthly fee for using their TradingView charts in my analysis.
❤️ Please, support our work with like & comment! ❤️
GBPJPY: Short Signal with Entry/SL/TP
GBPJPY
- Classic bearish formation
- Our team expects pullback
SUGGESTED TRADE:
Swing Trade
Short GBPJPY
Entry - 194.65
Sl - 195.26
Tp - 193.50
Our Risk - 1%
Start protection of your profits from lower levels
Disclosure: I am part of Trade Nation's Influencer program and receive a monthly fee for using their TradingView charts in my analysis.
❤️ Please, support our work with like & comment! ❤️

Smart Money Entry Triggered – TP1 & TP2 in SightPrice broke a clean demand zone, which was previously respected as a reaction level, and indicated signs of accumulation. Following a corrective pullback, the buyers returned — consistent with higher time frame bullish structure.
???? Important Zones:
Demand Zone: 3,312 – 3,310 → Smart money re-entry area of interest
Sell Zone: 3,310 – 3,304 → Invalid if price breaks and closes below
TP-1: 3,318 → First liquidity zone
TP-2: 3,325 → Breakout continuation target
???? Bias:
Bullish as long as price remains above the demand zone.
Invalidation if price closes firmly below 3,304.
???? Strategy Summary:
Entry: 3,312 (within demand zone)
SL: 3,304.50 (below structure & sell zone)
TP1: 3,318
TP2: 3,325
This is a clean smart money chart with obvious risk-to-reward logic. If you benefited from it, leave your view in the comments!

GBPCAD: Bearish Continuation is Expected! Here is Why:
Looking at the chart of GBPCAD right now we are seeing some interesting price action on the lower timeframes. Thus a local move down seems to be quite likely.
Disclosure: I am part of Trade Nation's Influencer program and receive a monthly fee for using their TradingView charts in my analysis.
❤️ Please, support our work with like & comment! ❤️
EURGBP: Bears Will Push
Remember that we can not, and should not impose our will on the market but rather listen to its whims and make profit by following it. And thus shall be done today on the EURGBP pair which is likely to be pushed down by the bears so we will sell!
Disclosure: I am part of Trade Nation's Influencer program and receive a monthly fee for using their TradingView charts in my analysis.
❤️ Please, support our work with like & comment! ❤️

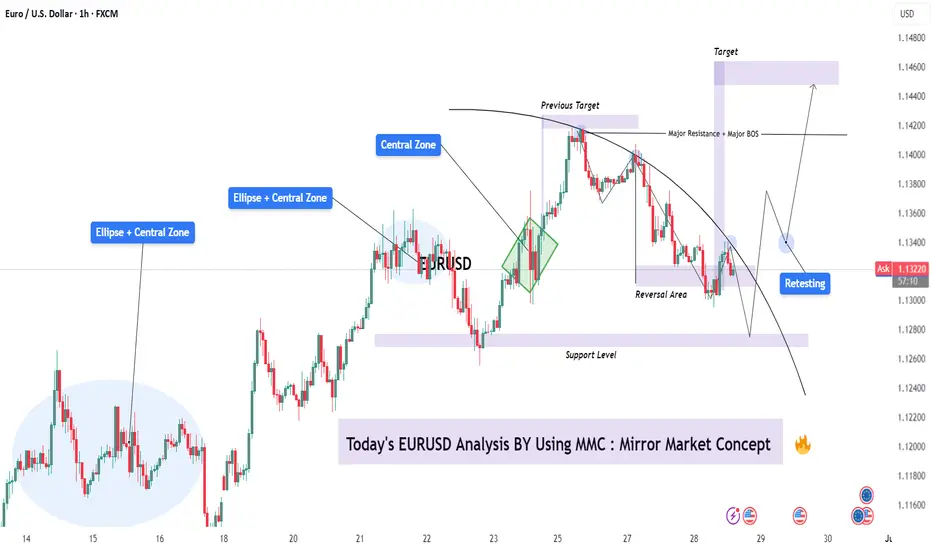
EURUSD Mirror Market Concept – Retest Before Bullish Expansion 🔍 Analysis Summary:
This EUR/USD setup is constructed using the Mirror Market Concept (MMC), which identifies price behavior patterns that tend to "mirror" across central zones or key support/resistance levels. The chart highlights multiple "Ellipse + Central Zone" regions that represent strong consolidation and price decision areas, reflecting symmetry in market reactions.
📈 Key Technical Insights:
Central Zones & Ellipses: These are repeated zones where price action has shown symmetry in both accumulation and distribution phases. Watch how these ellipses mirror prior moves, indicating likely zones of reaction.
Previous Target & Reversal Area : The market completed a leg to the previous target (around 1.1410), followed by a rejection from a major resistance zone, initiating a reversal. This aligns with the Mirror Market structure, where the move downward reflects the previous bullish leg.
Support Level: A significant support zone has been marked near the 1.1275 level. Price action reversed from here, respecting this base and forming a reversal zone.
Retesting Phase: After bouncing from support, the price is entering a retesting phase around the 1.1330 level (identified ellipse). This retest is critical—if held, it could trigger bullish continuation.
Major BOS (Break of Structure): Once price breaks and sustains above the 1.1360–1.1380 region, it will confirm the BOS and pave the way toward the final Target Zone at 1.1450–1.1470.
🎯 Trade Plan Overview:
Bullish Scenario: Look for confirmation of support near 1.1320–1.1330 during the retest. If price holds and forms bullish structure (e.g., higher lows, bullish engulfing), consider long setups targeting 1.1450.
Bearish Invalidator: A breakdown and close below the support level at 1.1275 would invalidate the bullish bias and call for reevaluation of the setup.
🧠 Final Thoughts:
This analysis reflects the mirror behavior of price and the market psychology around equilibrium zones. MMC provides a structured way to anticipate future price action by understanding how historical reactions unfold. Watch key zones and wait for confirmation before engaging.
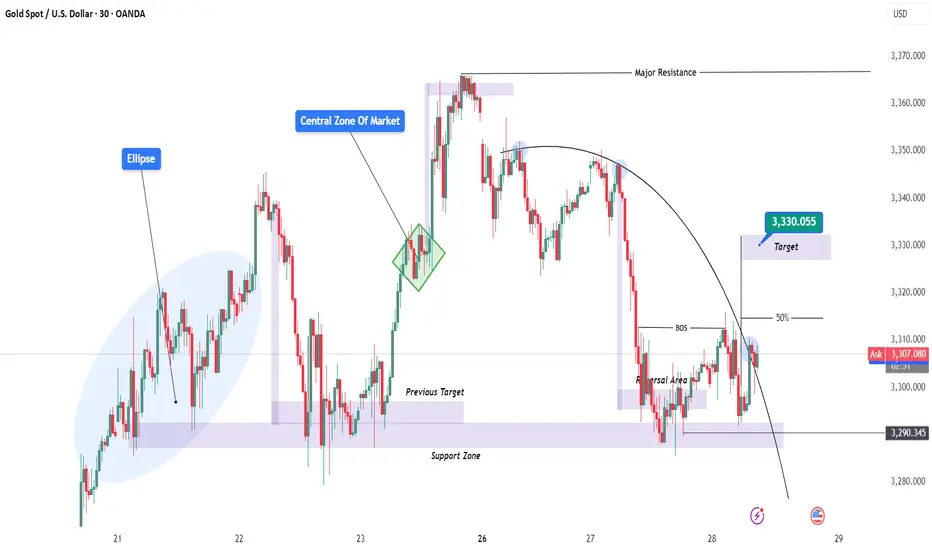
XAUUSD (Gold/USD) – Smart Money Setup with Key Zones & Target 🧠 Market Summary:
This chart shows a classic Smart Money Concept (SMC) play. We're looking at how big players (banks, institutions) trap retail traders, push price through liquidity zones, and move toward their real targets.
📌 Detailed Breakdown:
1️⃣ Ellipse Zone (Left Side – Accumulation Phase)
This shaded ellipse shows where price was moving sideways in a tight range. This is a classic accumulation zone, meaning big players were quietly building their long positions.
✅ Price stayed in this range from May 20–21 before breaking out with strong bullish candles.
👉 What this means: Institutions are loading up. Once they’re filled, they push price upward fast.
2️⃣ Central Zone of Market (Green Diamond)
After the breakout, price made a small pause/retest, which we marked with a green diamond.
This is a re-accumulation area—a temporary consolidation before another push up. It’s also a mid-point, showing the “central engine” of this price move.
👉 What this means: Market still bullish here, collecting more orders.
3️⃣ Major Resistance Zone (Top of Chart)
Price reached this supply zone near 3,360–3,370 and immediately faced strong rejection.
You can see:
Long wicks at the top
Bearish pressure stepping in
Start of a curve formation
👉 What this means: Big players are offloading their long positions and preparing for a reversal.
4️⃣ Rounded Top Curve (Distribution Phase)
Notice the arc shape drawn over the candles.
This is a distribution pattern — a rounding top that shows price is topping out slowly. It’s often a sign that smart money is exiting while trapping late buyers.
🔻Price then dropped aggressively, breaking structure.
5️⃣ BOS (Break of Structure)
A major bearish signal occurred here.
Price broke a recent low and created a BOS (Break of Structure) — a strong confirmation that the market has shifted from bullish to bearish.
👉 What this means: Now we look for retracement entries to go short.
6️⃣ 50% Retracement + Reversal Area
After the BOS, price pulled back to the 50% Fibonacci level and hit a small resistance zone (highlighted in purple). This is a classic area for smart entries.
✅ This level rejected price again — showing bearish confirmation.
7️⃣ Target Zone – 3,330.055
A clean, well-defined target area where:
Liquidity rests
Previous orders may get triggered
Market could react strongly
👉 If price pushes into this zone again, expect a reaction (either continuation or a reversal).
8️⃣ Support Zone – 3,290.345
This is your final support zone if the market continues to drop.
If price breaks this support, it could open room for a larger bearish move.
🎯 Trading Plan (Example):
📈 If price retraces to 3,330.055 and shows rejection → consider short setup
📉 Watch 3,290.345 for bounce or breakdown
❌ Invalidation: Break above 3,370 (major resistance)
💡 Bonus Tip – Trading Psychology:
“Smart money doesn’t chase. It waits for the trap to be set, then strikes with precision.”
Stay patient. Don’t rush entries. Let price come to your zones.
🏁 Summary:
This chart is a full example of smart money manipulation, showing:
Accumulation → Expansion → Distribution → Breakdown
BOS + 50% retrace = high-probability short
Key zones: 3,330 (Target) & 3,290 (Support)
📢 Don’t Forget:
If this analysis helped, drop a like, share, or comment your view below!
#XAUUSD #GoldAnalysis #SmartMoney #PriceAction #TradingView #Minds #ForexStrategy #GoldSetup #SMC #LiquidityZones
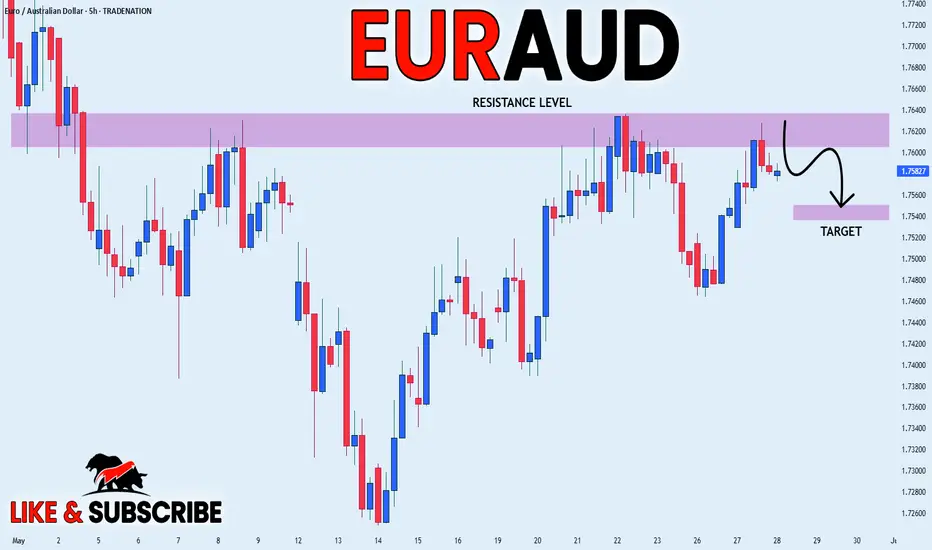
EUR_AUD WILL GO DOWN|SHORT|
✅EUR_AUD price grew again
To retest the resistance of 1.7640
But it is a strong key level
So I think that there is a high chance
That we will see a bearish move down
SHORT🔥
✅Like and subscribe to never miss a new idea!✅
Disclosure: I am part of Trade Nation's Influencer program and receive a monthly fee for using their TradingView charts in my analysis.