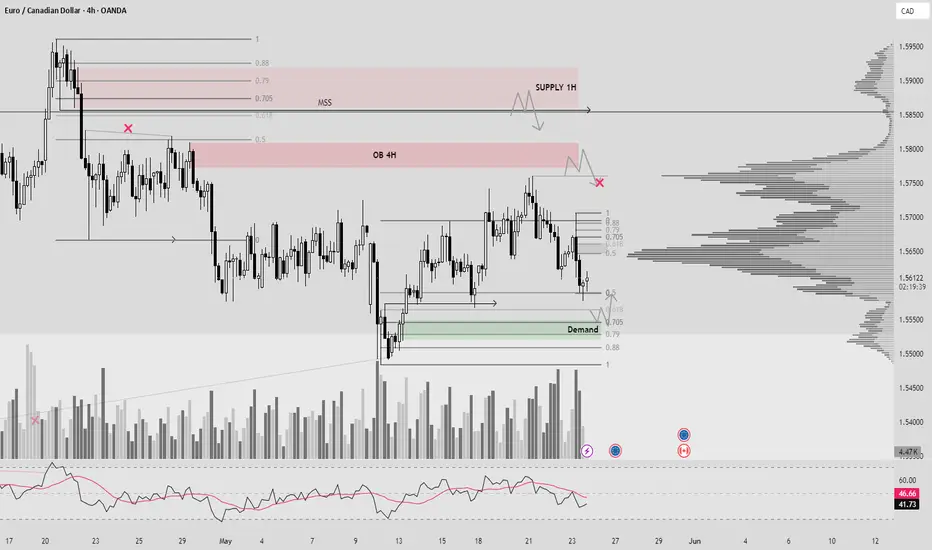
EURCAD (Supply/Demand + OTE + Liquidity)Hello traders!
We have valid 705 fib level, there we can expect reversal + mitigation demand zone.
Now price go to local correction. In local 0.5 fib level you will see big volume like confirmation before impulse till Demand.
Entry: confirmation on LTF in POI
Target: First problem zone is OB 4H
MAIN MOVE IN SHORT - TILL 0.5 of GLOBAL FIB LEVEL. SEE PRIVOIUS IDEA.
Demand zone also can be like fuel, so
Have a profitable day and don't forget to subscribe for more updates!
If you like this idea drop a like, leave a comment.
Smartmoney
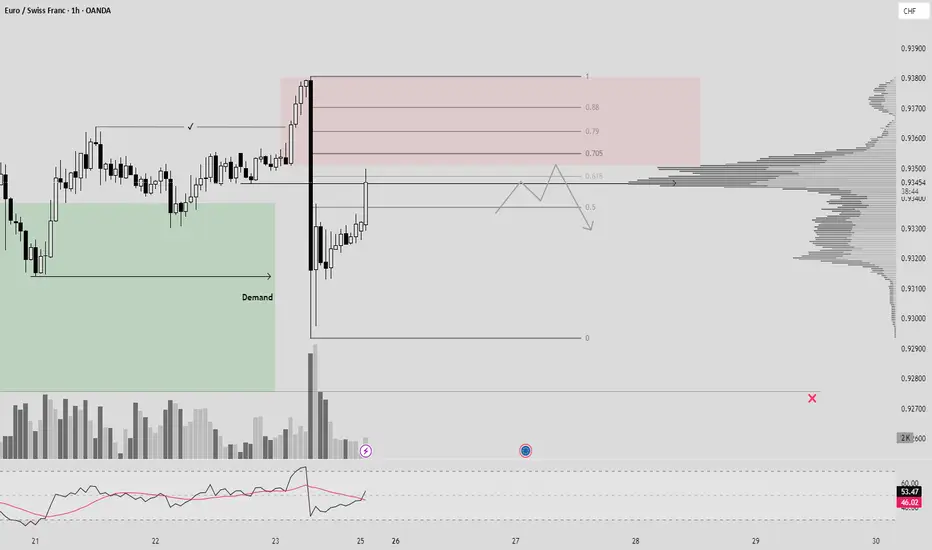
EURCHF SHORT (OB 4H + BB + OTE + Volume)Hello traders!
We have supply = OB 4H + OTE + BB
Target: ST Of Demand
Now we can expect reversal on LTF from 705 fib level + Mitigation Sell to Buy Action.
Have a profitable day and don't forget to subscribe for more updates!
If you like this idea drop a like, leave a comment.
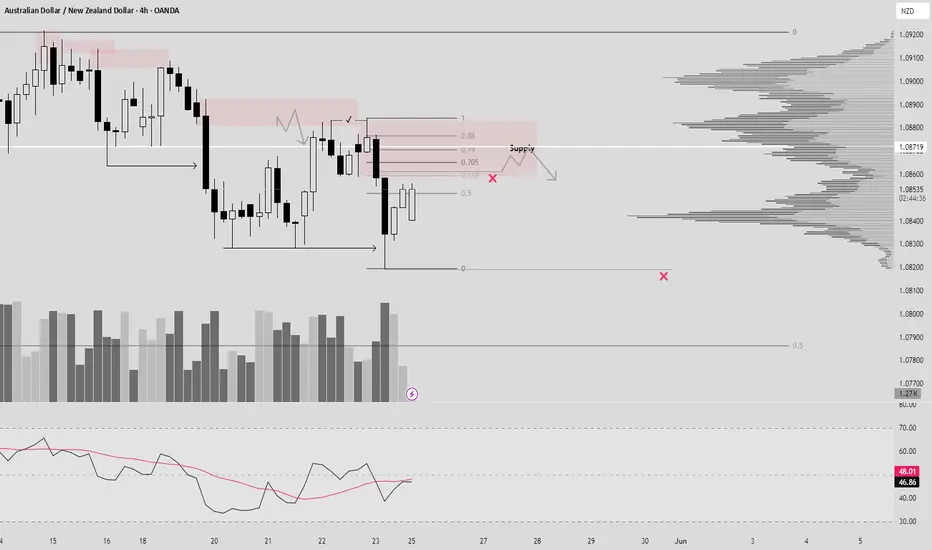
AUDNZD (SUPPLY+BOS+OTE)Hello traders!
We have supply + OTE.
Now we can expect reversal on LTF from 705 fib level + 0.5 Supply zone.
Have a profitable day and don't forget to subscribe for more updates!
If you like this idea drop a like, leave a comment.
NAS100 (BOS 1H + SUPPLY + OTE)Hello traders!
Now reaction from 705 fib level, Supply = OB 4H. But we can expect mitigation supply and confirmation on LTF. We have BOS on 1H.
Target: till 0.5 global fib level.
P.S: We have also on top OB 2H + OTE
Have a profitable day and don't forget to subscribe for more updates!
If you like this idea drop a like, leave a comment.

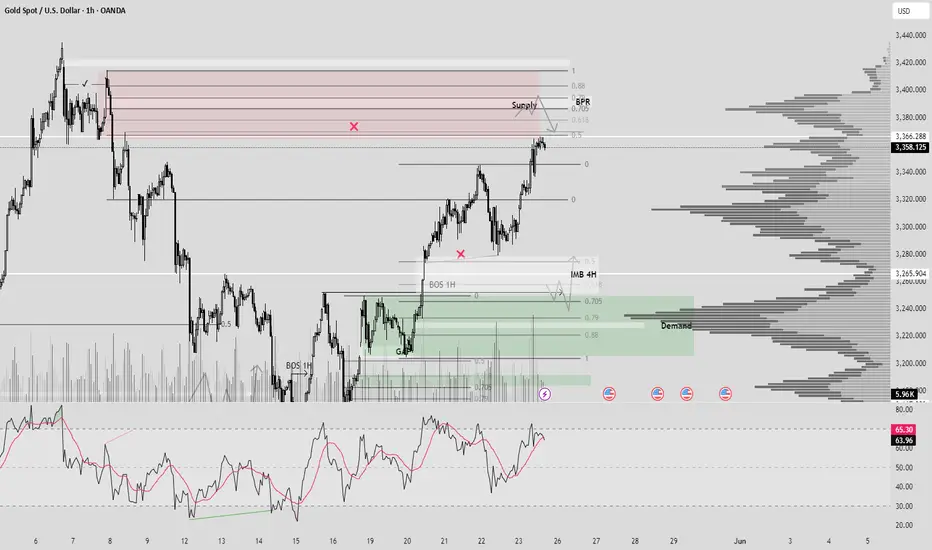
XAUUSD (BPR + SUPPLY + VOLUME + OTE)Hello traders!
1) Price come back to our demand zone, and for me 0.5 Supply still strong zone for selling +BPR 1H + Volume + OTE. RSI in oversold.
2) Also we have open BOS 1H + Demand 0.5 + Volume + Close IMB + OTE.
Have a profitable day and don't forget to subscribe for updates!
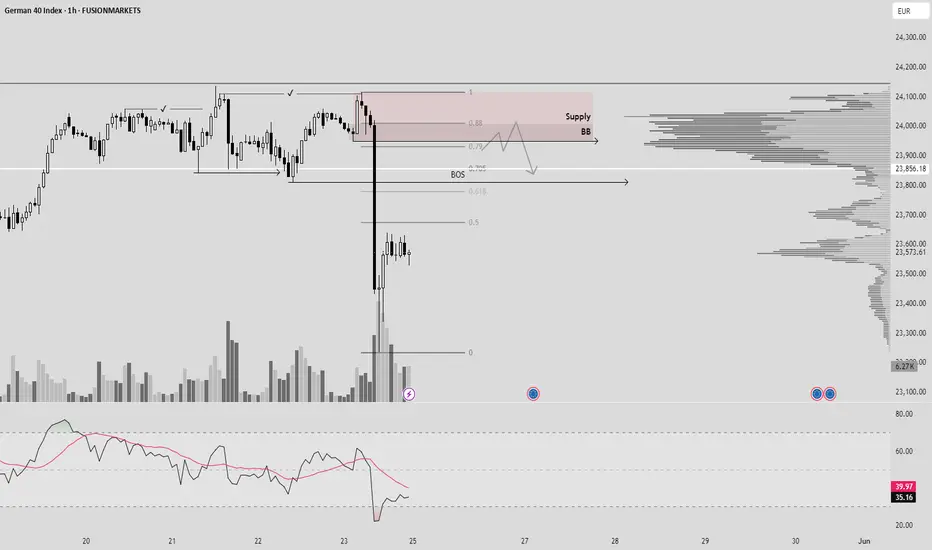
GER40 (BOS + OTE + Supply)Hello Traders!
Now we see big volume, BOS + Supply + OTE.
Target till 0.5 global fib level.
Have a profitable day and don't forget to subscribe for updates!
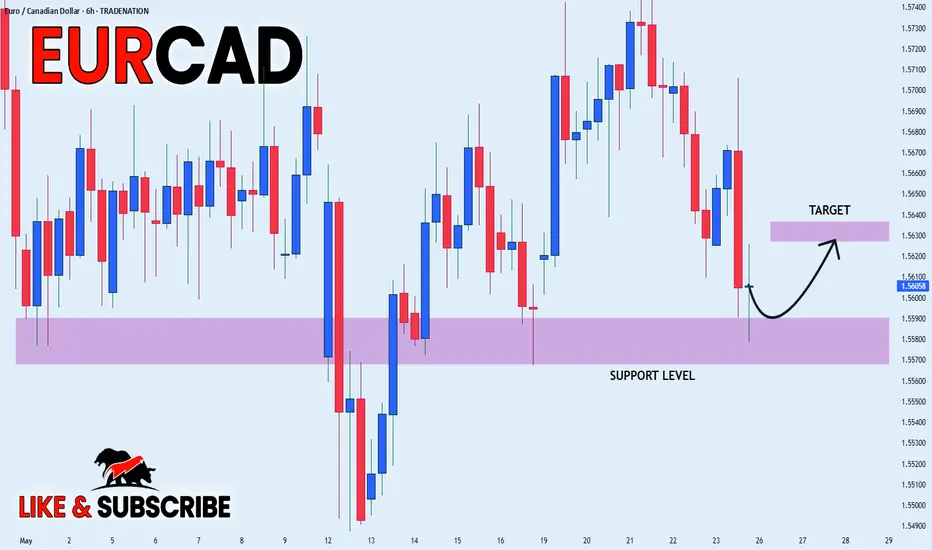
EUR_CAD RISKY LONG|
✅EUR_CAD is going down to retest
A horizontal support of 1.5570
Which makes me locally bullish biased
And I think that we will see a rebound
And a move up from the level
Towards the target above at 1.5630
LONG🚀
✅Like and subscribe to never miss a new idea!✅
Disclosure: I am part of Trade Nation's Influencer program and receive a monthly fee for using their TradingView charts in my analysis.
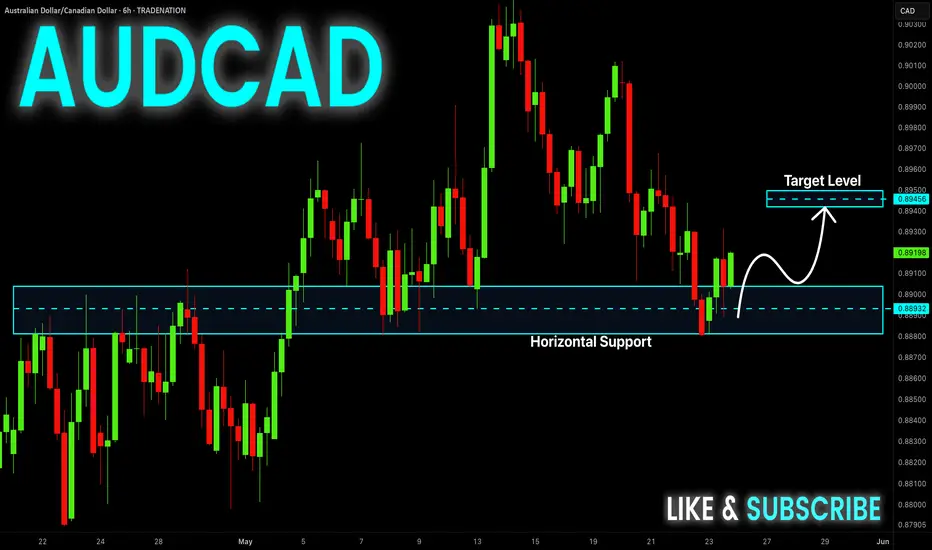
AUD-CAD Will Go UP! Buy!
Hello,Traders!
AUD-CAD made a retest
Of the horizontal support
Level of 0.8880 and we
Are already seeing a
Bullish rebound so we are
Locally bullish biased and
We will be expecting a
Further bullish move up
Buy!
Comment and subscribe to help us grow!
Check out other forecasts below too!
Disclosure: I am part of Trade Nation's Influencer program and receive a monthly fee for using their TradingView charts in my analysis.
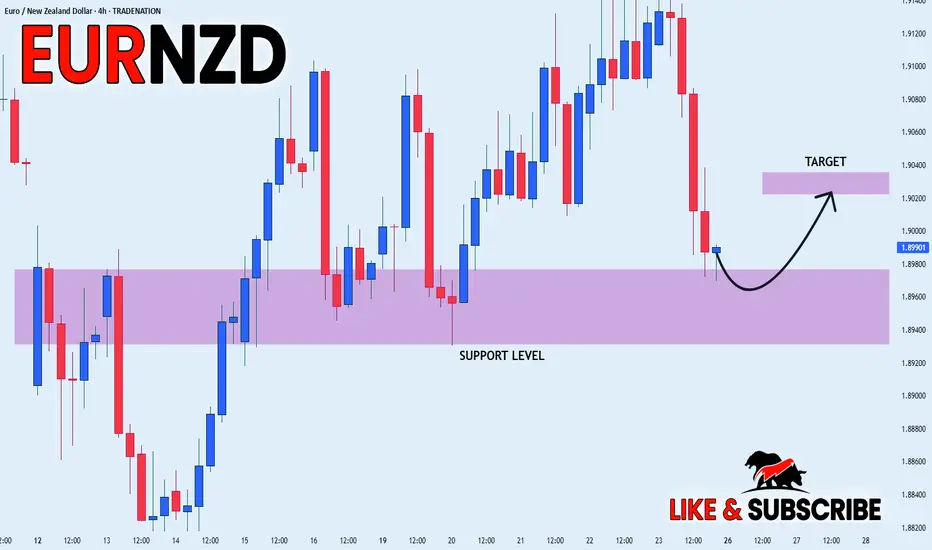
EUR_NZD LOCAL LONG|
✅EUR_NZD is going down now
But a strong support level is ahead at 1.8940
Thus I am expecting a rebound
And a move up towards the target of 1.9022
LONG🚀
✅Like and subscribe to never miss a new idea!✅
Disclosure: I am part of Trade Nation's Influencer program and receive a monthly fee for using their TradingView charts in my analysis.
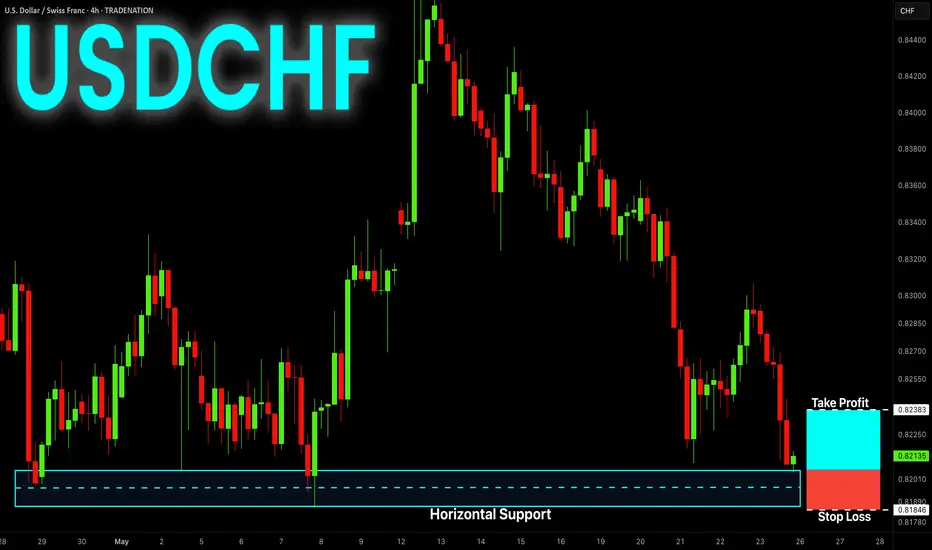
USD-CHF Free Signal! Buy!
Hello,Traders!
USD-CHF is once again
Retesting a horizontal support
Level around 0.8189 and the
Pair seems to have formed
A H&S pattern, so we are bearish
Biased, however, a local bullish
Rebound from the support
Is possible so while risky
A long trade still makes sense
With the Take Profit of 0.8238
And the Stop Loss of 0.8184
Buy!
Comment and subscribe to help us grow!
Check out other forecasts below too!
Disclosure: I am part of Trade Nation's Influencer program and receive a monthly fee for using their TradingView charts in my analysis.
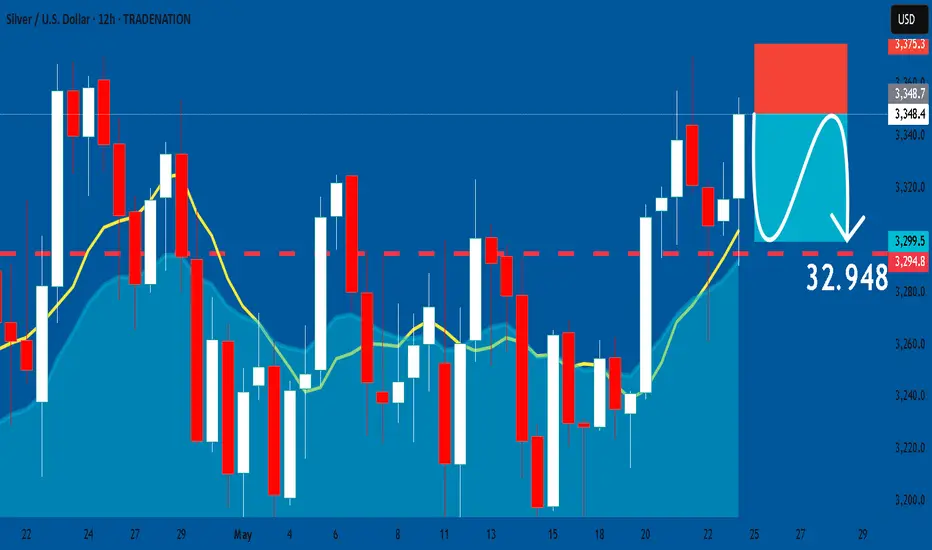
SILVER: Short Signal Explained
SILVER
- Classic bearish setup
- Our team expects bearish continuation
SUGGESTED TRADE:
Swing Trade
Short SILVER
Entry Point - 33.484
Stop Loss - 33.753
Take Profit - 32.948
Our Risk - 1%
Start protection of your profits from lower levels
Disclosure: I am part of Trade Nation's Influencer program and receive a monthly fee for using their TradingView charts in my analysis.
❤️ Please, support our work with like & comment! ❤️
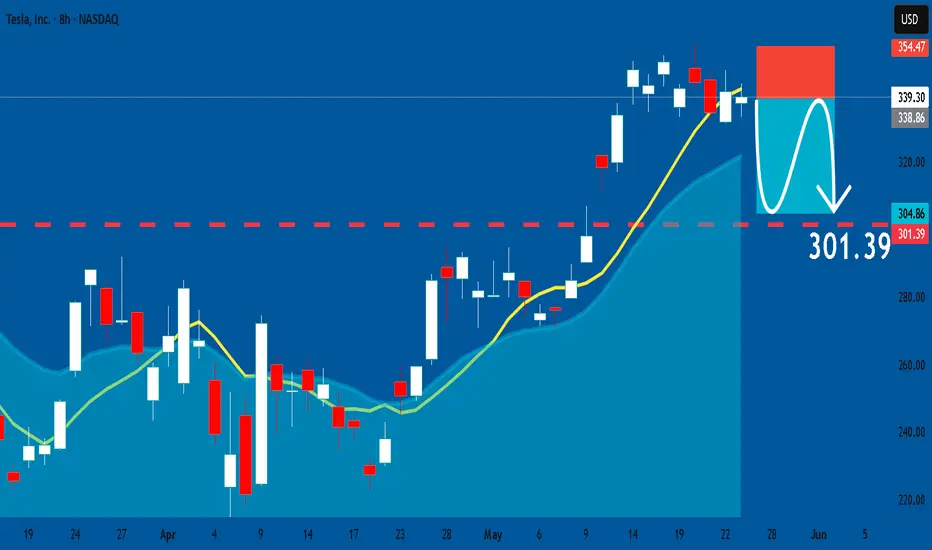
TESLA: Short Trade with Entry/SL/TP
TESLA
- Classic bearish formation
- Our team expects fall
SUGGESTED TRADE:
Swing Trade
Sell TESLA
Entry Level - 339.30
Sl -354.47
Tp - 301.39
Our Risk - 1%
Start protection of your profits from lower levels
Disclosure: I am part of Trade Nation's Influencer program and receive a monthly fee for using their TradingView charts in my analysis.
❤️ Please, support our work with like & comment! ❤️
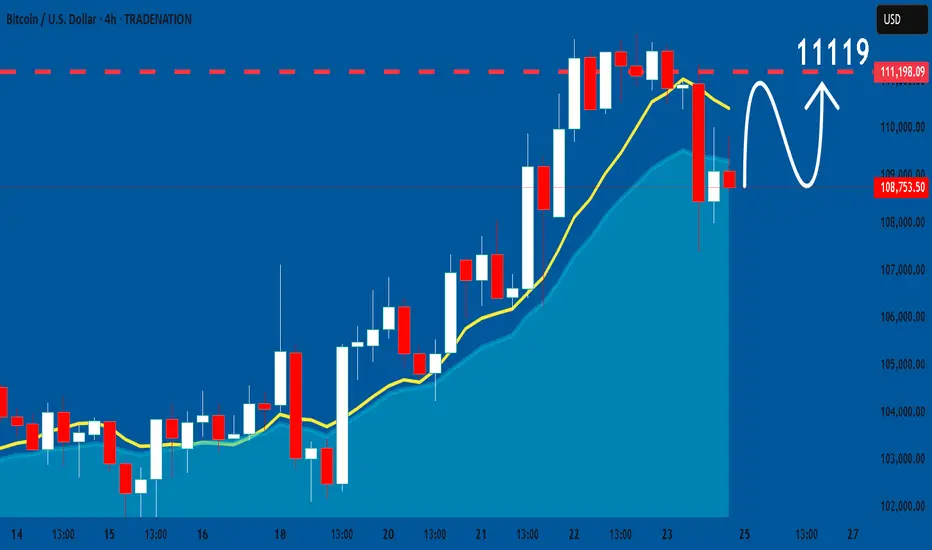
BTCUSD: Growth & Bullish Continuation
Remember that we can not, and should not impose our will on the market but rather listen to its whims and make profit by following it. And thus shall be done today on the BTCUSDpair which is likely to be pushed up by the bulls so we will buy!
Disclosure: I am part of Trade Nation's Influencer program and receive a monthly fee for using their TradingView charts in my analysis.
❤️ Please, support our work with like & comment! ❤️
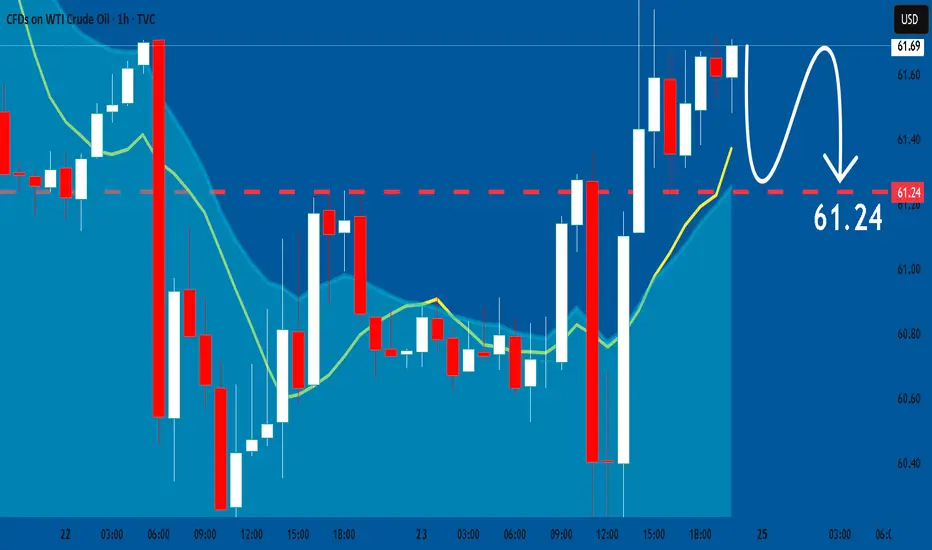
USOIL: Market of Sellers
Our strategy, polished by years of trial and error has helped us identify what seems to be a great trading opportunity and we are here to share it with you as the time is ripe for us to sell USOIL.
Disclosure: I am part of Trade Nation's Influencer program and receive a monthly fee for using their TradingView charts in my analysis.
❤️ Please, support our work with like & comment! ❤️
Gold 4H VIP Move – MMC Curve Break or Bounce?📈 Market: XAUUSD – 4H Timeframe
This setup is based on Mirror Market Concepts (MMC), a method that reflects the idea of market symmetry, key structural levels, and curve dynamics (institutional behavior). We’re looking at how price interacts with historically significant zones, demand transfers, and resistance curves.
🔍 Full Chart Analysis Breakdown:
1. ⚙️ Mirror Market Concepts (MMC)
MMC focuses on how past price actions "mirror" into the future. If a zone caused a strong move before, it can likely do it again — either by rejecting price or acting as a magnet for liquidity. You can see how historical supply and demand zones still influence price today.
2. 🧱 Major Resistance Zone (Top Blue Zone: ~$3,470 – $3,520)
This is a historical supply area where sellers were previously dominant.
Every time price enters this zone, it reacts with strong selling pressure.
Watch closely: a clean breakout + retest above this zone could open the door to higher time frame bullish continuation.
3. 🚧 Black Mind Curve Resistance (Orange Arc)
A dynamic resistance level based on institutional selling behavior over time.
This curve aligns with historical highs and retracements, suggesting smart money is actively defending this region.
Price is now testing this curve — either it gets rejected and drops, or breaks above for a breakout boom.
4. 🟦 Mini Reversal Zone (Around $3,400)
This zone sits right under the curve and major resistance, making it a critical decision point.
A strong reaction here could mean a short-term selloff, but if broken, this zone could flip into support, validating the breakout.
5. 📉 Trending Support Line (Upward Diagonal)
Acting as short-term bullish support.
As price pulls back, this trendline could catch the dip, causing a bounce toward the reversal or major resistance zone.
You can also call this the "retest and boom" line, as seen in your chart’s annotation.
6. 🧊 Demand Transferred (Mid-Zone Shift)
Shows where institutional demand entered and was then shifted upward to support the rally.
This is a powerful MMC concept — demand didn’t disappear, it just migrated up, forming new support levels.
7. 🔄 SR Interchange Zone (~$3,160 – $3,200)
Classic support/resistance flip zone.
If the trendline and mid-zone fail, price might drop here to collect liquidity and trigger new buy orders.
This is your “last stand” zone for bulls.
8. 🧱 Break of Structure (BOS) Confirmation
BOS already occurred earlier on the chart — this confirms bullish shift in structure.
Now, price is looking to retest the previous high or break it entirely.
🎯 Trade Scenarios
✅ Bullish Setup (Base Case):
Price continues to hold above the trending support.
Breaks mini reversal zone + Black Curve Resistance.
Retests the zone (validation).
Pushes toward the Major Resistance Zone ($3,470 – $3,520).
⚠️ Bearish Setup (If Rejected):
Price hits the curve and mini reversal zone and gets rejected hard.
Drops back to trending support, possibly breaks it.
Targets SR Interchange Zone (~$3,160 – $3,200) as the next buy zone.
💬 Mind / Trading Wisdom:
“Price doesn’t lie. It reacts. Let it show you the intention — breakout or rejection. Follow MMC structure, respect the curve resistance, and let price action guide your entries.”
📌 Summary for Traders:
Concepts Used: Mirror Market Concepts (MMC), Curve Resistance, SR Flip, Demand Transfer, BOS.
Current Price Action: Testing reversal zone + curve.
Bias: Bullish but cautiously watching for rejection.
Next Levels: Watch $3,400 – $3,520 for decision. Retest = entry. Rejection = liquidity hunt.

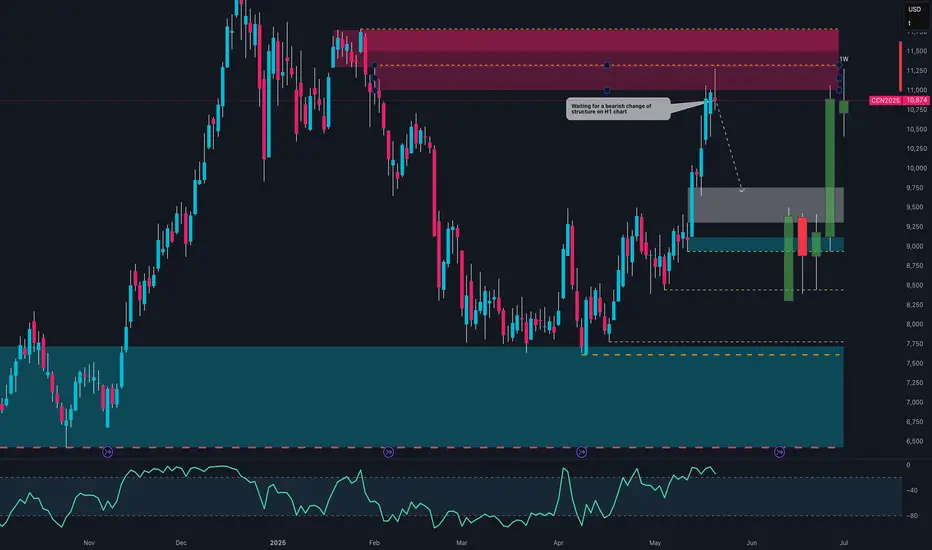
Cocoa Explosion Loading? Specs & Hedgers Agree🔍 Fundamental Analysis – Commitment of Traders (COT)
The latest COT report, dated May 13, 2025, reveals a strong bullish accumulation signal, with a significant increase in long positions across all major trader categories.
Specifically, Non-Commercials (speculative traders such as hedge funds and money managers) increased their long positions by +3,490 contracts while simultaneously reducing shorts by -467 contracts. This dynamic reflects renewed speculative confidence in the cocoa bullish trend.
Simultaneously, Commercials (typically producers and processors) added +5,187 long contracts and closed -661 short contracts. This is especially noteworthy, as commercials usually take the opposite side of speculators. Here, however, their alignment with speculators may indicate expectations of upcoming supply constraints or market stress.
Total open interest rose by more than +6,000 contracts, suggesting real capital inflow into the market rather than just rebalancing.
This alignment between speculators and institutional hedgers is rare and often precedes further price appreciation.
📈 Net Positions & Price Action
Looking at the “Net Positions & Prices” chart over the past year, it’s clear that Non-Commercial net positions are recovering after a notable drop in March and April. This reversal aligns with the technical bottom and the start of the current price rally.
Commercials, although still net short (in line with their historical bias), are reducing their bearish exposure, hinting at lower physical supply pressure or a need for hedging against further price increases.
Price action has reflected this narrative, surging higher following the April lows.
🕰️ Seasonal Analysis
Seasonality adds another layer to the analysis.
Historically, May tends to be flat or slightly bearish (10Y and 15Y averages), but the 2-Year seasonal line—which better reflects current market behavior—shows a strong bullish tendency starting mid-month. This supports the ongoing rebound and increases the likelihood of further upside in the short term.
Historical data also shows that June, while volatile, is often positive or neutral in shorter cycles.
📊 Technical Analysis
From a technical perspective, cocoa recently completed a strong bullish leg, rebounding from the 8,800–9,000 USD demand zone, identified as a clear area of institutional buying (evident through volume and impulsive candles).
The price then decisively broke through mid-range resistance levels and tested a key weekly supply zone between 11,200 and 11,500 USD, where it was initially rejected.
Currently, we are in a technical pullback, likely targeting the mitigation zone at 9,700–10,000 USD. This area represents a solid long entry opportunity if the market confirms a bullish structure on intraday charts (H1 or H4).
The RSI is near overbought, yet without divergence—suggesting the trend remains structurally bullish despite a natural correction.
🧭 Strategic Conclusion
Cocoa currently shows a rare convergence of bullish signals: supportive COT positioning, increasing net long interest, strong 2Y seasonality, and clear technical structure controlled by buyers.
However, after the recent sharp upside move, a correction to key support zones is likely before another bullish leg unfolds.
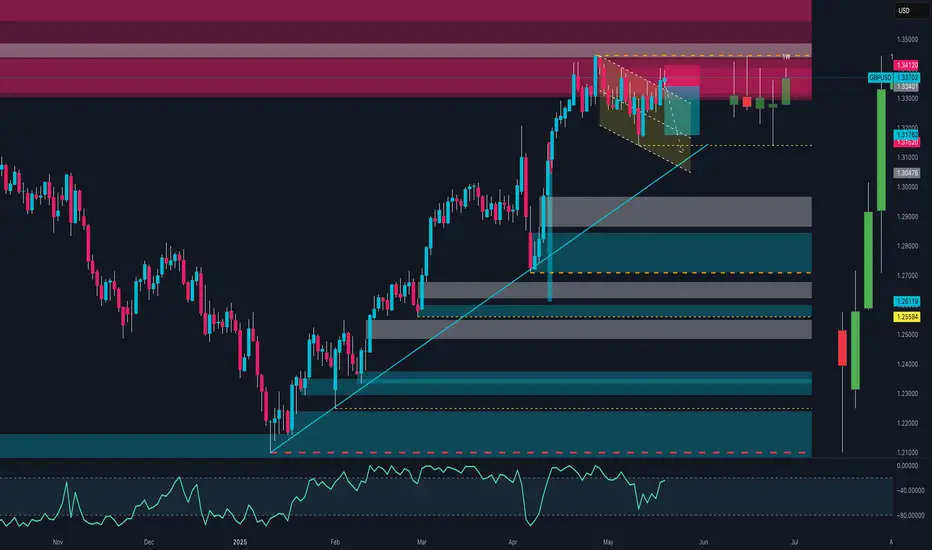
GBP/USD About to Explode?GBP/USD is currently trading around the 1.3360–1.3380 zone after testing the key weekly resistance area between 1.3400 and 1.3450. The bullish momentum remains strong, supported by speculative positioning still favoring the pound, while the dollar shows signs of softening. On the macro side, the interest rate differential between the UK and the US may narrow in the coming months, but for now, it continues to support upward pressure on the pair.
From a technical standpoint, price has broken out of an ascending triangle on the daily chart, showing strong momentum and confirmation with multiple closes above 1.3300. Market sentiment remains skewed to the short side, adding contrarian fuel to the bullish bias. The key short-term support lies between 1.3270 and 1.3300. As long as this area holds, the base case favors a continuation toward 1.3520 and potentially 1.3600. A break below 1.3170 would invalidate the current bullish structure and open the door for a deeper pullback toward 1.3000.
From an execution standpoint, a confirmed breakout above 1.3415 could offer a long entry opportunity with active management. Still, caution is advised around the weekly supply zone due to its historical responsiveness. Eyes remain on upcoming macro data and potential volatility from central bank statements.
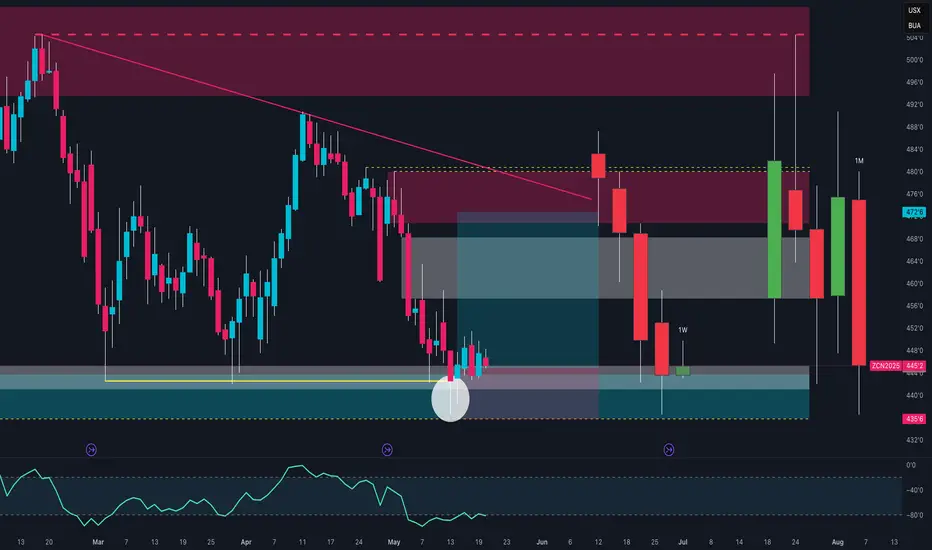
Corn at a Historical Turning Point? Corn futures are currently at a technically significant juncture. After an extended bearish phase from the yearly highs, price has reached a key monthly demand zone between 445 and 435 cents, an area that has historically triggered major reversals. This level is further validated by technical signals indicating potential exhaustion of the bearish momentum: the price action is showing rejection candles, and the RSI is recovering from oversold territory, creating room for a possible upside move.
However, it’s important to consider the seasonal context, which doesn’t favor an immediate reversal. Historical data shows that May, June, and July are statistically the weakest months for Corn. In particular, July tends to be highly bearish, with an average performance of -22% over the last 20 years and -36% over the last 10. This means that while the technical setup may suggest a potential bounce, seasonal pressure may continue to cap prices in the short term, making a sustained rally unlikely before August.
The COT positioning adds another layer of insight. Non-commercial traders (speculators) have recently closed a significant number of long positions and added shorts, reflecting strong bearish sentiment. In contrast, commercials (hedgers) have increased long exposure and decreased shorts, signaling optimism and a willingness to accumulate at these levels. This divergence often marks contrarian opportunities, especially when speculators are heavily short and commercials are heavily long—often a sign of a market bottom forming.
🧠 Summary:
Corn is sitting on major structural support, with early signs of a potential rebound. Yet, the seasonality remains bearish through mid-summer. The COT report, however, supports a bullish medium-term outlook, particularly heading into August–September, when prices historically begin to climb decisively.
🔔 Trading Outlook:
In the short term, tactical longs can be considered if the 445–435 area holds, with tight risk management. Initial targets are set at 465 and 472. The true strategic setup, however, is more likely to emerge in the coming months, with August as the key window for a sustained upside move supported by both seasonal and COT positioning.
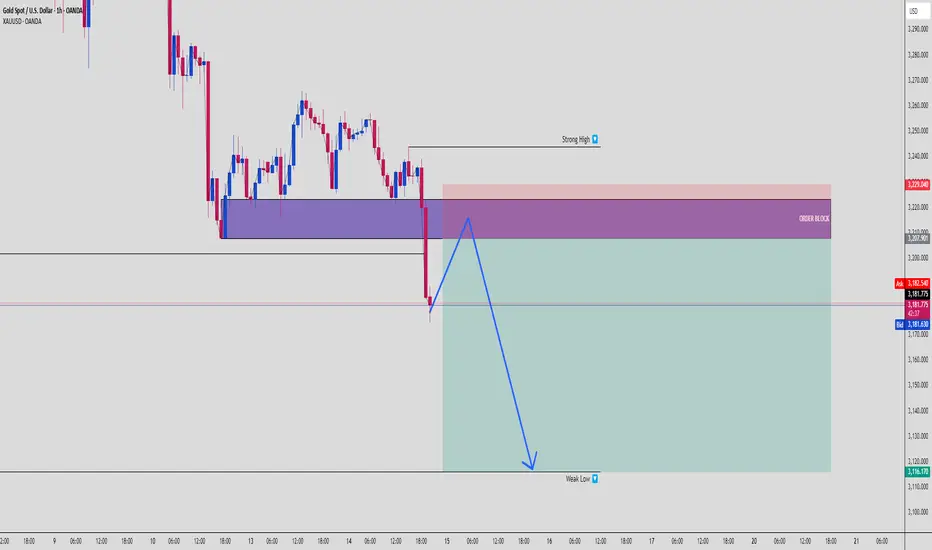
XAUUSD 1H | Bearish Order Block Reaction + Liquidity Sweep🔻 XAUUSD 1-Hour Breakdown — May 14, 2025
Gold gave a strong supply rejection at a marked Order Block zone. This isn’t just a pullback — it’s a potential continuation setup targeting lower lows. Here’s what’s cooking:
🧩 1. Market Structure
Clean rejection from premium OB zone at ~$3,220
Massive bearish impulse candle right after sweeping demand zone liquidity
Price formed a lower low and is now forming a lower high
🛠 2. Key Confluences
🟪 Order Block: Solid rejection with no candle closes above
💧 Liquidity Sweep: Deep wick into OB zone → trapped breakout buyers
🔺 Strong High Protected: Market respects structure, suggesting continuation
🔻 Weak Low Targeted: Clean draw to imbalance & potential sweep zone near $3,116
🧠 3. Trade Setup
Entry: Rejection near $3,207–3,220 OB
SL: Above $3,229 (invalidates structure)
TP: First TP zone near $3,116, extended TP: $3,100
RRR: 1:4 to 1:6 setup depending on partials
⚠️ 4. Risk Management
Watch for NY session reversal attempts
Secure profits at first demand zone reaction
Consider trailing stop above last bearish engulfing candle
📌 Price respects structure. If bulls don’t step in quick, sellers will run the table. This is a classic SMC bearish continuation off OB + liquidity grab — don’t sleep on it!
💬 Type “🔻” if you're riding this short wave with us!
🎯 Follow @ChartNinjas88 for sniper SMC plays every day!
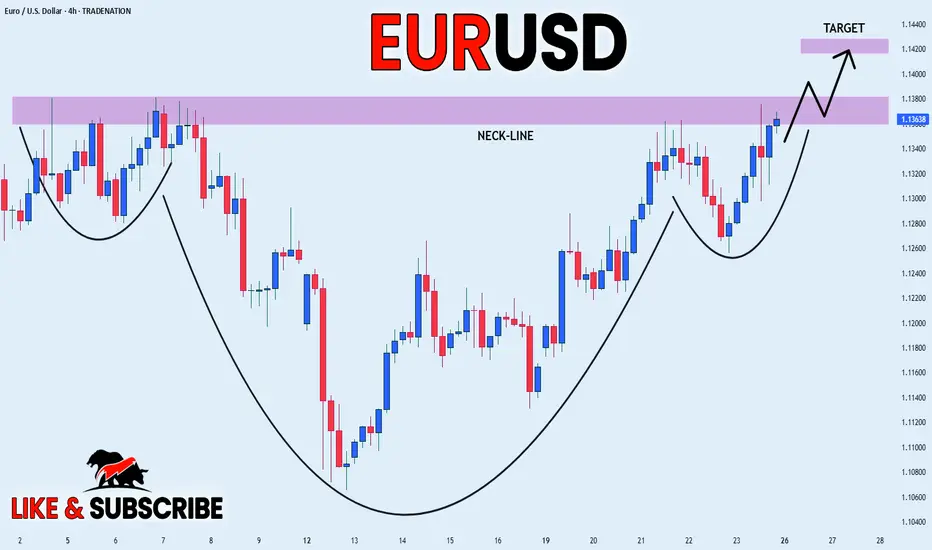
EUR_USD HEAD AND SHOULDERS|LONG|
✅EUR_USD has formed a
Head and Shoulders pattern
And the pair has now formed
The last leg of it, so we are
Bullish biased and IF we see
A bullish breakout of the
Neckline of 1.1380 next week
Then we will be expecting a
Further bullish move up
LONG🚀
✅Like and subscribe to never miss a new idea!✅
Disclosure: I am part of Trade Nation's Influencer program and receive a monthly fee for using their TradingView charts in my analysis.
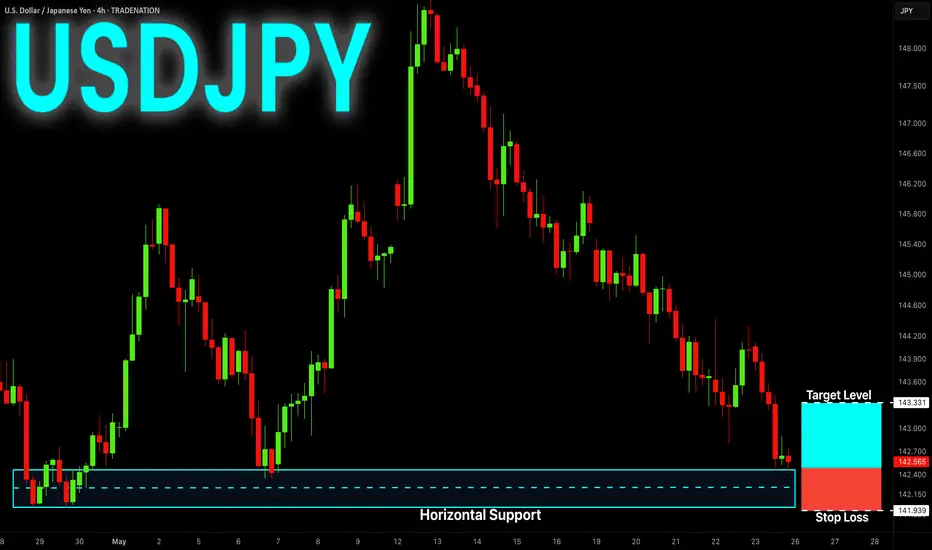
USD-JPY Free Signal For Monday! Buy!
Hello,Traders!
USD-JPY is about to retest
A horizontal support level
Around 142.000 and after
The retest on Monday we
Will be able to go long on
The pair with the Take
Profit of 143.331 and the
Stop Loss of 141.939
Buy!
Comment and subscribe to help us grow!
Check out other forecasts below too!
Disclosure: I am part of Trade Nation's Influencer program and receive a monthly fee for using their TradingView charts in my analysis.
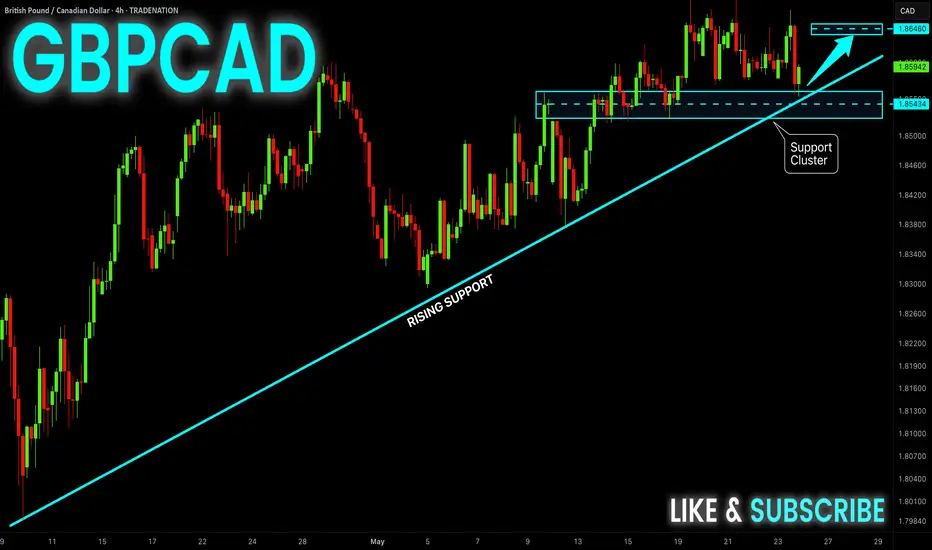
GBP-CAD Support Cluster! Buy!
Hello,Traders!
GBP-CAD is trading in a
Local uptrend along the
Rising support and the pair
Made a retest of the support
Cluster of the rising and
Horizontal support lines
Around 1.8546 from where
We are already seeing a
Bullish rebound so we
Will be expecting a
Further local bullish move
Up on Monday
Buy!
Comment and subscribe to help us grow!
Check out other forecasts below too!
Disclosure: I am part of Trade Nation's Influencer program and receive a monthly fee for using their TradingView charts in my analysis.
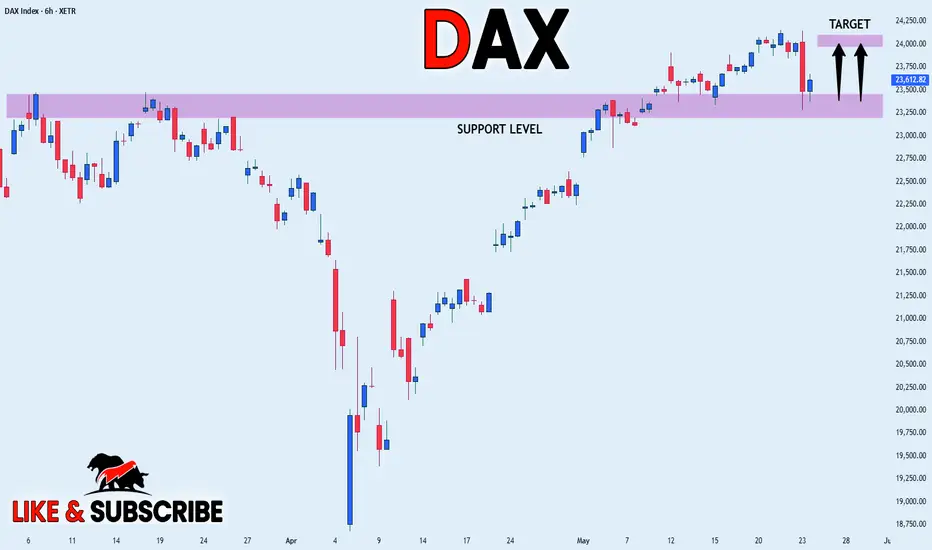
DAX WILL KEEP GROWING|LONG|
✅DAX made a retest of
The horizontal support level
Of 23,371 and the index is already
Making a bullish rebound so we
Are bullish biased and we will
Be expecting further growth on Monday
LONG🚀
✅Like and subscribe to never miss a new idea!✅
Disclosure: I am part of Trade Nation's Influencer program and receive a monthly fee for using their TradingView charts in my analysis.