DOGE/USDTAfter liquidity is removed in the marked zone, a coin purchase can be considered.
Growth targets:
Target 1 = 0.169
Target 2 = 0.180
Target 3 = 0.205
Smartmoney

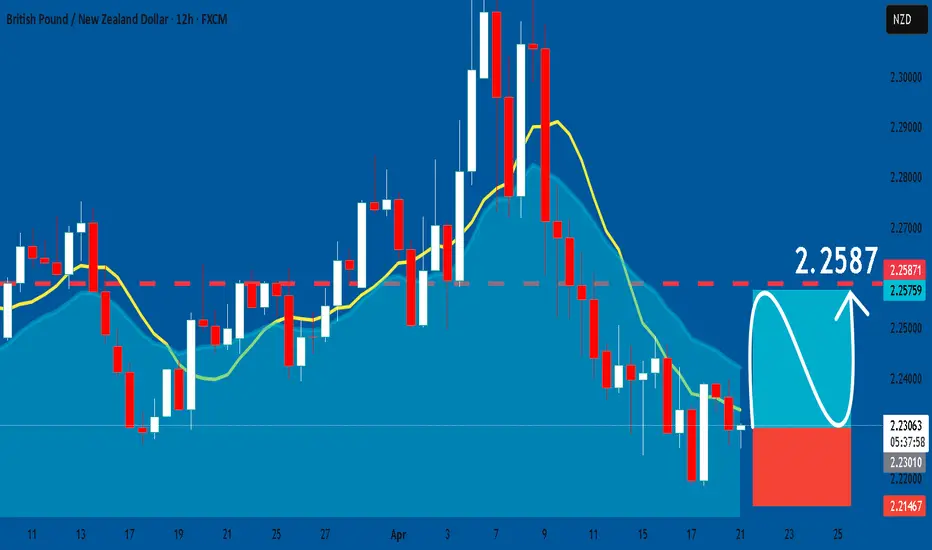
GBPNZD: Long Signal Explained
GBPNZD
- Classic bullish setup
- Our team expects bullish continuation
SUGGESTED TRADE:
Swing Trade
Long GBPNZD
Entry Point - 2.2295
Stop Loss - 2.2146
Take Profit - 2.2587
Our Risk - 1%
Start protection of your profits from lower levels
Disclosure: I am part of Trade Nation's Influencer program and receive a monthly fee for using their TradingView charts in my analysis.
❤️ Please, support our work with like & comment! ❤️
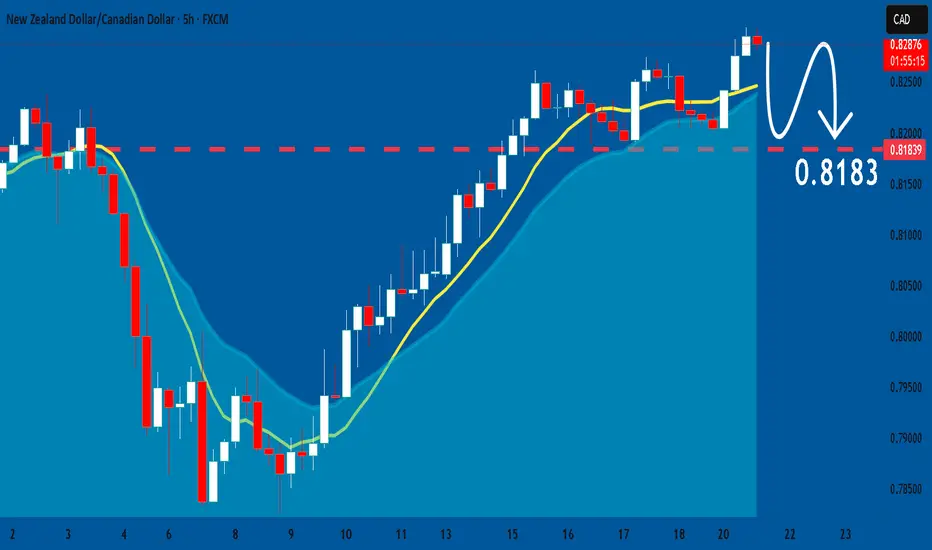
NZDCAD: Bearish Continuation is Highly Probable! Here is Why:
The price of NZDCAD will most likely collapse soon enough, due to the supply beginning to exceed demand which we can see by looking at the chart of the pair.
❤️ Please, support our work with like & comment! ❤️
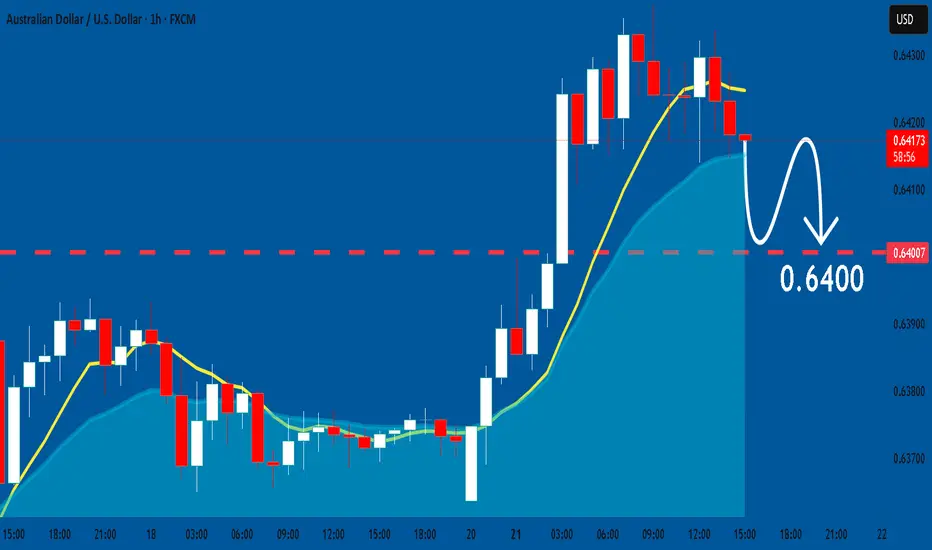
AUDUSD: Bears Will Push
Our strategy, polished by years of trial and error has helped us identify what seems to be a great trading opportunity and we are here to share it with you as the time is ripe for us to sell AUDUSD.
❤️ Please, support our work with like & comment! ❤️
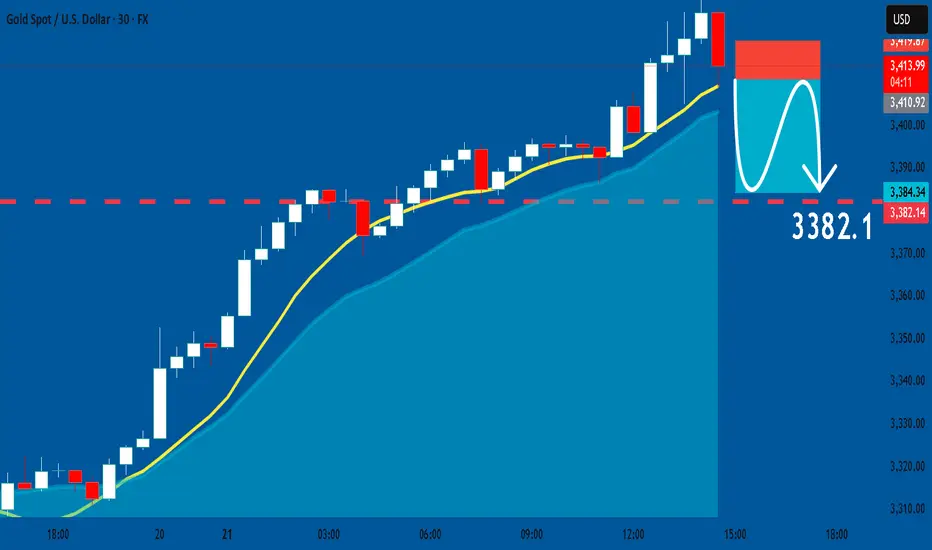
GOLD: Short Trade Explained
GOLD
- Classic bearish formation
- Our team expects fall
SUGGESTED TRADE:
Swing Trade
Sell GOLD
Entry Level - 3411.3
Sl - 3419.8
Tp - 3382.1
Our Risk - 1%
Start protection of your profits from lower levels
❤️ Please, support our work with like & comment! ❤️
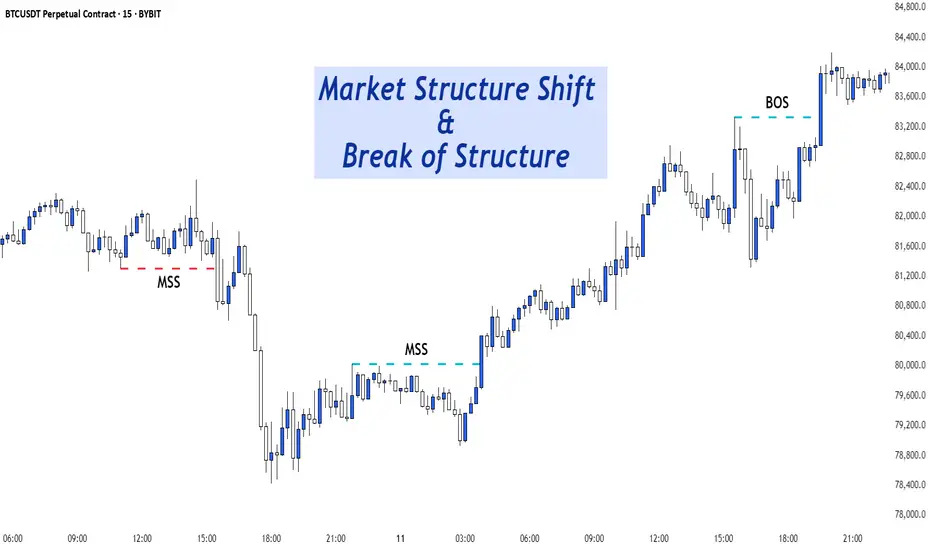
Market Structure Shift (MSS) & Break of Structure (BOS) - GuideIntroduction
Understanding market structure is fundamental to becoming a consistently profitable trader. Two key concepts that Smart Money traders rely on are the Break of Structure (BOS) and the Market Structure Shift (MSS) . While they may seem similar at first glance, they serve different purposes and signal different market intentions.
In this guide, we will break down:
- The difference between BOS and MSS
- When and why they occur
- How to identify them on your charts
- How to trade based on these structures
- Real chart examples for visual clarity
---
Break of Structure (BOS)
A Break of Structure is a continuation signal. It confirms that the current trend remains intact. BOS typically occurs when price breaks a recent swing high or low in the direction of the existing trend .
Key Characteristics:
- Happens with the trend
- Confirms continuation
- Can be used to trail stops or add to positions
Example:
In an uptrend:
- Higher High (HH) and Higher Low (HL) form
- Price breaks above the last HH → BOS to the upside
---
Market Structure Shift (MSS)
Market Structure Shift signals a potential reversal . It occurs when price breaks a significant swing level against the prevailing trend and is often followed by a shift in the internal structure (e.g., lower highs after higher highs).
Key Characteristics:
- Happens against the trend]
- Signals possible trend reversal
- Often occurs after a liquidity grab or stop hunt
- Optional: is created by a displacement candle
Example:
In an uptrend:
- Price takes out a significant high (liquidity grab)
- Then aggressively breaks the most recent HL → MSS to the downside
---
How to Identify BOS and MSS
For BOS:
1. Determine the current trend.
2. Identify swing highs/lows.
3. Look for price breaking past these levels in the same direction as the trend .
For MSS:
1. Look for signs of exhaustion or liquidity grabs near swing highs/lows.
2. Watch for price to break against the trend structure .
3. Confirm with a shift in internal structure (e.g., lower highs start forming in an uptrend).
---
Using BOS and MSS in Your Trading Strategy
With BOS:
- Use it to confirm trend continuation
- Add to your position after a retracement into an OB or FVG
- Trail your stop-loss below the most recent HL or above LH
With MSS:
- Look for confluence (liquidity sweep + MSS = strong signal)
- Use it to spot early reversal entries
- Wait for a confirmation candle or structure shift on LTF (1m, 5m, 15m)
- If the displacement candle is too big you can wait for the retest
---
Common Mistakes to Avoid
- Confusing BOS with MSS
- Ignoring higher timeframe context
- Trading MSS too early without confirmation
- Chasing BOS without waiting for a proper retracement
Pro Tip: Use BOS/MSS with confluences like SMT Divergence, IFVGs, or key session times for higher probability setups.
---
Final Thoughts
Mastering BOS and MSS will give you an edge in understanding price delivery and anticipating market moves. BOS confirms strength in the current trend, while MSS warns of a possible reversal and new trend forming. Combine these with smart money tools, and you’ll be equipped to enter the market like a pro.
Happy Trading!
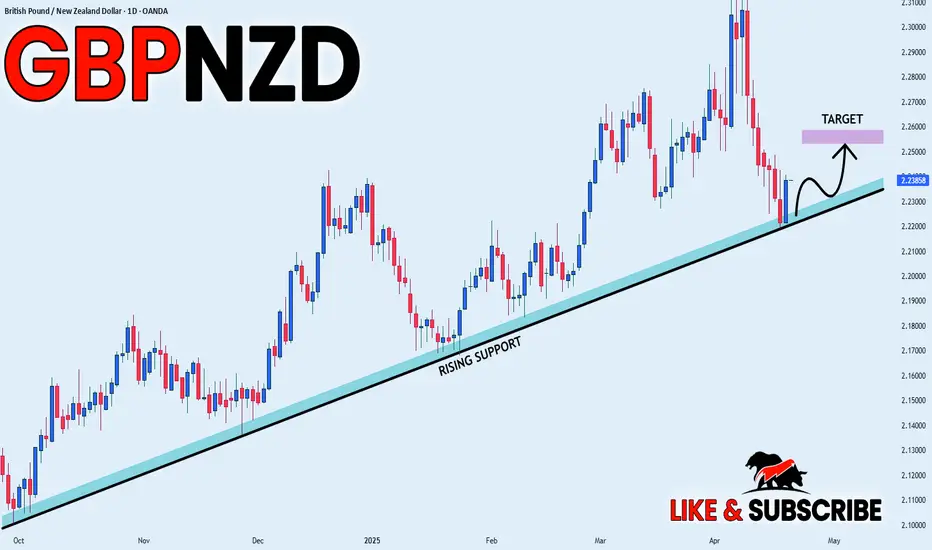
GBP_NZD LONG FROM RISING SUPPORT|
✅GBP_NZD is trading along the rising support line
And as the pair is going up now
After the retest of the line
I am expecting the price to keep growing
To retest the supply levels above around 2.2532
LONG🚀
✅Like and subscribe to never miss a new idea!✅
Disclosure: I am part of Trade Nation's Influencer program and receive a monthly fee for using their TradingView charts in my analysis.
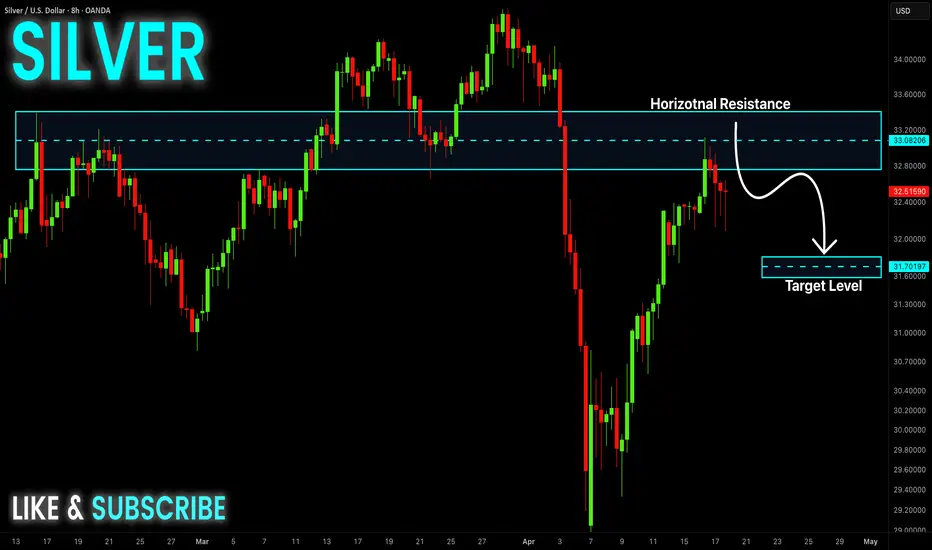
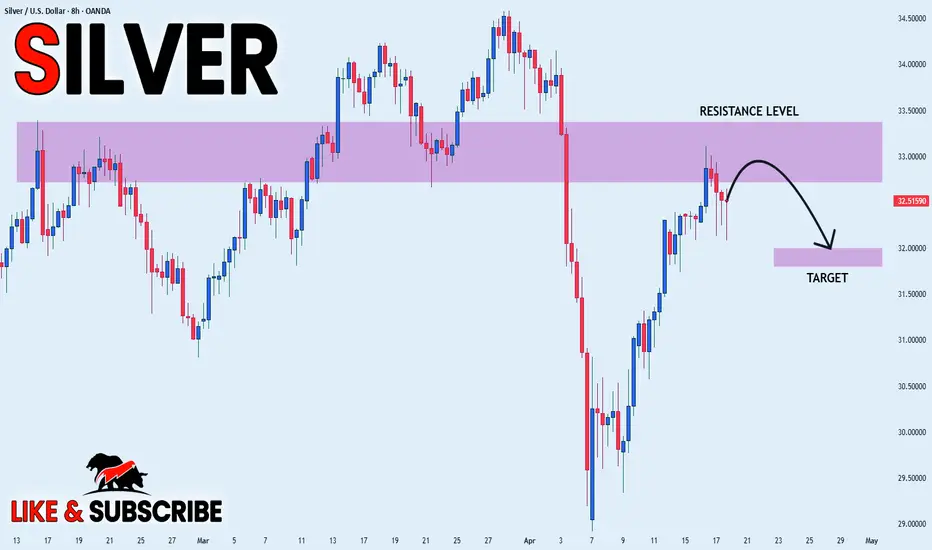
SILVER Bearish Bias! Sell!
Hello,Traders!
SILVER is already making
A local bearish pullback
From the horizontal resistance
Level of 33.20$ which is happening
After a strong bullish move up
Which temporarily took Silver into the
Overbought territory so we are locally
Bearish biased and we will be
Expecting a local bearish correction
Sell!
Comment and subscribe to help us grow!
Check out other forecasts below too!
Disclosure: I am part of Trade Nation's Influencer program and receive a monthly fee for using their TradingView charts in my analysis.
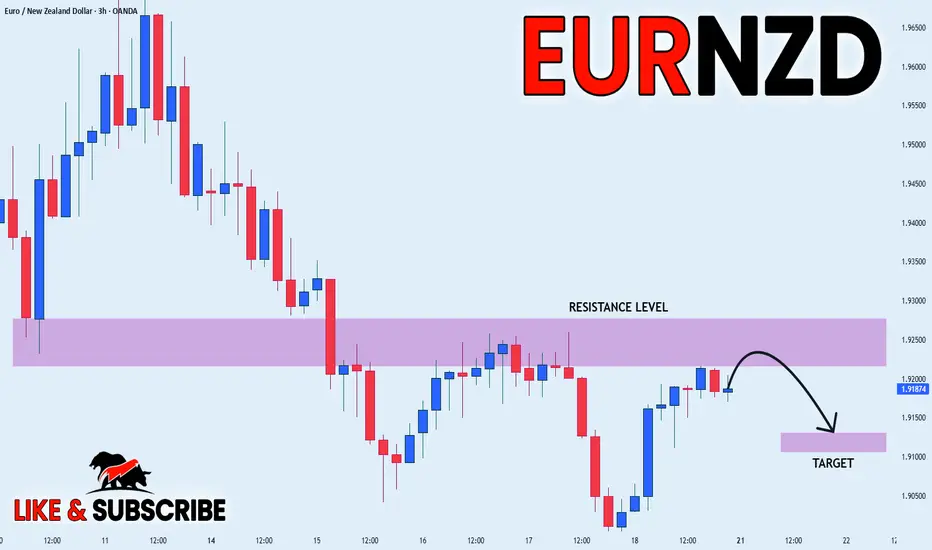
EUR_NZD LOCAL SHORT|
✅EUR_NZD will soon retest a local resistance level of 1.9268
So I think that the pair will make a pullback
And go down to retest the demand level below at 1.9130
SHORT🔥
✅Like and subscribe to never miss a new idea!✅
Disclosure: I am part of Trade Nation's Influencer program and receive a monthly fee for using their TradingView charts in my analysis.
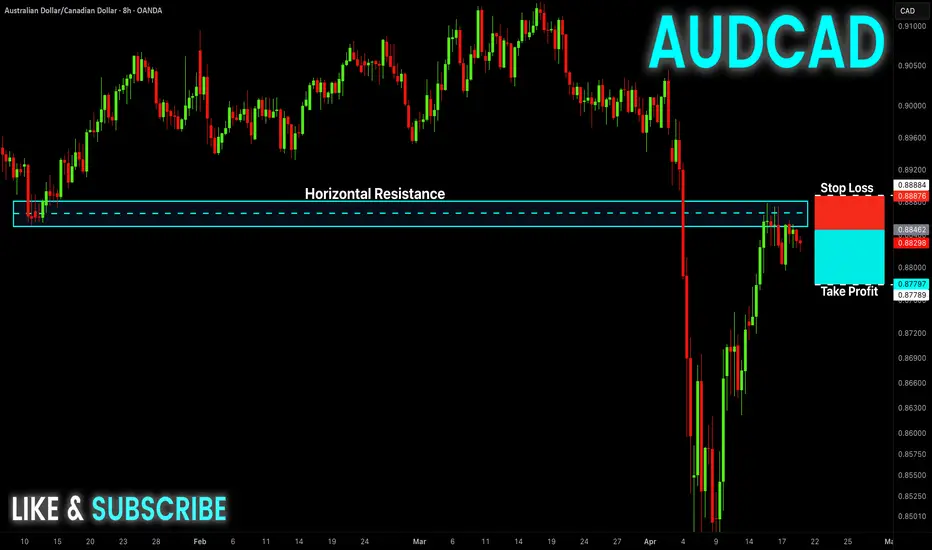
AUD-CAD Free Signal! Sell!
Hello,Traders!
AUD-CAD shot up sharply
But the pair failed to break
A horizontal resistance
Level of 0.8880 and we are
Already seeing a local pullback
Which is likely to turn into a
Local correction on Monday
So we can enter a short trade
With the Take Profit of 0.8779
And the Stop Loss of 0.8887
Sell!
Comment and subscribe to help us grow!
Check out other forecasts below too!
Disclosure: I am part of Trade Nation's Influencer program and receive a monthly fee for using their TradingView charts in my analysis.
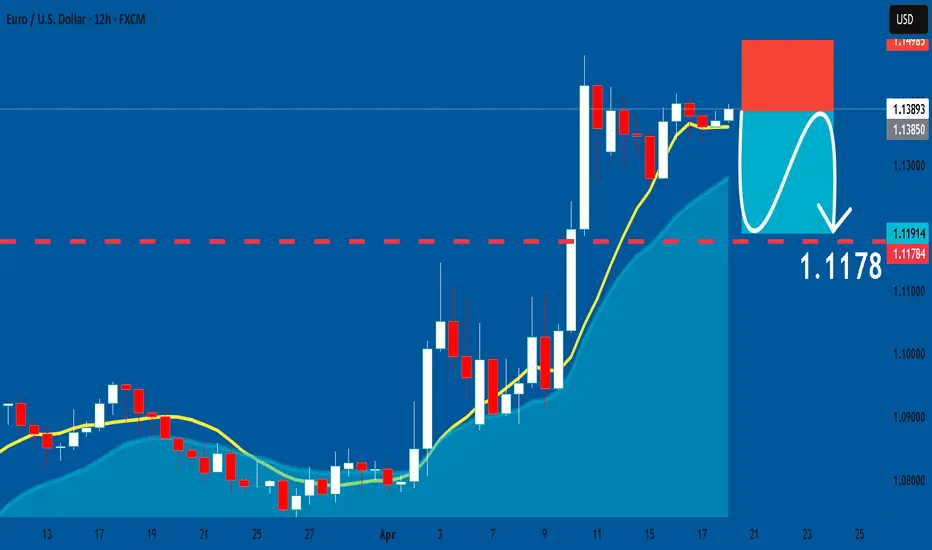
EURUSD: Great Trading Opportunity
EURUSD
- Classic bearish formation
- Our team expects pullback
SUGGESTED TRADE:
Swing Trade
Short EURUSD
Entry - 1.1389
Sl - 1.1498
Tp - 1.1178
Our Risk - 1%
Start protection of your profits from lower levels
❤️ Please, support our work with like & comment! ❤️
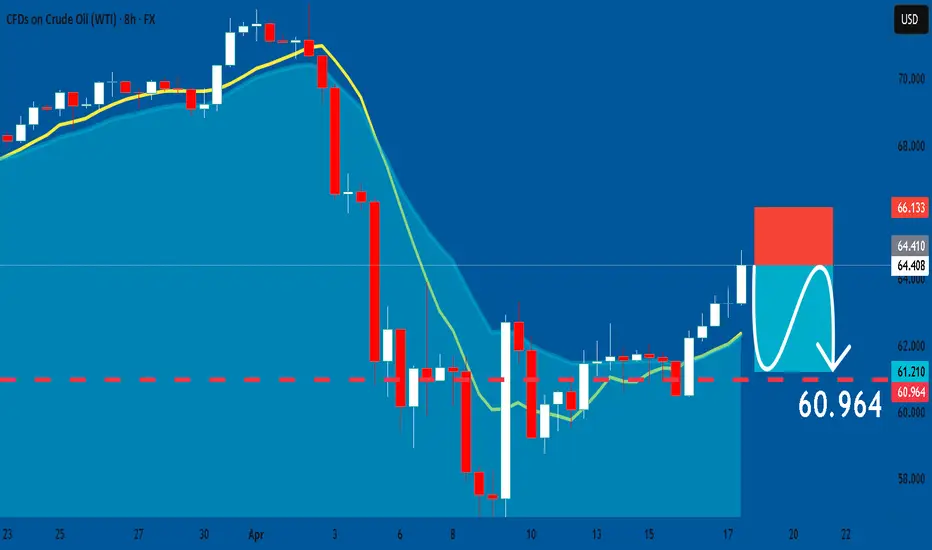
USOIL: Bearish Continuation & Short Trade
USOIL
- Classic bearish pattern
- Our team expects retracement
SUGGESTED TRADE:
Swing Trade
Sell USOIL
Entry - 64.408
Stop - 66.133
Take - 60.964
Our Risk - 1%
Start protection of your profits from lower levels
❤️ Please, support our work with like & comment! ❤️
GBPUSD: Bearish Continuation
The recent price action on the GBPUSD pair was keeping me on the fence, however, my bias is slowly but surely changing into the bearish one and I think we will see the price go down.
❤️ Please, support our work with like & comment! ❤️
TESLA: Expecting Bullish Continuation! Here is Why:
The analysis of the TESLA chart clearly shows us that the pair is finally about to go up due to the rising pressure from the buyers.
❤️ Please, support our work with like & comment! ❤️

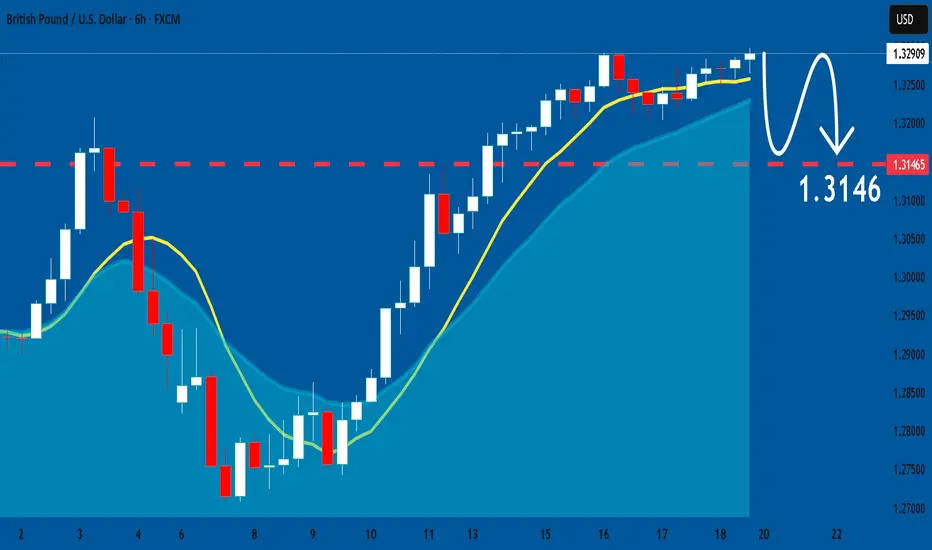
SILVER WILL FALL|SHORT|
✅SILVER has hit a horizontal
Resistance level around 33.13$
And we are already seeing a
Bearish reaction so we will be
Expecting a further move
Down on Monday
SHORT🔥
✅Like and subscribe to never miss a new idea!✅
Disclosure: I am part of Trade Nation's Influencer program and receive a monthly fee for using their TradingView charts in my analysis.
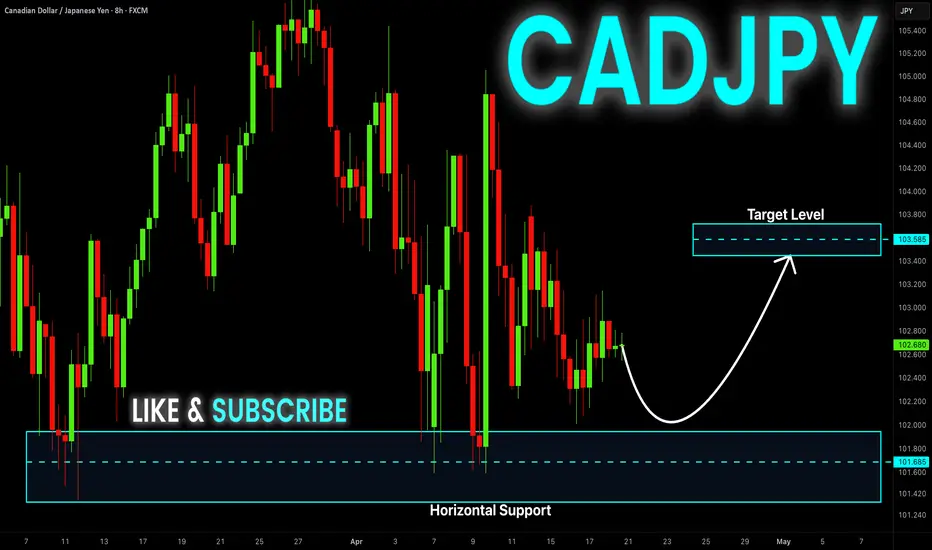
CAD-JPY Long From Support! Buy!
Hello,Traders!
CAD-JPY is about to hit
A horizontal support level
Around 101.420 so despite
The pair trading in a downtrend
We will be expecting a local
Bullish rebound after the
Retest of the support
Buy!
Comment and subscribe to help us grow!
Check out other forecasts below too!
Disclosure: I am part of Trade Nation's Influencer program and receive a monthly fee for using their TradingView charts in my analysis.
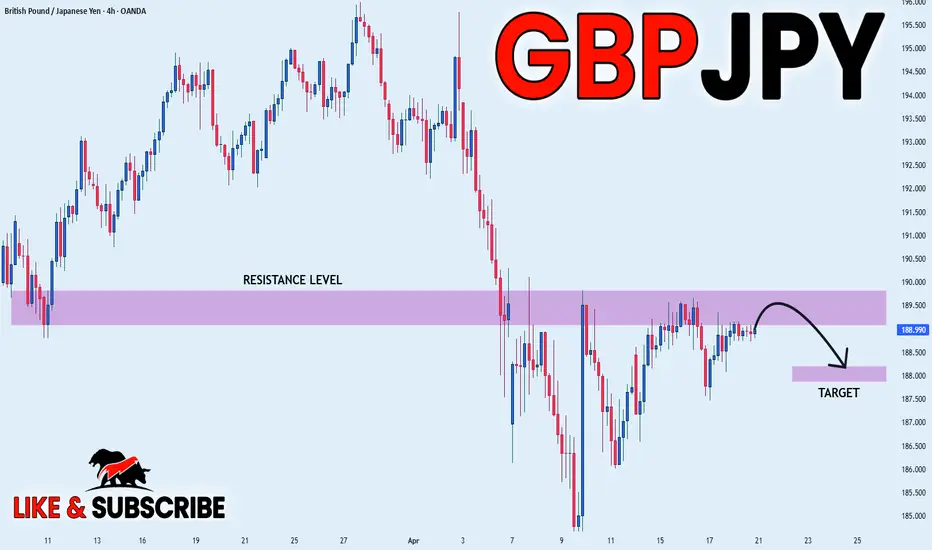
GBP_JPY SHORT FROM RESISTANCE|
✅GBP_JPY is going up now
But a strong resistance level is ahead at 189.669
Thus I am expecting a pullback
And a move down towards the target of 188.000
SHORT🔥
✅Like and subscribe to never miss a new idea!✅
Disclosure: I am part of Trade Nation's Influencer program and receive a monthly fee for using their TradingView charts in my analysis.
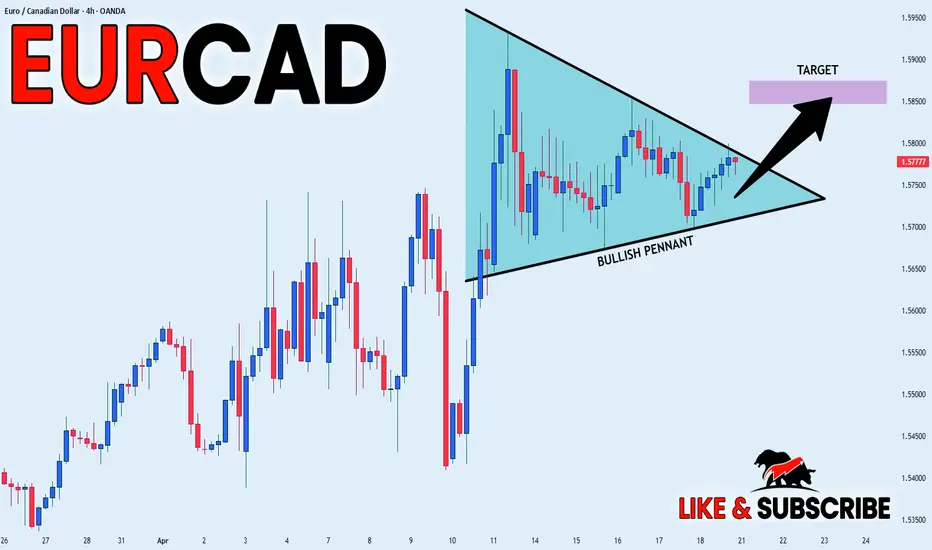
EUR_CAD BULLISH PENNANT|LONG|
✅EUR_CAD is trading in an
Uptrend and the pair has
Formed a bullish pennant
Pattern so IF we see a
Bullish breakout on Monday
We will be able to go long
On the pair
LONG🚀
✅Like and subscribe to never miss a new idea!✅
Disclosure: I am part of Trade Nation's Influencer program and receive a monthly fee for using their TradingView charts in my analysis.
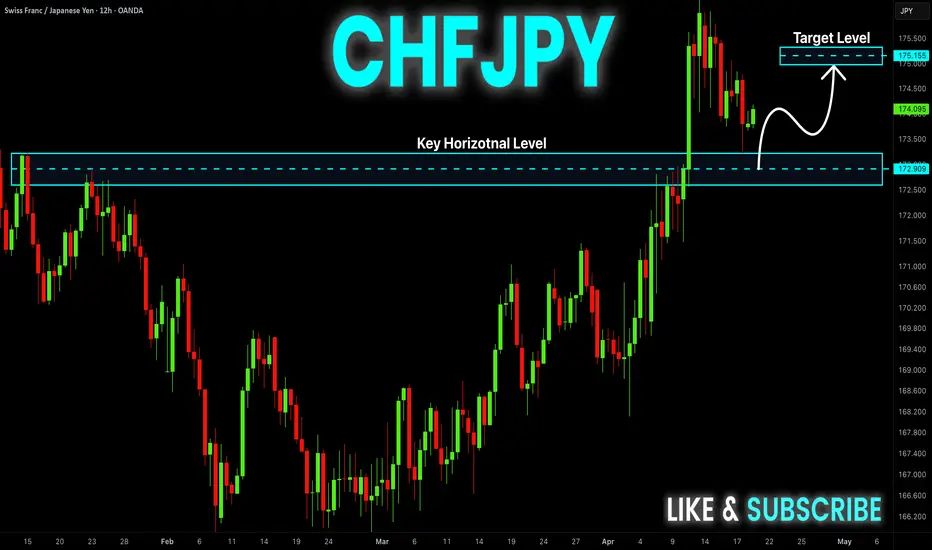
CHF-JPY Will Go UP! Buy!
Hello,Traders!
CHF-JPY is trading in an
Uptrend and the pair is
Hovering just above the
Horizontal support level
Around 172.900 so we
Are bullish biased and
We will be expecting a
Swing move up on Monday
Buy!
Comment and subscribe to help us grow!
Check out other forecasts below too!
Disclosure: I am part of Trade Nation's Influencer program and receive a monthly fee for using their TradingView charts in my analysis.
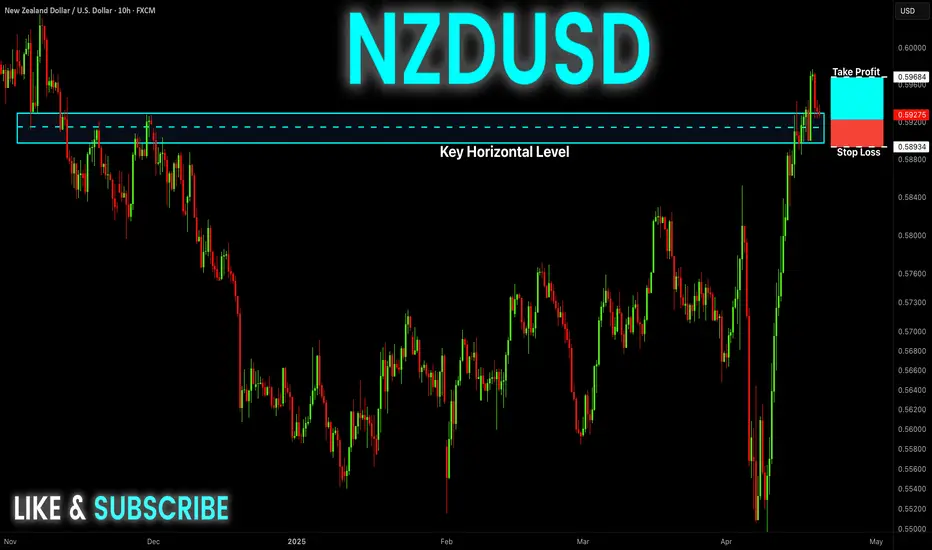
NZD-USD Free Signal! Buy!
Hello,Trades!
NZD-USD made a bullish
Breakout of the key horizontal
Level around 0.5920 then
Made a pullback to retest
The new support so we are
Bullish biased which means
We can enter a long trade
On Monday with the Take
Profit of 0.5968 and the
Stop Loss of 0.5893
Buy!
Comment and subscribe to help us grow!
Check out other forecasts below too!
Disclosure: I am part of Trade Nation's Influencer program and receive a monthly fee for using their TradingView charts in my analysis.
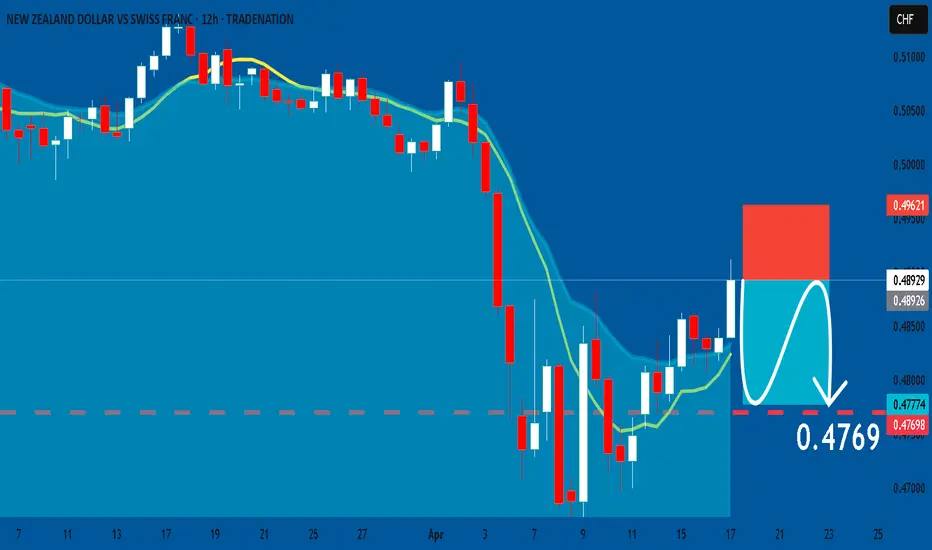
NZDCHF: Short Signal with Entry/SL/TP
NZDCHF
- Classic bearish setup
- Our team expects bearish continuation
SUGGESTED TRADE:
Swing Trade
Short NZDCHF
Entry Point - 0.4892
Stop Loss - 0.4962
Take Profit - 0.4769
Our Risk - 1%
Start protection of your profits from lower levels
Disclosure: I am part of Trade Nation's Influencer program and receive a monthly fee for using their TradingView charts in my analysis.
❤️ Please, support our work with like & comment! ❤️
SILVER: Short Signal Explained
SILVER
- Classic bearish formation
- Our team expects fall
SUGGESTED TRADE:
Swing Trade
Sell SILVER
Entry Level - 32.561
Sl - 33.271
Tp - 31.314
Our Risk - 1%
Start protection of your profits from lower levels
Disclosure: I am part of Trade Nation's Influencer program and receive a monthly fee for using their TradingView charts in my analysis.
❤️ Please, support our work with like & comment! ❤️

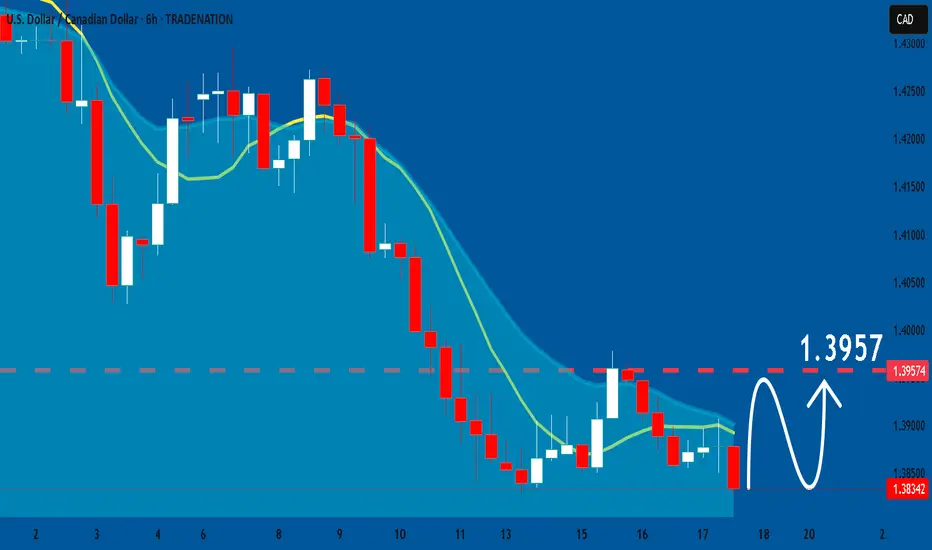
USDCAD: Growth & Bullish Continuation
Looking at the chart of USDCAD right now we are seeing some interesting price action on the lower timeframes. Thus a local move up seems to be quite likely.
Disclosure: I am part of Trade Nation's Influencer program and receive a monthly fee for using their TradingView charts in my analysis.
❤️ Please, support our work with like & comment! ❤️