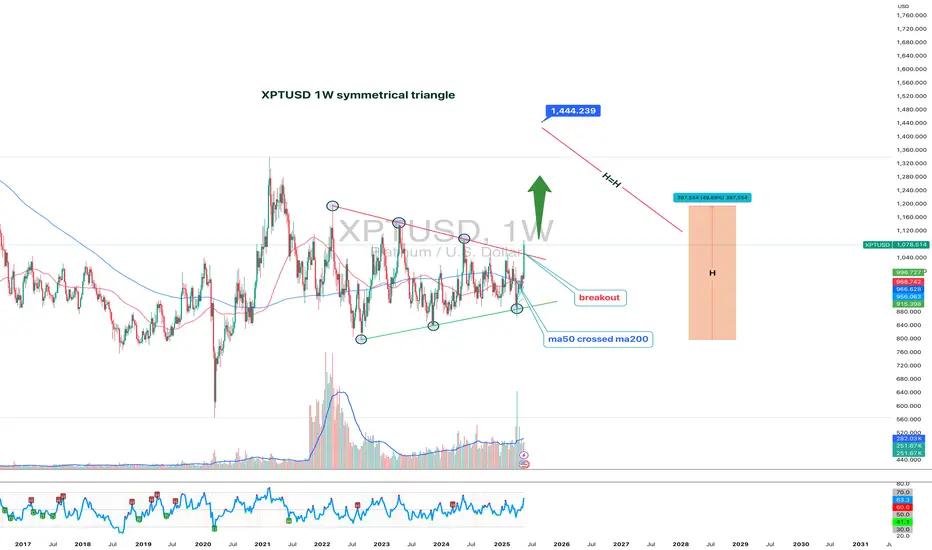
XPTUSD 1W:While Everyone Watches Gold, Platinum Quietly Wakes UpGold gets the headlines — but platinum just broke two years of silence with a clean, high-volume breakout from a symmetrical triangle on the weekly chart. And this isn’t noise — this is the structural shift traders wait for.
Price has been coiled inside a compressing wedge since early 2022. Equal highs. Equal lows. Stop hunts both ways. The classic “shake out before take off.” Now? The breakout is in. And the weekly candle closed above resistance with volume confirmation. Oh, and while we're at it — the 50MA just crossed above the 200MA, signaling a long-term trend reversal.
Target? Measure the triangle height: ~398 points. That projects a breakout target of 1440 USD, which aligns perfectly with previous institutional rejection zones.
But this isn’t just about the chart.
🔹 South Africa, the top global supplier, is struggling with energy and production cuts;
🔹 The Fed is pausing rate hikes — the dollar weakens, metals rally;
🔹 Demand from hydrogen tech, clean energy, and industrial catalysts is on the rise.
Translation? Smart money has been accumulating. The move from 965–1070 was just the ignition. The drive hasn’t started yet.
So while everyone fights over gold highs, platinum sits at the base of a move no one's prepared for — except those who know how accumulation ends.
🧭 Key support: 965–985
📍 Resistance zone: 1150–1180
🎯 Measured target: 1440+
Smartmoney
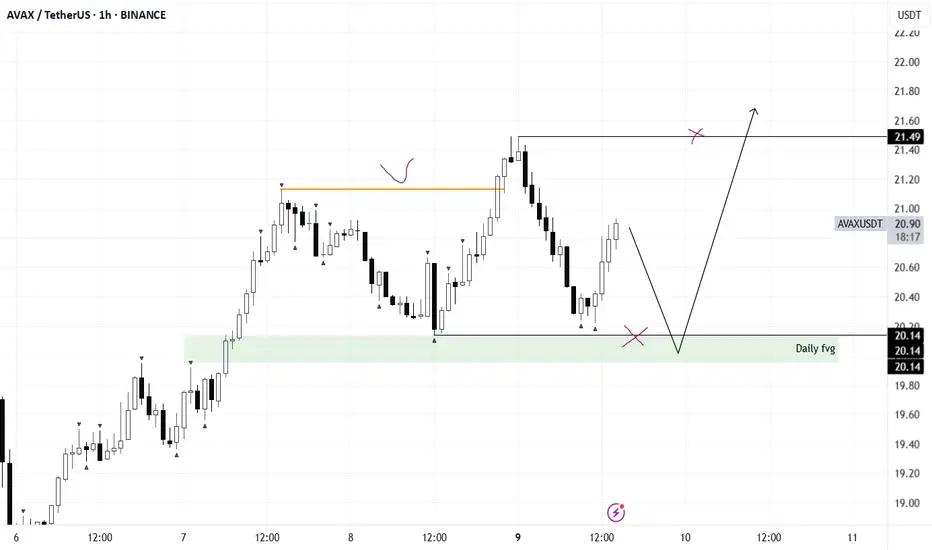
AVAX/USDTAVAX is currently in a consolidation phase.
The key area of interest is the liquidity zone around $20.14 combined with a daily FVG.
🎯 After a move into this zone, long setups can be considered — only if proper conditions are met.
Target to the upside: $21.49
📌 Waiting for confirmation before execution. No setup — no trade.
ADA/USDTADA is currently in a local consolidation phase.
After a liquidity grab/manipulation sweep, we can start watching for long opportunities.
🎯 Upside target: $0.68 – $0.69
📊 Waiting for confirmation post-manipulation to trigger entries. Patience is key — setup is forming.

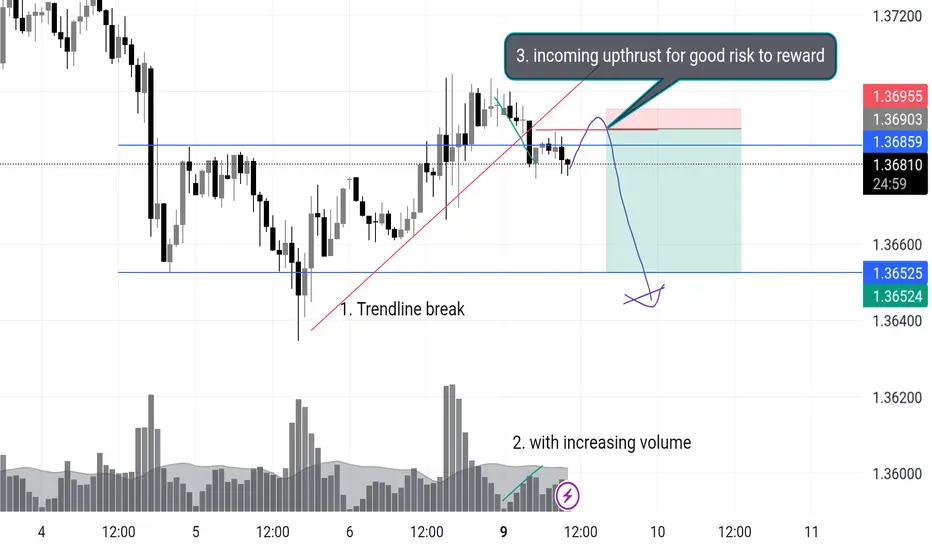
USDCAD Short Opportunity Description :
USDCAD is setting up for a potential short — I’m watching closely for an upthrust into the highlighted zone to initiate the position. Here’s my current read:
🔍 Technical Breakdown:
1. Trendline Break
Previous bullish trendline broken with conviction. Market structure now vulnerable to bearish continuation.
2. Volume Spike with Selling Pressure
Notable increase in volume on bearish candles — suggests smart money exiting or early sellers stepping in.
3. Anticipating an Upthrust
Watching for price to sweep the highs around 1.3695–1.3700, fail to sustain, and drop back inside range.
This would provide a low-risk entry with tight stops above the highs and 5r+ down to 1.3652, possibly even lower.
📌 Trade Plan:
Entry Zone: 1.3695–1.3700 (after upthrust confirmation)
Stop: Above 1.3710
TP1: 1.3652 (structure low)
TP2: 1.3600 (extended target if momentum builds)
---
🧠 Why This Setup?
This aligns with key principles I trade:
Trendline breaks often lead to retests followed by continuation.
Rising volume on the break is confirmation, not noise.
A failed breakout (upthrust) into previous supply zones is often the "last push" before price collapses.
Let me know if you're seeing something different. This is how I’m planning to attack the chart today.
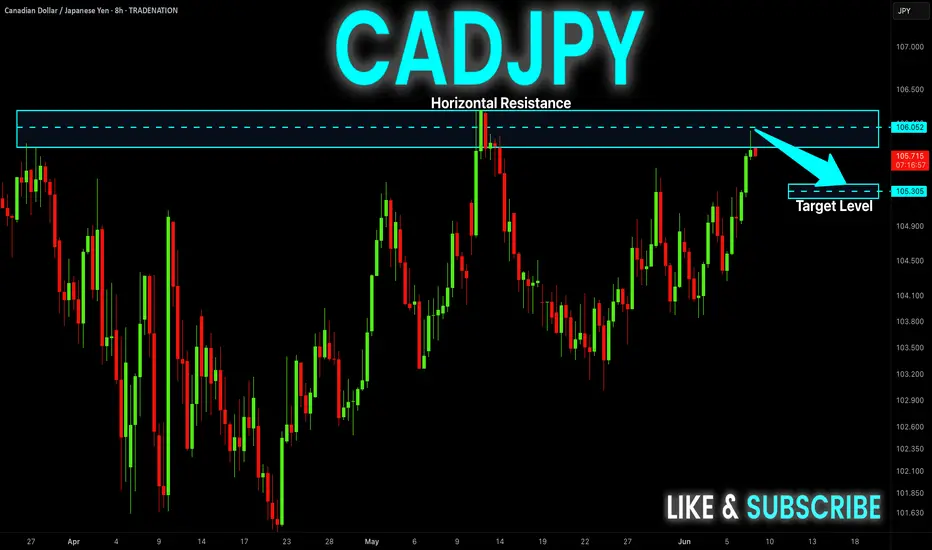
CAD-JPY Pullback Expected! Sell!
Hello,Traders!
CAD-JPY made a retest of
The strong horizontal resistance
Level of 106.083 and as you
Can see the pair is already
Making a local pullback from
The level which sends a clear
Bearish signal to us therefore
We will be expecting a
Further bearish correction
Sell!
Comment and subscribe to help us grow!
Check out other forecasts below too!
Disclosure: I am part of Trade Nation's Influencer program and receive a monthly fee for using their TradingView charts in my analysis.
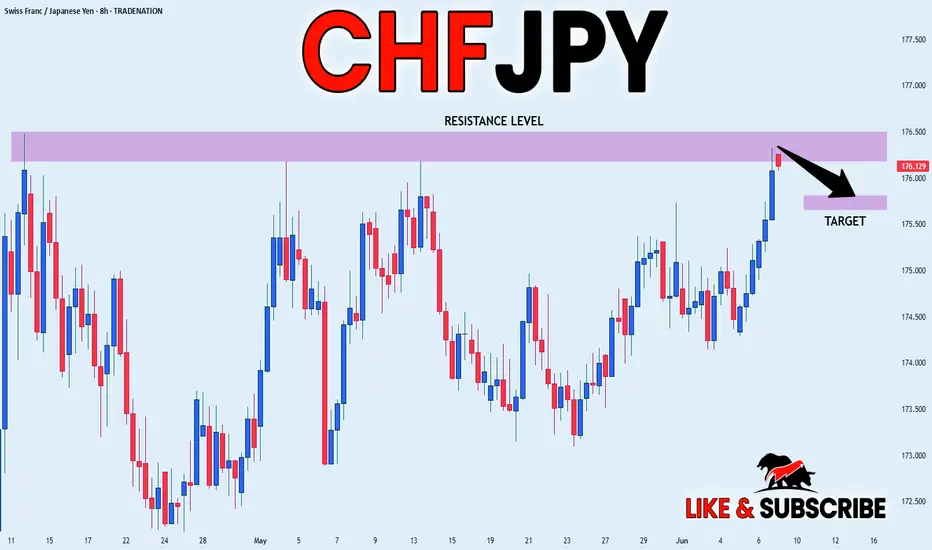
CHF_JPY WILL FALL|SHORT|
✅CHF_JPY price went up sharply
But a strong resistance level was hit around 176.330
Thus, as a pullback is already happening
And a move down towards the target of 175.799 shall follow
SHORT🔥
✅Like and subscribe to never miss a new idea!✅
Disclosure: I am part of Trade Nation's Influencer program and receive a monthly fee for using their TradingView charts in my analysis.
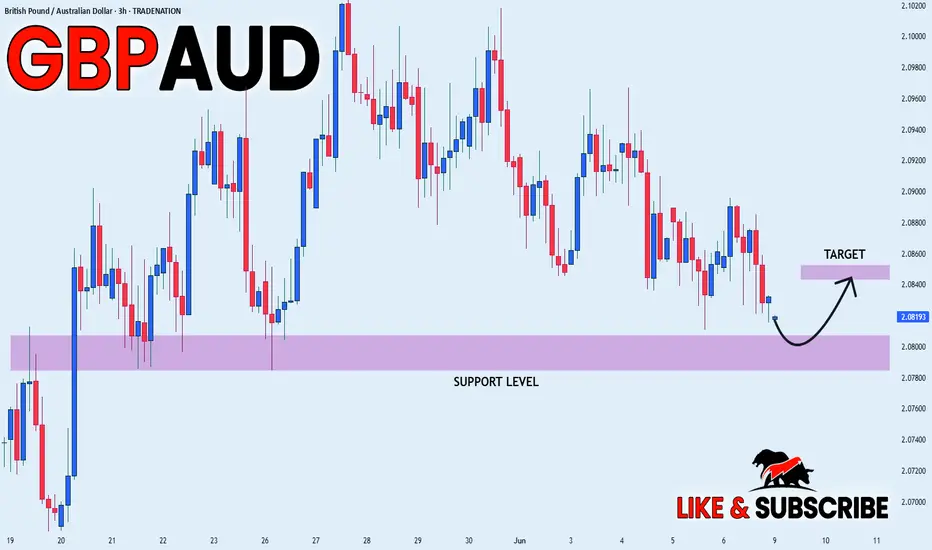
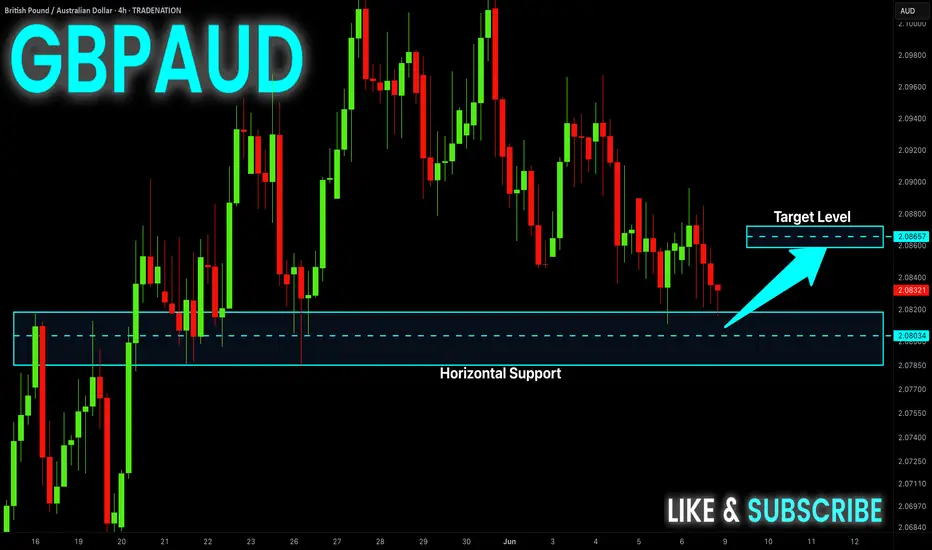
GBP_AUD REBOUND AHEAD|LONG|
✅GBP_AUD has been falling recently
And the pair seems locally oversold
So as the pair is approaching a horizontal support of 2.0786
Price growth is to be expected
LONG🚀
✅Like and subscribe to never miss a new idea!✅
Disclosure: I am part of Trade Nation's Influencer program and receive a monthly fee for using their TradingView charts in my analysis.
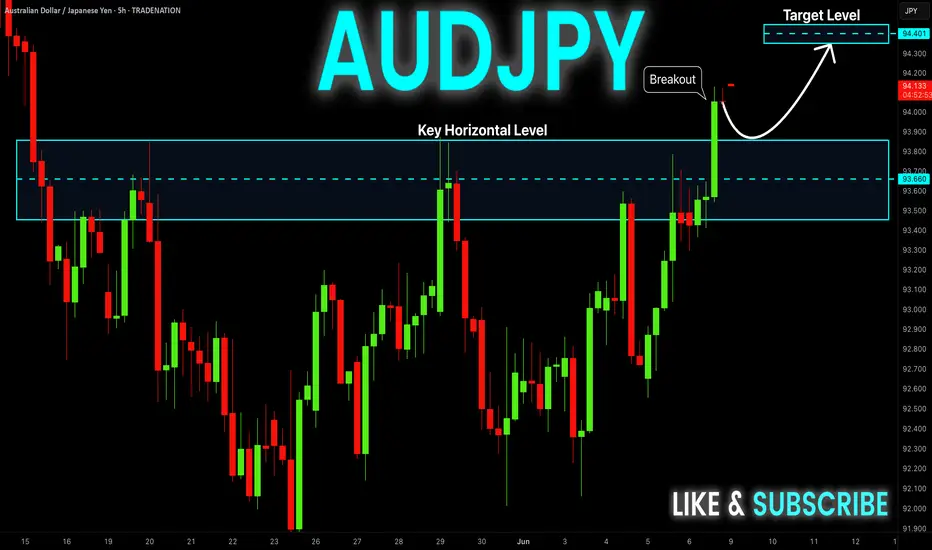
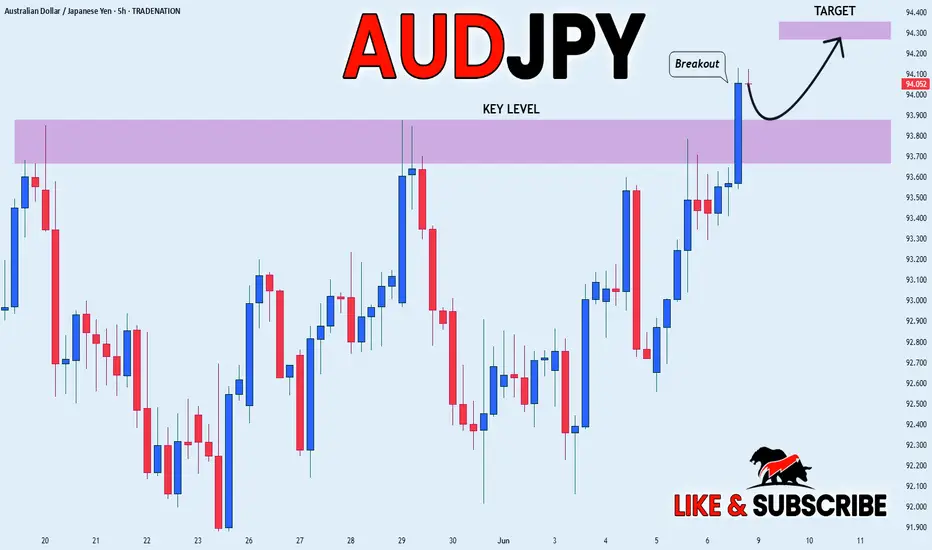
AUD-JPY Will Keep Growing! Buy!
Hello,Traders!
AUD-JPY made a bullish
Breakout of the key
Horizontal level of 93.800
And the breakout is confirmed
So we are bullish biased
And we will be expecting
A further bullish move up
Buy!
Comment and subscribe to help us grow!
Check out other forecasts below too!
Disclosure: I am part of Trade Nation's Influencer program and receive a monthly fee for using their TradingView charts in my analysis.
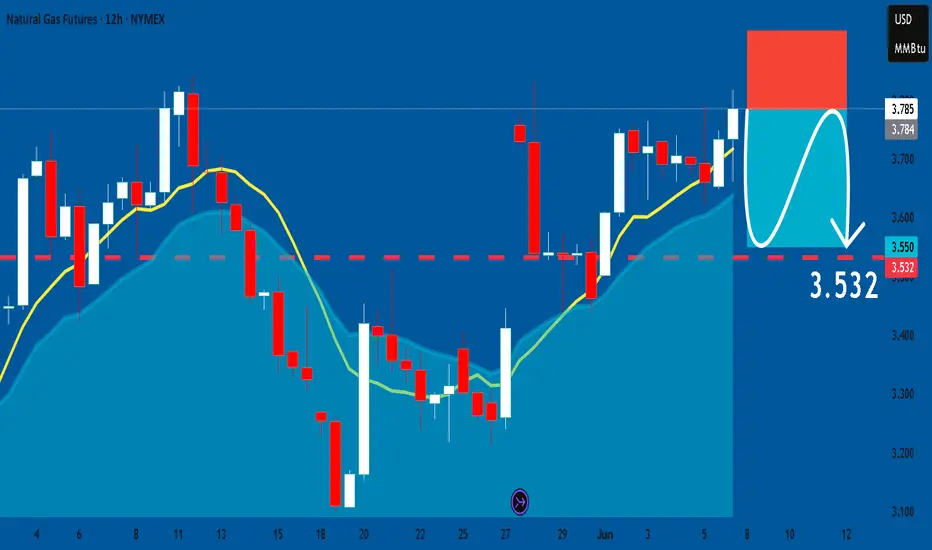
NATGAS: Bearish Continuation & Short Trade
NATGAS
- Classic bearish formation
- Our team expects fall
SUGGESTED TRADE:
Swing Trade
Sell NATGAS
Entry Level - 3.785
Sl - 3.918
Tp - 3.532
Our Risk - 1%
Start protection of your profits from lower levels
Disclosure: I am part of Trade Nation's Influencer program and receive a monthly fee for using their TradingView charts in my analysis.
❤️ Please, support our work with like & comment! ❤️
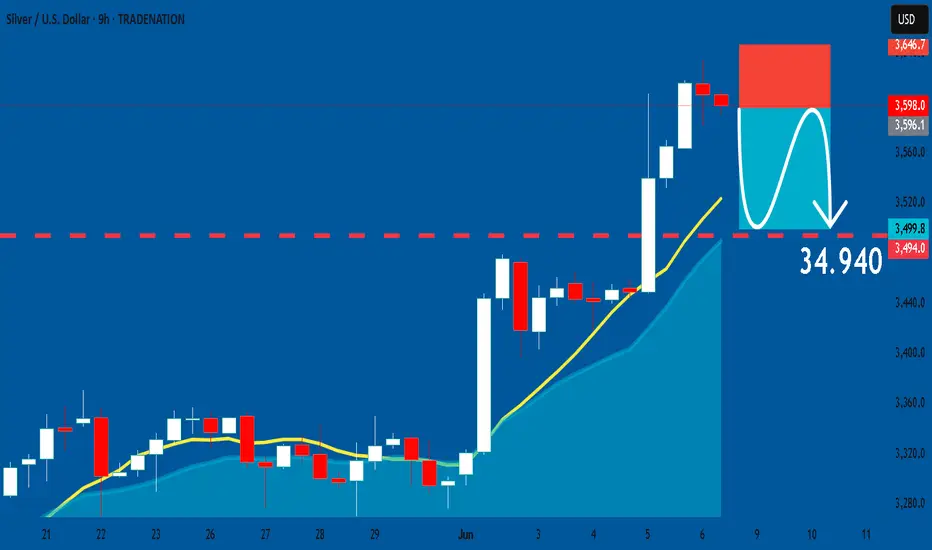
SILVER: Short Signal with Entry/SL/TP
SILVER
- Classic bearish formation
- Our team expects pullback
SUGGESTED TRADE:
Swing Trade
Short SILVER
Entry - 35.980
Sl - 36.467
Tp - 34.940
Our Risk - 1%
Start protection of your profits from lower levels
Disclosure: I am part of Trade Nation's Influencer program and receive a monthly fee for using their TradingView charts in my analysis.
❤️ Please, support our work with like & comment! ❤️
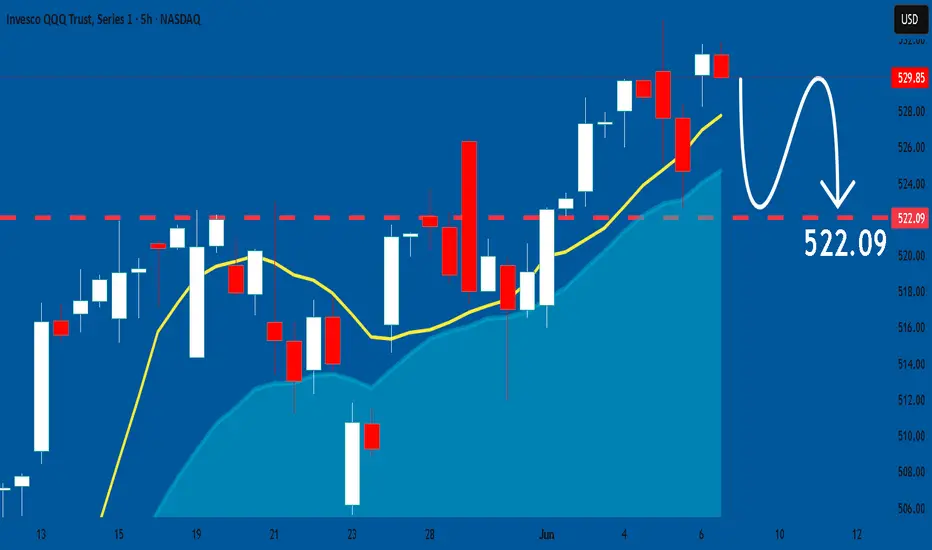
QQQ: Expecting Bearish Continuation! Here is Why:
Looking at the chart of QQQ right now we are seeing some interesting price action on the lower timeframes. Thus a local move down seems to be quite likely.
Disclosure: I am part of Trade Nation's Influencer program and receive a monthly fee for using their TradingView charts in my analysis.
❤️ Please, support our work with like & comment! ❤️
BTCUSD: Weak Market & Bearish Continuation
Remember that we can not, and should not impose our will on the market but rather listen to its whims and make profit by following it. And thus shall be done today on the BTCUSD pair which is likely to be pushed down by the bears so we will sell!
Disclosure: I am part of Trade Nation's Influencer program and receive a monthly fee for using their TradingView charts in my analysis.
❤️ Please, support our work with like & comment! ❤️

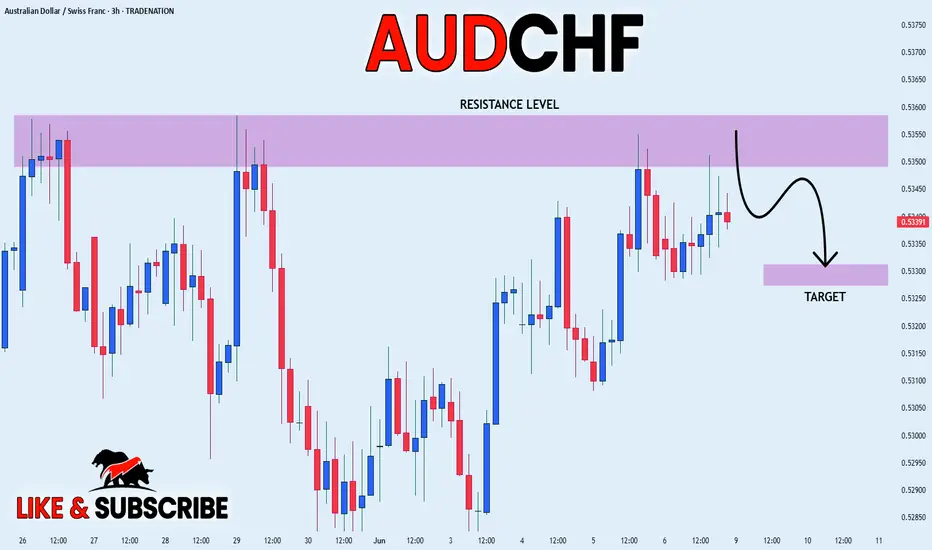
AUD_CHF ELEGANT SHORT|
✅AUD_CHF went up to retest
A horizontal resistance level of 0.5358
Which makes me locally bearish biased
And I think that a move down
From the level is to be expected
Towards the target below at 0.5330
SHORT🔥
✅Like and subscribe to never miss a new idea!✅
Disclosure: I am part of Trade Nation's Influencer program and receive a monthly fee for using their TradingView charts in my analysis.
CHF-JPY Correction Ahead! Sell!
Hello,Traders!
CHF-JPY will soon hit a
Horizontal resistance
Of 176.500 and as the
Pair is overbought we
Will be expecting a bearish
Correction next week
Sell!
Comment and subscribe to help us grow!
Check out other forecasts below too!
Disclosure: I am part of Trade Nation's Influencer program and receive a monthly fee for using their TradingView charts in my analysis.

AUD_JPY BULLISH BREAKOUT|LONG|
✅AUD_JPY is trading in a
Local uptrend and the pair
Broke the key horizontal level
Of 93.866 and the breakout is
Confirmed so we will be
Expecting a further
Bullish move up on Monday
LONG🚀
✅Like and subscribe to never miss a new idea!✅
Disclosure: I am part of Trade Nation's Influencer program and receive a monthly fee for using their TradingView charts in my analysis.
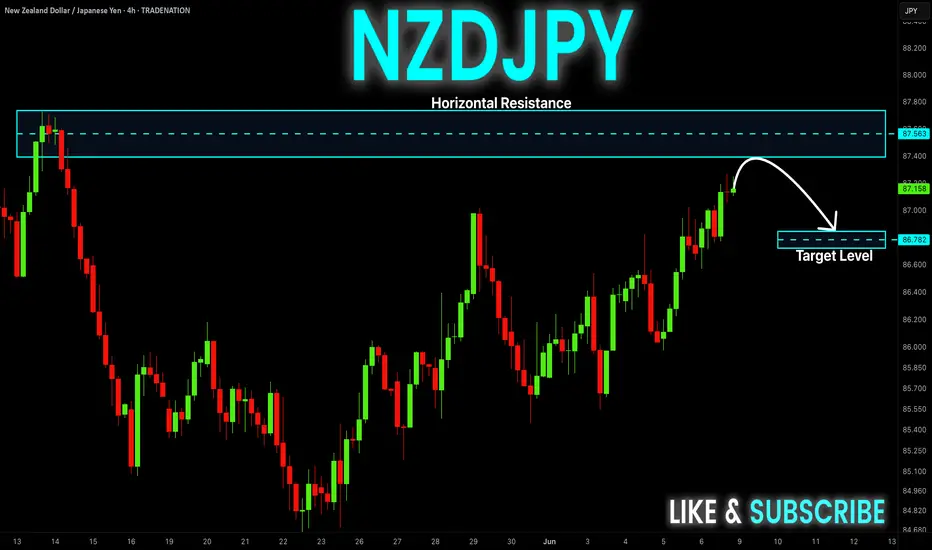
NZD-JPY Will Go Down! Sell!
Hello,Traders!
NZD-JPY keeps growing
But will soon hit a horizontal
Resistance of 87.730 and as
The pair is locally overbought
So after the retest we will
Be expecting a local
Bearish correction
Sell!
Comment and subscribe to help us grow!
Check out other forecasts below too!
Disclosure: I am part of Trade Nation's Influencer program and receive a monthly fee for using their TradingView charts in my analysis.
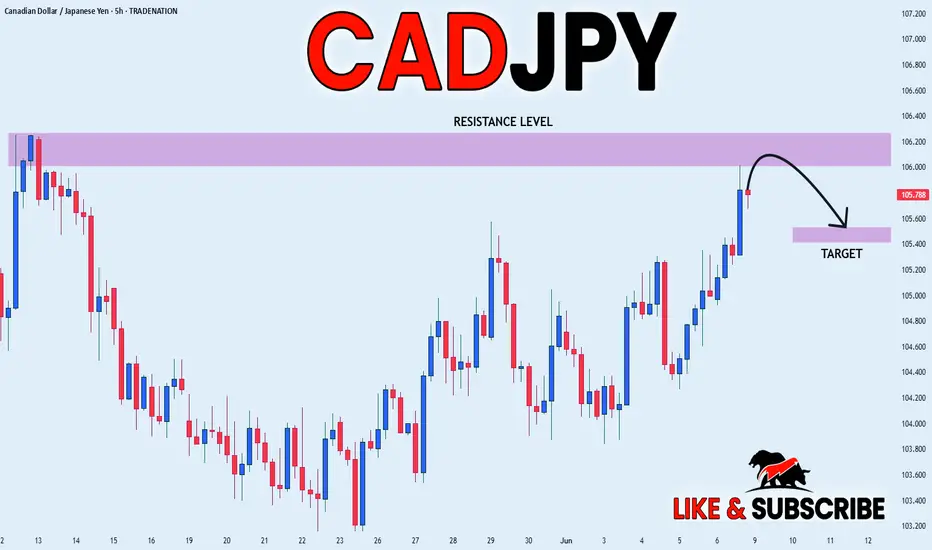
CAD_JPY SHORT FROM RESISTANCE|
✅CAD_JPY has been growing recently
And the pair seems locally overbought
So as the pair is approaching a horizontal resistance of 106.269
Price decline is to be expected
SHORT🔥
✅Like and subscribe to never miss a new idea!✅
Disclosure: I am part of Trade Nation's Influencer program and receive a monthly fee for using their TradingView charts in my analysis.
GBP-AUD Local Long! Buy!
Hello,Traders!
GBP-AUD will soon hit
A horizontal support
Of 2.0780 and as it is
A strong level we will
Be expecting a bullish
Rebound and a move up
Buy!
Comment and subscribe to help us grow!
Check out other forecasts below too!
Disclosure: I am part of Trade Nation's Influencer program and receive a monthly fee for using their TradingView charts in my analysis.
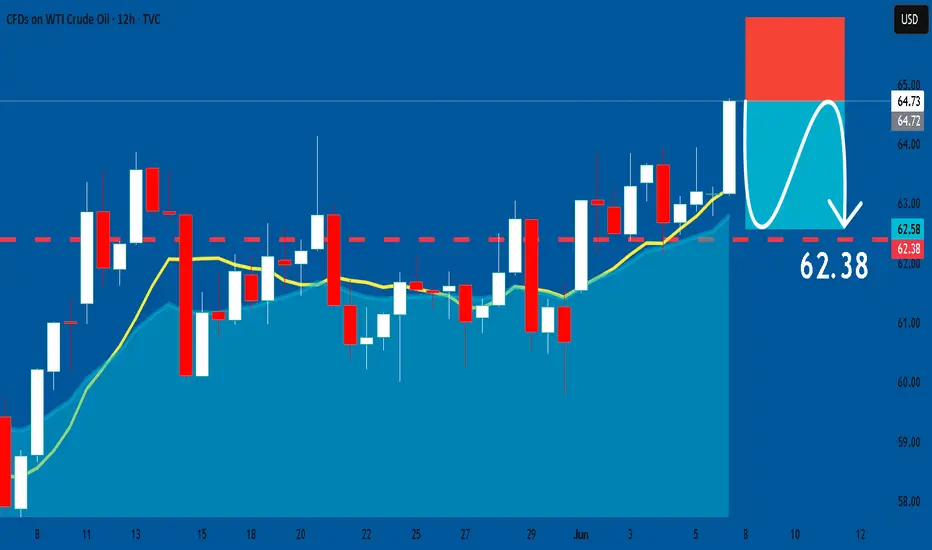
USOIL: Short Signal Explained
USOIL
- Classic bearish pattern
- Our team expects retracement
SUGGESTED TRADE:
Swing Trade
Sell USOIL
Entry - 64.73
Stop - 66.13
Take - 62.38
Our Risk - 1%
Start protection of your profits from lower levels
Disclosure: I am part of Trade Nation's Influencer program and receive a monthly fee for using their TradingView charts in my analysis.
❤️ Please, support our work with like & comment! ❤️
TESLA: Long Signal with Entry/SL/TP
TESLA
- Classic bullish formation
- Our team expects pullback
SUGGESTED TRADE:
Swing Trade
Long TESLA
Entry - 295.19
Sl - 276.74
Tp -325.39
Our Risk - 1%
Start protection of your profits from lower levels
Disclosure: I am part of Trade Nation's Influencer program and receive a monthly fee for using their TradingView charts in my analysis.
❤️ Please, support our work with like & comment! ❤️

SPY: Swing Trading & Technical Analysis
Balance of buyers and sellers on the SPY pair, that is best felt when all the timeframes are analyzed properly is shifting in favor of the sellers, therefore is it only natural that we go short on the pair.
Disclosure: I am part of Trade Nation's Influencer program and receive a monthly fee for using their TradingView charts in my analysis.
❤️ Please, support our work with like & comment! ❤️

EURUSD: Bullish Continuation is Expected! Here is Why:
Our strategy, polished by years of trial and error has helped us identify what seems to be a great trading opportunity and we are here to share it with you as the time is ripe for us to buy EURUSD.
Disclosure: I am part of Trade Nation's Influencer program and receive a monthly fee for using their TradingView charts in my analysis.
❤️ Please, support our work with like & comment! ❤️

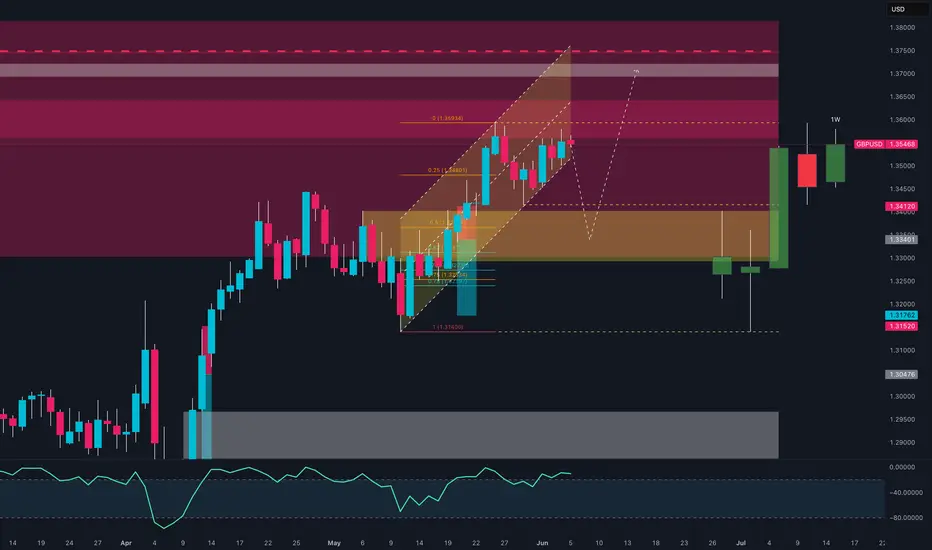
GBP/USD Is This the Last Dip Before 1.37?🔹 1. Price Action & Technical Structure (Weekly & Daily Charts)
Price has broken above the ascending channel highlighted on the weekly chart.
The 1.3545 area is currently acting as dynamic resistance — a weekly close above it is crucial to confirm a breakout.
Below, we find a bullish order block (demand zone) around 1.3340 – 1.3280, aligning with the 0.5 Fibonacci level.
RSI is neutral, showing no bearish divergence at the moment.
🔹 2. COT Report (Commitment of Traders)
USD Index:
Non-commercial traders: +823 new longs, +363 new shorts → Neutral to bullish positioning.
Commercials remain net short, indicating short-term USD strength potential.
EUR FX (inverse proxy for USD):
Significant reduction in speculative long positions → Less bullish pressure on the Euro, favoring USD strength.
🔹 3. Sentiment
67% of retail traders are short GBP/USD vs. 33% long.
This is a bullish contrarian signal, suggesting potential continuation toward the 1.36–1.37 zone.
🔹 4. Seasonality
Historically, June tends to be bearish for GBP/USD over the past 5–10 years.
However, the first 10 days of the month often start with bullish momentum before correcting in the second half.
🔹 5. Economic Calendar
Today: Construction PMI (GBP), ECB Press Conference (EUR), Unemployment Claims (USD).
Tomorrow: High potential volatility across all USD pairs.
Watch out — upcoming macro data may strongly impact breakout confirmation.
🔹 6. Operational Outlook
Primary Bias: Neutral/Bullish with potential for a technical pullback.
📍 Key Levels:
Resistance: 1.3545 – 1.3593 (Supply zone + 0.0 fib)
Support: 1.3340 – 1.3280 (OB + 0.5/0.618 fib)
🧠 Scenario 1 – Bullish Continuation:
Retest of 1.3340 → long targeting 1.3590 / 1.3680
Confirmation on daily close above 1.3550
🔻 Scenario 2 – Bearish Retracement:
Rejection below 1.3550 + USD macro strength → drop toward 1.3280
If that breaks → extended move to 1.3170 / 1.3150