EURAUD (BOS + IMB + OTE)Hello traders!
Description: We have STB(Sell to Buy Action) - you can see it on 1H TF, which grab some liquidity and then made BOS. In this moment we can expect that price comeback to 0.5 and then i will look reversal on LFT, after closing IMB.
Entry: Confirmation on LTF in POI. Alarm on 0.5 Fib Level.
Target: HH
P.S: check also previous idea. We still have valid Demand on LTF.
Have a profitable day and don't forget to subscribe for more updates!
If you like this idea drop a like, leave a comment or write your pair, i will check.
Smartmoney

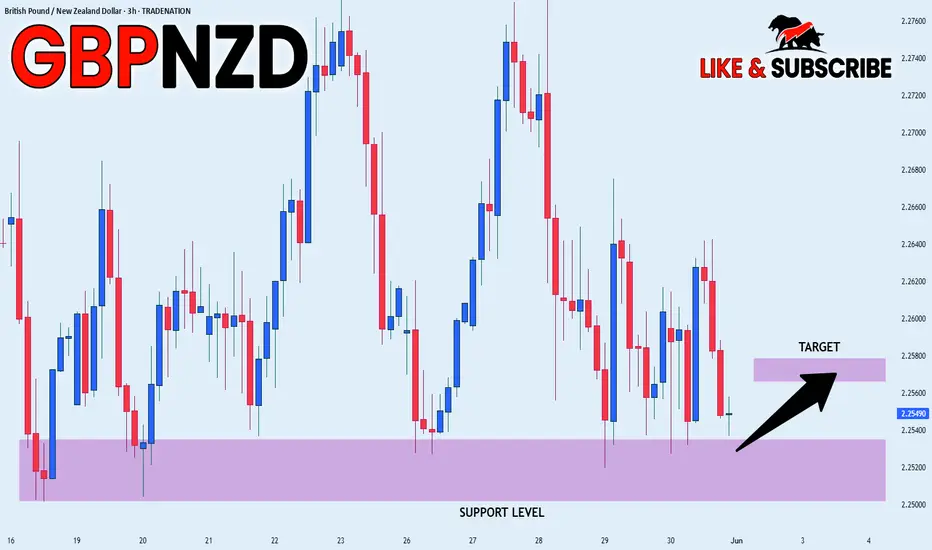
GBP_AUD RIKSY LONG|
✅GBP_AUD is going down to retest
A horizontal support of 2.2504
And we are locally bullish biased
So I think that we will see a rebound
And a move up from the level
Towards the target above at 2.2571
LONG🚀
✅Like and subscribe to never miss a new idea!✅
Disclosure: I am part of Trade Nation's Influencer program and receive a monthly fee for using their TradingView charts in my analysis.
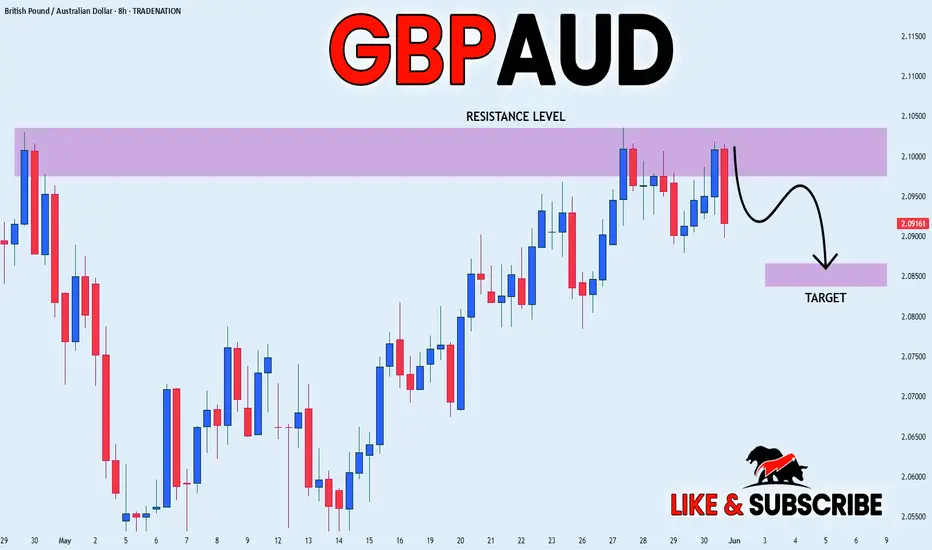
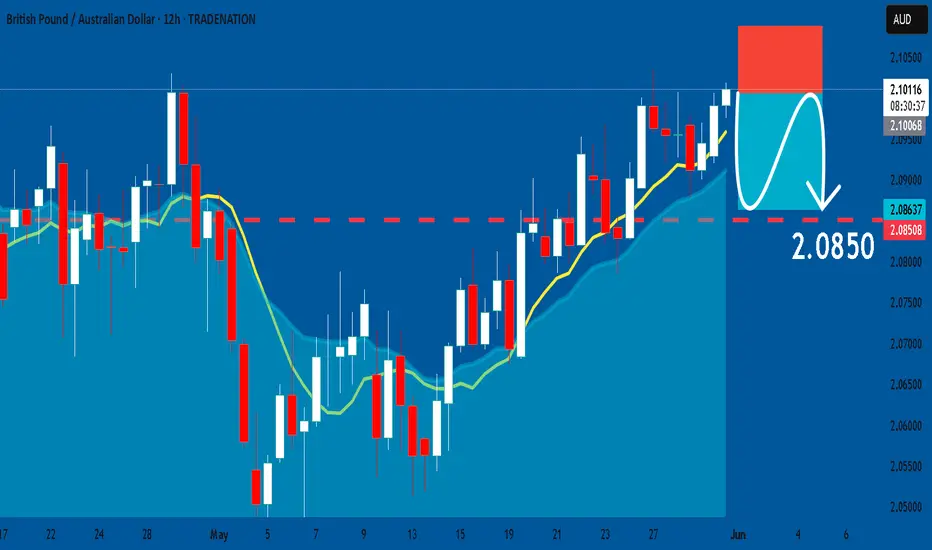
GBP_AUD MOVE DOWN AHEAD|SHORT|
✅GBP_AUD has retested a key resistance level around 2.1034
And as the pair is already making a bearish pullback
A move down to retest the demand level below at 2.0859 is likely
SHORT🔥
✅Like and subscribe to never miss a new idea!✅
Disclosure: I am part of Trade Nation's Influencer program and receive a monthly fee for using their TradingView charts in my analysis.
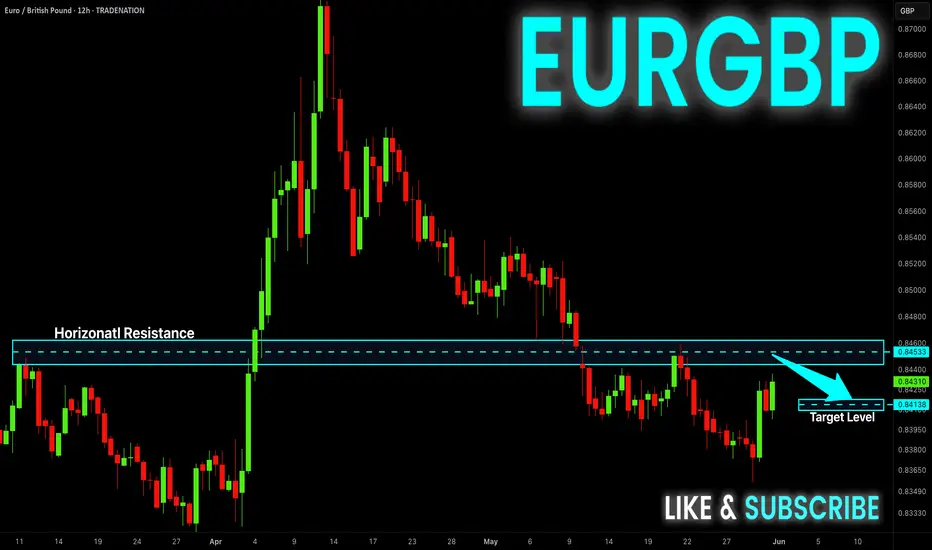
EUR-GBP Resistance Ahead! Sell!
Hello,Traders!
EUR-GBP made a nice
Rebound from the support
Level below just as we predicted
In our previous analysis and is
Growing nicely but the pair
Will soon hit a horizontal resistance
Level of 0.8460 from where
A local bearish correction
Is to be expected on Monday!
Sell!
Comment and subscribe to help us grow!
Check out other forecasts below too!
Disclosure: I am part of Trade Nation's Influencer program and receive a monthly fee for using their TradingView charts in my analysis.
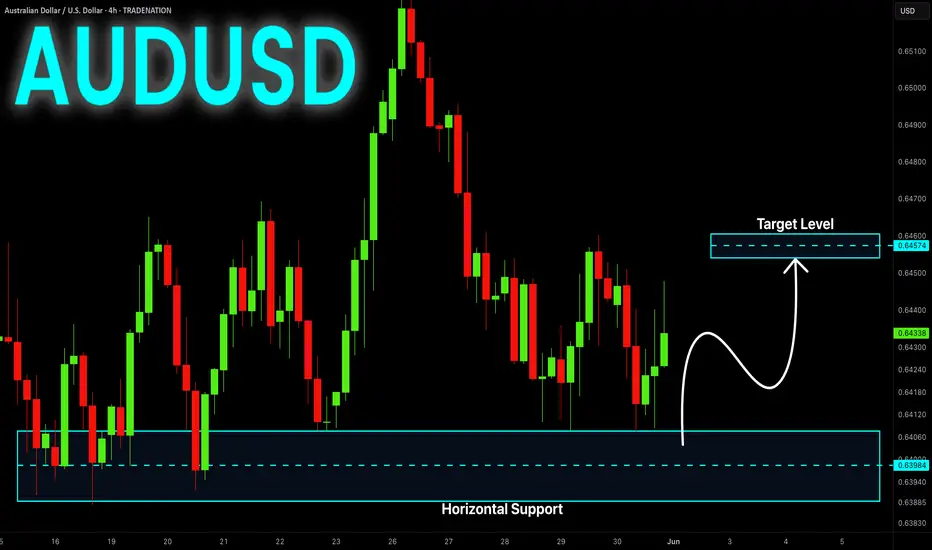
AUD-USD Rebound Ahead! Buy!
Hello,Traders!
AUD-USD made a retest
Of the horizontal demand
Area around 0.6394 and
We are already seeing a
Nice bullish reaction from
The level so we are locally
Bullish biased and we will
Be expecting a further
Local bullish move up
On Monday
Buy!
Comment and subscribe to help us grow!
Check out other forecasts below too!
Disclosure: I am part of Trade Nation's Influencer program and receive a monthly fee for using their TradingView charts in my analysis.
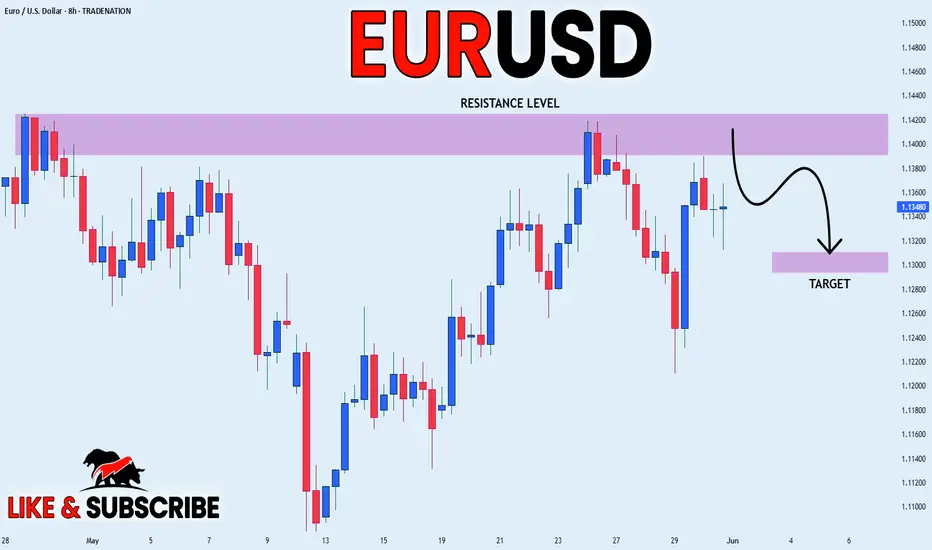
EUR-USD Bearish Bias! Sell!
Hello,Traders!
EUR-USD will soon hit a
Strong horizontal resistance
Level around 1.1420 so as
It is a strong level a local
Bearish pullback and a move
Down are to be expected
On Monday
Sell!
Comment and subscribe to help us grow!
Check out other forecasts below too!
Disclosure: I am part of Trade Nation's Influencer program and receive a monthly fee for using their TradingView charts in my analysis.
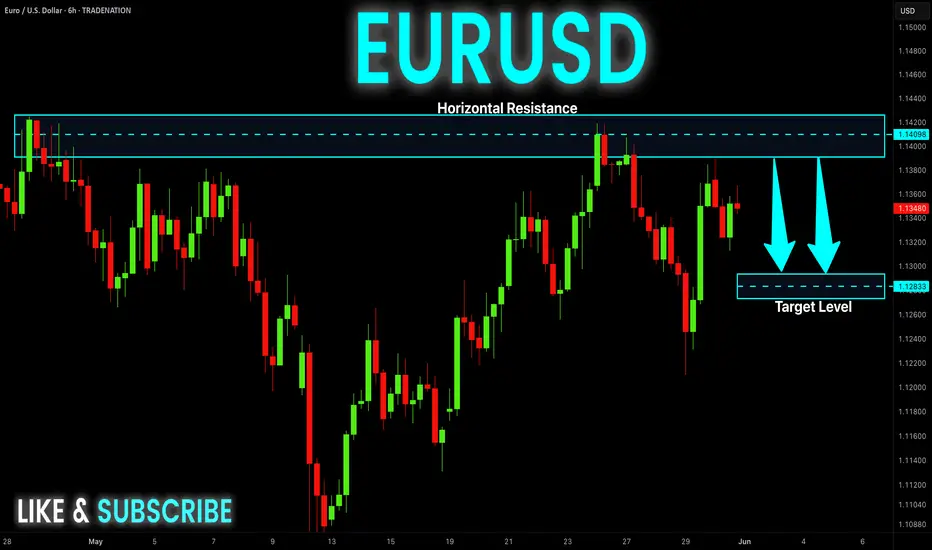
EUR_USD WILL FALL|SHORT|
✅EUR_USD is going up now
But a strong resistance level is ahead at 1.1425
Thus I am expecting a pullback
And a move down towards the target
Below at 1.1310on Monday!
SHORT🔥
✅Like and subscribe to never miss a new idea!✅
Disclosure: I am part of Trade Nation's Influencer program and receive a monthly fee for using their TradingView charts in my analysis.
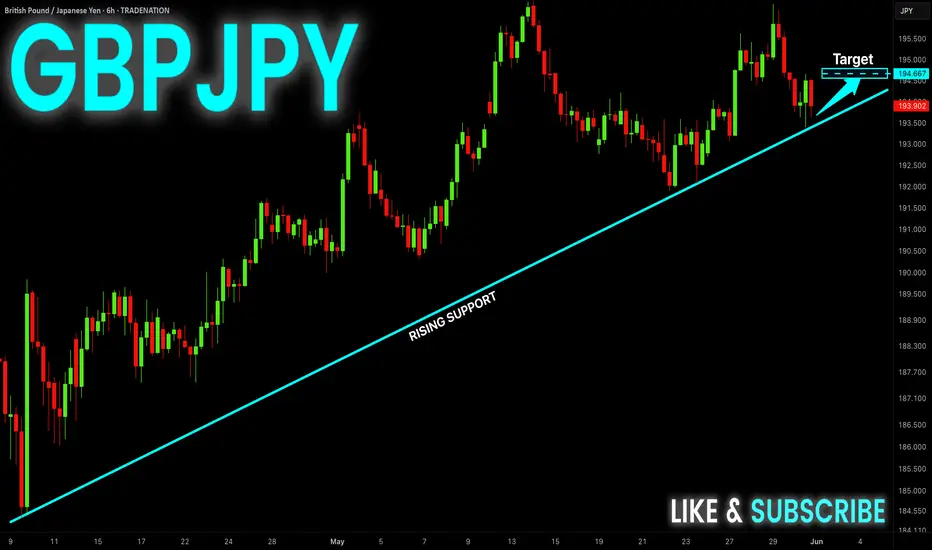
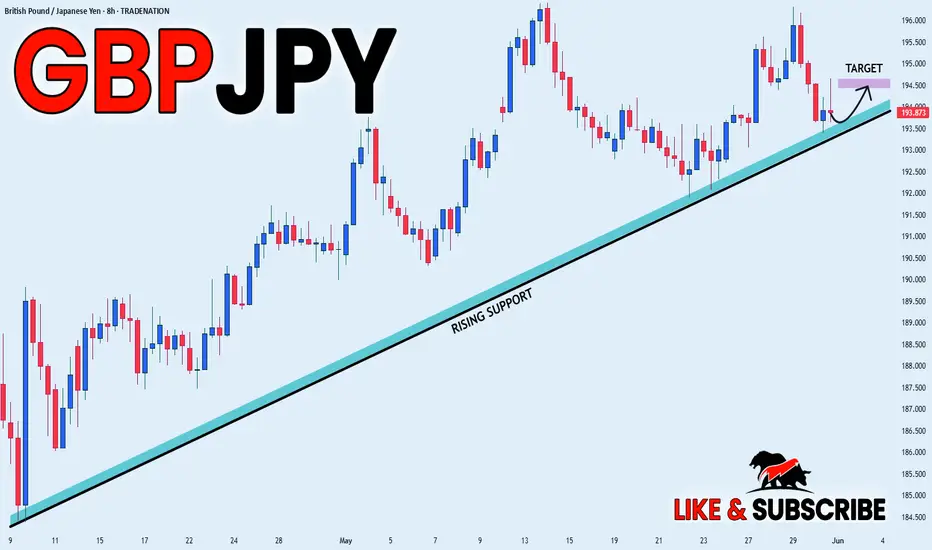
GBP-JPY Growth Ahead! Buy!
Hello,Traders!
GBP-JPY is trading in an
Uptrend along the rising
Support line and the pair
Will soon retest is to we
Will be expecting a rebound
And a bullish move up on Monday
Buy!
Comment and subscribe to help us grow!
Check out other forecasts below too!
Disclosure: I am part of Trade Nation's Influencer program and receive a monthly fee for using their TradingView charts in my analysis.
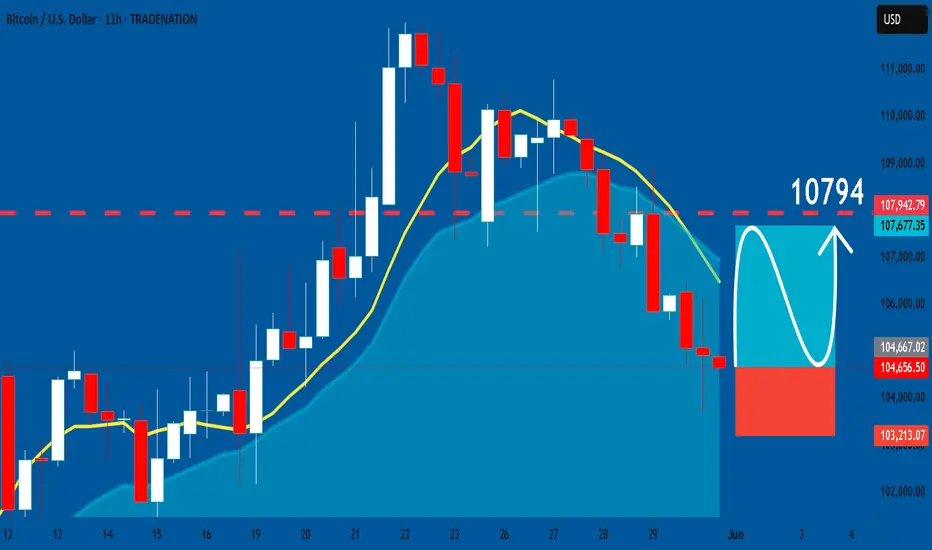
BTCUSD: Bullish Continuation & Long Trade
BTCUSD
- Classic bullish setup
- Our team expects bullish continuation
SUGGESTED TRADE:
Swing Trade
Long BTCUSD
Entry Point - 10465
Stop Loss - 10321
Take Profit - 10794
Our Risk - 1%
Start protection of your profits from lower levels
Disclosure: I am part of Trade Nation's Influencer program and receive a monthly fee for using their TradingView charts in my analysis.
❤️ Please, support our work with like & comment! ❤️
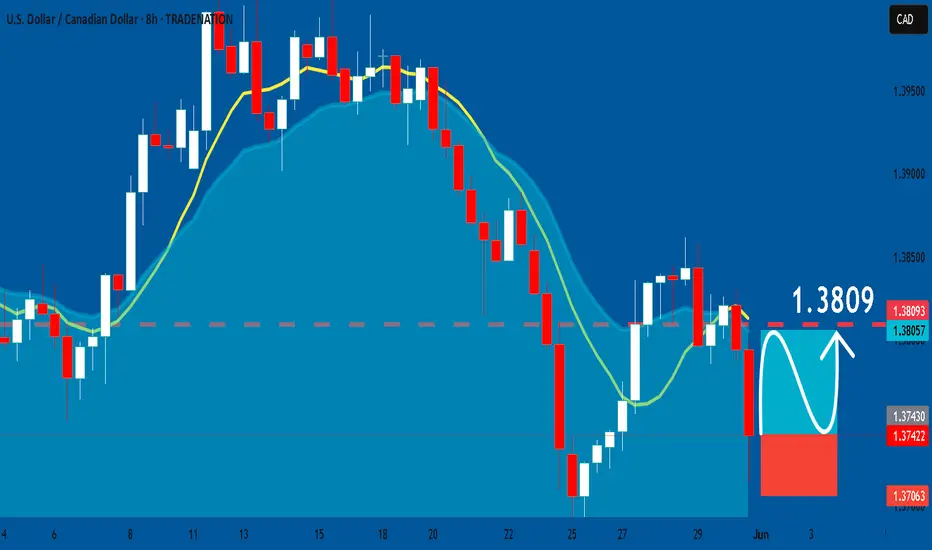
USDCAD: Long Signal Explained
USDCAD
- Classic bullish formation
- Our team expects growth
SUGGESTED TRADE:
Swing Trade
Buy USDCAD
Entry Level - 1.3742
Sl - 1.3706
Tp - 1.3809
Our Risk - 1%
Start protection of your profits from lower levels
Disclosure: I am part of Trade Nation's Influencer program and receive a monthly fee for using their TradingView charts in my analysis.
❤️ Please, support our work with like & comment! ❤️
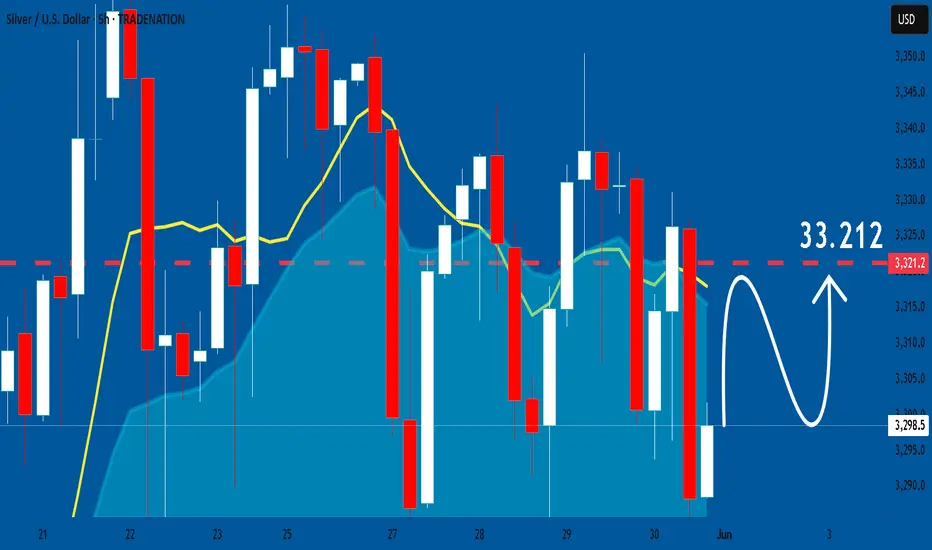
SILVER: Will Start Growing! Here is Why:
Our strategy, polished by years of trial and error has helped us identify what seems to be a great trading opportunity and we are here to share it with you as the time is ripe for us to buy SILVER.
Disclosure: I am part of Trade Nation's Influencer program and receive a monthly fee for using their TradingView charts in my analysis.
❤️ Please, support our work with like & comment! ❤️
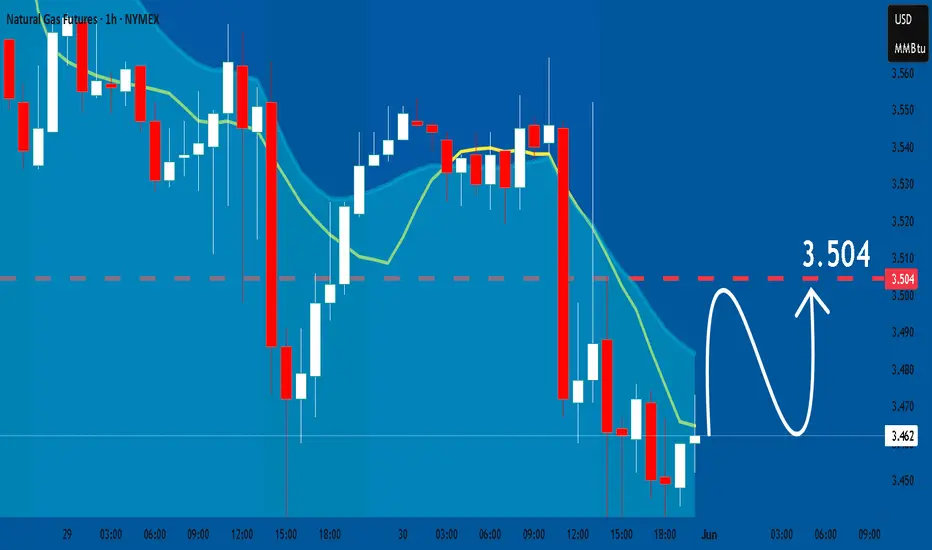
NATGAS: Forecast & Technical Analysis
The recent price action on the NATGAS pair was keeping me on the fence, however, my bias is slowly but surely changing into the bullish one and I think we will see the price go up.
Disclosure: I am part of Trade Nation's Influencer program and receive a monthly fee for using their TradingView charts in my analysis.
❤️ Please, support our work with like & comment! ❤️
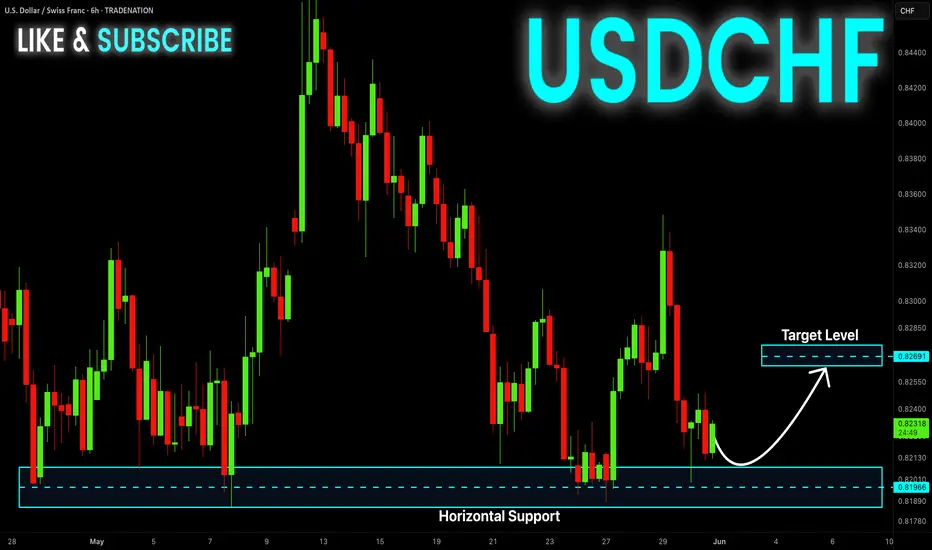
USD-CHF Growth Ahead! Buy!
Hello,Traders!
USD-CHF is approaching a
Key horizontal support area
Around 0.8189 which is a
Strong level so after the retest
A local bullish correction
And a move up are to be expected
Buy!
Comment and subscribe to help us grow!
Check out other forecasts below too!
Disclosure: I am part of Trade Nation's Influencer program and receive a monthly fee for using their TradingView charts in my analysis.
GBP_JPY RISING SUPPORT|LONG|
✅GBP_JPY is trading along the rising support
And as the pair will soon retest it
I am expecting the price to go up
To retest the supply levels above at 194.500
LONG🚀
✅Like and subscribe to never miss a new idea!✅
Disclosure: I am part of Trade Nation's Influencer program and receive a monthly fee for using their TradingView charts in my analysis.
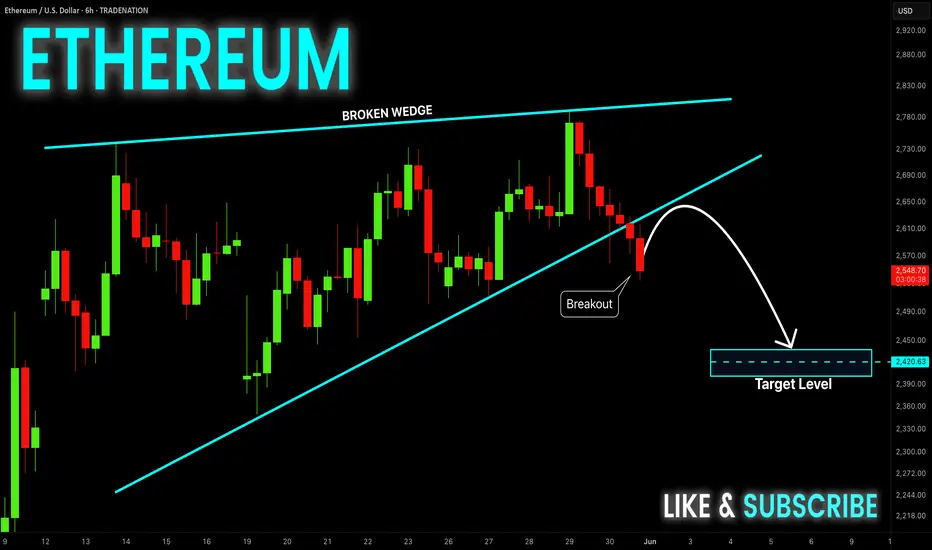
ETHEREUM Wedge Breakout! Sell!
Hello,Traders!
ETHEREUM was trading in an
Uptrend but then the coin
Formed a bearish wedge pattern
And we are now seeing a bearish
Breakout so we are locally
Bearish biased and we will be
Expecting a long awaited
Bearish correction
Sell!
Comment and subscribe to help us grow!
Check out other forecasts below too!
Disclosure: I am part of Trade Nation's Influencer program and receive a monthly fee for using their TradingView charts in my analysis.
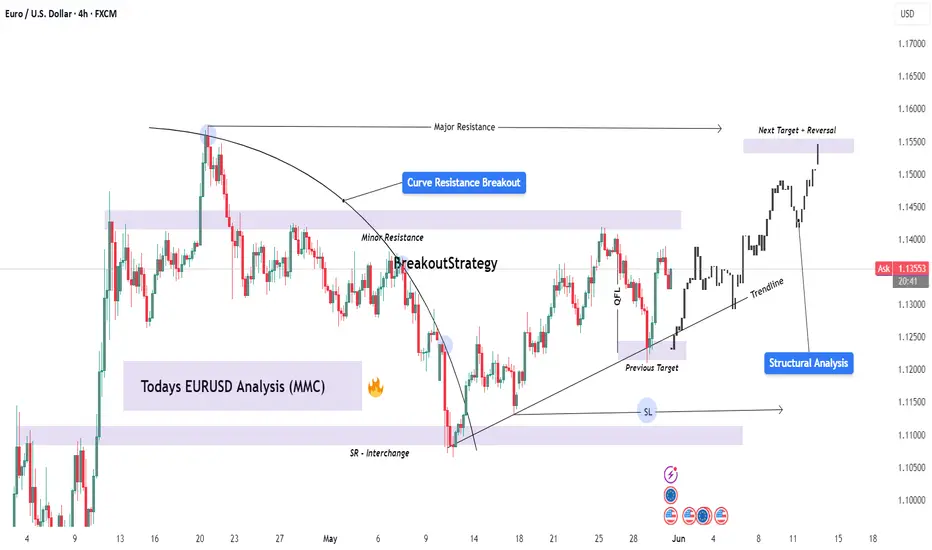
EURUSD Structural Analysis | Curve Breakout to Key Reversal Zone🔍 Structure Analysis:
The EURUSD pair has been exhibiting classic smart money behavior following a reaccumulation phase beneath a curved resistance structure. This curve acted as a dynamic liquidity ceiling, engineered to trap breakout traders during early sessions and encourage early shorts — only to be invalidated later by institutional momentum.
What we now see is a clean structural breakout, a shift in market sentiment, and a precision drive toward premium liquidity zones, where we expect reactions from institutional orders or profit-taking.
📐 Technical Breakdown:
🔹 1. Curved Resistance Breakout (Trend Manipulation Layer)
The curve represents a multi-touch descending resistance line that was gradually compressing price.
Multiple rejections created a false sense of bearish continuation, but in reality, smart money was accumulating positions under the curve.
The final breakout was impulsive and occurred on elevated volume, breaking both the curve and a short-term bearish structure.
🔹 2. Bullish Market Structure Confirmation
Higher highs and higher lows are now clearly established.
After the curve break, the price pulled back slightly, respecting the new trendline support — a sign of retest behavior and continuation.
The previous internal structure break was confirmed after a key swing high was violated, flipping the order flow to bullish.
🔹 3. SR Interchange + QFL Demand Zone
The 1.11800–1.12200 zone held firm during the retracement, previously acting as a strong resistance and now a support flip.
This zone coincides with a QFL-style accumulation base — a concept based on sudden dips into support where big orders are filled before sharp reversals.
Wick rejections and candle closes show strong interest by buyers.
🔹 4. Trendline & Structure Alignment
A clean ascending trendline is acting as dynamic support.
Each touch on the trendline has been followed by bullish expansion — another indication of institutional order flow support.
This trendline also aligns with internal FVGs (Fair Value Gaps), offering more confluence.
🔹 5. Liquidity Magnet: Next Major Zone
The next key area is marked around 1.15500–1.15750, which is a previous structural high, order block, and likely liquidity pool for pending sell-side orders.
This area is expected to act as a magnet, pulling price toward it before a potential reversal or redistribution phase begins.
📊 Trade Management Plan:
Parameter Details
Bias Bullish (Short-Term to Mid-Term)
Entry Zones Retest of trendline or minor FVGs
TP1 1.14500 (interim supply)
TP2 (Main) 1.15500–1.15750 (major liquidity zone)
SL Below 1.11800 (invalidates bullish idea)
RR Target 1:2.5 to 1:3 depending on entry precision
🧠 Concepts Applied:
Smart Money Concepts (SMC)
Break of Structure (BOS) & Change of Character (CHOCH)
Curve Manipulation / Compression
SR Flip (Support-Resistance Interchange)
QFL (Quasimodo Failure Level)
Trendline + FVG Confluence
Liquidity Pool Targeting
Volume Expansion Breakout Confirmation
🛎️ Watchlist Notes & Trade Expectations:
Expect short-term pullbacks into the 1.13000–1.13200 zone for liquidity re-tests.
Watch for reaction or sweep near 1.15500 — this is where short-term sellers may enter, and institutions may offload.
If price holds above the trendline and consolidates near the high, a continuation leg to even higher targets (1.16500) is possible — depending on macro conditions.
✅ Conclusion:
This EURUSD setup is a high-probability opportunity shaped by smart money behavior and deep structural context. The combination of the curve breakout, trendline strength, and liquidity targeting provides a clear roadmap for execution and management.
Use this analysis as a framework — always confirm with price action and risk management aligned with your personal strategy.
GBPAUD: Short Trading Opportunity
GBPAUD
- Classic bearish pattern
- Our team expects retracement
SUGGESTED TRADE:
Swing Trade
Sell GBPAUD
Entry - 2.1007
Stop - 2.1088
Take - 2.0850
Our Risk - 1%
Start protection of your profits from lower levels
Disclosure: I am part of Trade Nation's Influencer program and receive a monthly fee for using their TradingView charts in my analysis.
❤️ Please, support our work with like & comment! ❤️
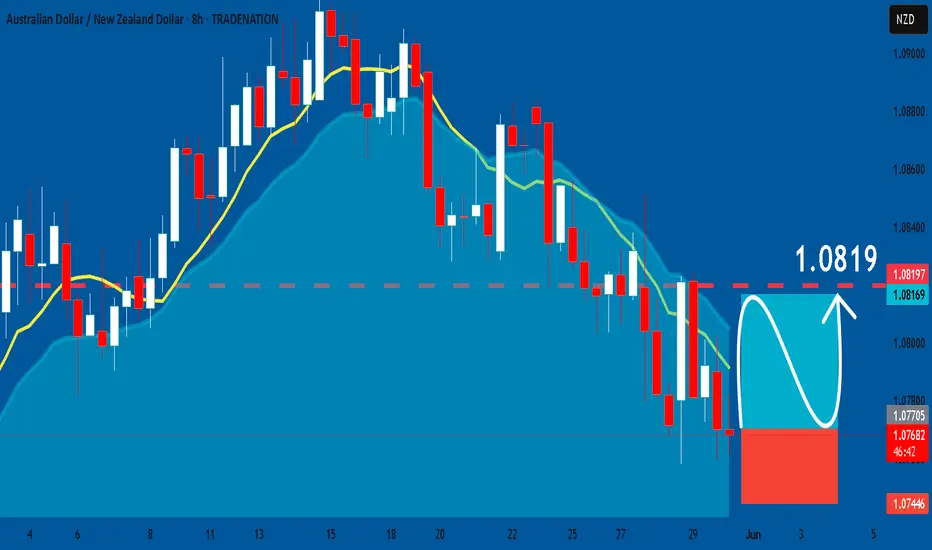
AUDNZD: Long Signal with Entry/SL/TP
AUDNZD
- Classic bullish formation
- Our team expects pullback
SUGGESTED TRADE:
Swing Trade
Long AUDNZD
Entry - 1.0769
Sl - 1.0744
Tp - 1.0819
Our Risk - 1%
Start protection of your profits from lower levels
Disclosure: I am part of Trade Nation's Influencer program and receive a monthly fee for using their TradingView charts in my analysis.
❤️ Please, support our work with like & comment! ❤️
GBPCHF: Bullish Continuation is Expected! Here is Why:
It is essential that we apply multitimeframe technical analysis and there is no better example of why that is the case than the current GBPCHF chart which, if analyzed properly, clearly points in the upward direction.
Disclosure: I am part of Trade Nation's Influencer program and receive a monthly fee for using their TradingView charts in my analysis.
❤️ Please, support our work with like & comment! ❤️

EURUSD: Bullish Forecast & Outlook
The analysis of the EURUSD chart clearly shows us that the pair is finally about to go up due to the rising pressure from the buyers.
Disclosure: I am part of Trade Nation's Influencer program and receive a monthly fee for using their TradingView charts in my analysis.
❤️ Please, support our work with like & comment! ❤️

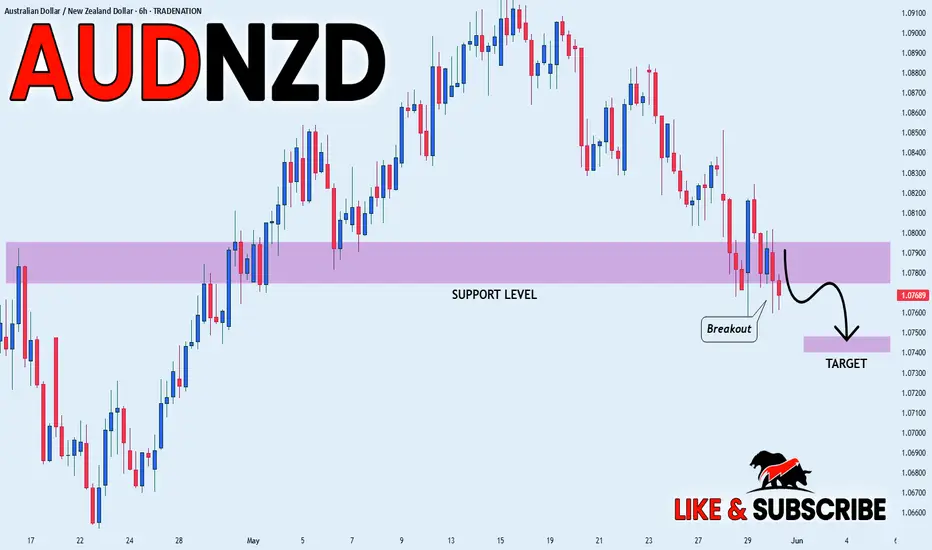
AUD_NZD BEARISH BREAKOUT|SHORT|
✅AUD_NZD made a bearish
Breakout of the key horizontal
Level of 1.0783 and the breakout
Is confirmed so we are locally
Bearish biased and we will be
Expecting a further bearish
Move down
SHORT🔥
✅Like and subscribe to never miss a new idea!✅
Disclosure: I am part of Trade Nation's Influencer program and receive a monthly fee for using their TradingView charts in my analysis.
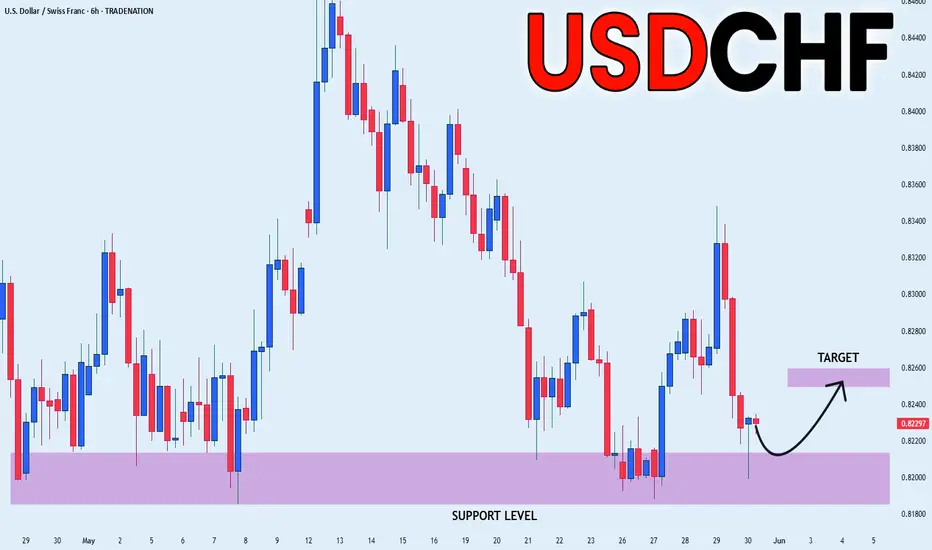
USD_CHF WILL GROW|LONG|
✅USD_CHF is falling down
And will soon retest
A horizontal demand level of 0.8190
So I think that we will see a rebound
And a move up from the level
Towards the target above at 0.8253
LONG🚀
✅Like and subscribe to never miss a new idea!✅
Disclosure: I am part of Trade Nation's Influencer program and receive a monthly fee for using their TradingView charts in my analysis.
KO 1D — A Diamond Not Yet Broken, But Already CrackingOn the daily chart of Coca-Cola, a classic diamond top structure is forming — not yet completed, but clearly visible. The market expanded its range in the initial stage, then began to compress into a tighter zone, creating the typical shape of a diamond. This isn’t a continuation pattern — it’s the setup phase for redistribution.
The key level sits at $68.50 — the base of the diamond. As long as this line holds, the pattern remains inactive. But current price behavior says more than enough: weakening momentum, falling volume, and a lack of aggressive follow-through on recent highs. This isn’t accumulation — it’s preparation.
Price is currently trading between the MA50 and MA200, signaling a neutral phase with downside risk. The moving averages are narrowing, but no crossover has occurred yet. That’s critical — the trend isn’t broken, but it’s clearly losing energy. If $68.50 gives way, the measured move from the pattern projects a decline toward $61.82.
From a fundamental standpoint, Coca-Cola remains stable — but uninspiring. Earnings met expectations, revenue was steady, and no major catalysts are visible. In this type of environment, technical structure often becomes the tool for institutional rotation — not because the story collapsed, but because the setup makes sense.
The edges of the diamond are in place. All that’s missing is the break. If the neckline fails, the downside scenario is already built — structurally and logically.
