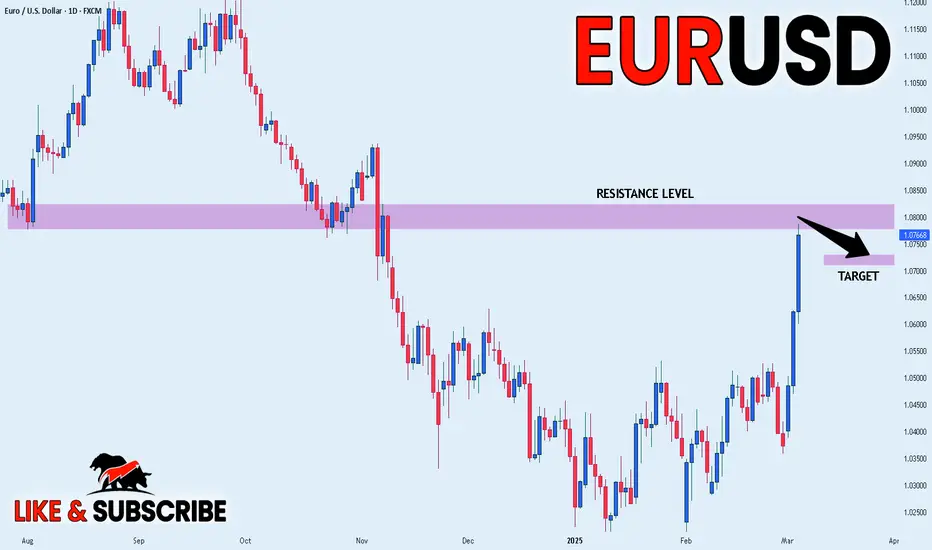
EUR_USD SHORT FROM RESISTANCE|
✅EUR_USD will be retesting a resistance level soon at 1.0824
From where I am expecting a bearish reaction
With the price going down but we need
To wait for a reversal pattern to form
Before entering the trade, so that we
Get a higher success probability of the trade
SHORT🔥
✅Like and subscribe to never miss a new idea!✅
Smartmoneyconcept
Mastering ICT Concepts: The Ultimate Trading Strategy GuideA lot of people are drawn to ICT trading concepts because they offer a deep understanding of how the markets truly work. With this guide, I want to explain the most popular ICT strategies in a simple and detailed way to help traders navigate these concepts effectively. The Inner Circle Trader (ICT) methodology offers a suite of trading strategies that delve into market mechanics, focusing on institutional behaviors and liquidity dynamics. This guide explores five prominent ICT strategies: Fair Value Gaps (FVG), Power of Three (PO3), Inversion Fair Value Gaps (IFVG) with Liquidity Sweeps, Breaker Blocks, and the Silver Bullet Strategy. Each section provides an in-depth explanation, trading approach, key considerations, and designated spots for illustrative images.
🔍 1. Fair Value Gaps (FVG)
A Fair Value Gap (FVG) represents a price imbalance created when the market moves rapidly in one direction, leaving a gap between consecutive candlesticks. This gap signals inefficient pricing, which the market tends to revisit later to balance liquidity. Understanding FVGs is crucial as they reveal hidden institutional footprints.
How to Trade:
Identification: Spot an FVG when there is a three-candlestick formation where the second candle creates a gap between the high of the first candle and the low of the third candle.
Retracement Expectation: The market typically seeks to fill these gaps as it rebalances price inefficiencies.
Entry Strategy: Wait for price to return to the gap and enter in the direction of the initial impulse. Confirm the trade with market structure shifts or other confluence factors.
Targets: Use previous highs/lows, liquidity zones, or equilibrium levels (50% of the FVG) as potential targets.
Key Considerations:
Timeframes: Higher timeframes like 1-hour, 4-hour, and daily yield more reliable signals.
Volume Confirmation: High volume during the initial impulse strengthens the likelihood of a retracement.
Partial Fills: The market may not always fill the entire gap.
⚡ 2. Power of Three (PO3)
The Power of Three (PO3) describes how institutional players manipulate price action through three key phases: Accumulation, Manipulation, and Distribution. This strategy highlights how smart money engineers liquidity and misleads retail traders before delivering the intended price move.
How to Trade:
Accumulation Phase: Identify consolidation zones where price ranges sideways, often before major sessions (London or New York).
Manipulation Phase: Wait for false breakouts or stop hunts where price temporarily breaks out from the range before reversing.
Distribution Phase: Enter the trade in the opposite direction of the manipulation, targeting the liquidity created during the false move.
Entry Confirmation:
Market structure shifts after the manipulation phase.
Bullish or bearish order blocks aligning with the intended direction.
Fair Value Gaps in the distribution phase.
Key Considerations:
Patience: This strategy often requires waiting several hours for all three phases to complete.
Liquidity Zones: Look for equal highs or lows near the range to anticipate the manipulation move.
Time Windows: PO3 often plays out during high-volume sessions.
🔄 3. Inversion Fair Value Gaps (IFVG) with Liquidity Sweeps
Inversion Fair Value Gaps (IFVG) are advanced price inefficiencies that act as dynamic support or resistance zones. When price fills a traditional FVG, that zone can later serve as an IFVG—particularly when aligned with liquidity sweeps.
How to Trade:
Identify Original FVG: Locate an FVG that has already been filled.
Liquidity Sweep Trigger: Wait for price to sweep liquidity above or below a key level.
Inversion Zone: When price returns to the previous FVG, treat it as a new support or resistance zone.
Entry Confirmation: Watch for market structure shifts or rejection candles at the IFVG.
Key Considerations:
Confluence Zones: Combine IFVG with liquidity sweeps and order blocks.
Patience: Wait for price action confirmation before entering.
Stop Placement: Place stops below the IFVG in bullish setups or above in bearish setups.
🧱 4. Breaker Blocks
Breaker Blocks are zones where previous support or resistance levels are invalidated by a liquidity sweep, only to become reversal zones. They represent areas where smart money accumulates orders before delivering price in the opposite direction.
How to Trade:
Identify Liquidity Sweeps: Spot areas where price breaks above or below a key high/low before reversing.
Breaker Formation: The candle that invalidates the liquidity sweep forms the Breaker Block.
Entry Strategy: Wait for price to retrace into the Breaker Block and confirm the trade with rejection candles or market structure shifts.
Targets: Previous liquidity pools or opposing order blocks.
Key Considerations:
Higher Timeframes: Use 1-hour or 4-hour charts for the best results.
Volume Analysis: High volume during the breaker formation strengthens the signal.
Risk Management: Place stops beyond the breaker boundary.
🎯 5. Silver Bullet Strategy
The Silver Bullet Strategy is a time-based model designed to capitalize on institutional price delivery patterns during specific one-hour windows. This strategy focuses on liquidity sweeps and Fair Value Gaps within these timeframes.
How to Trade:
Time Windows: Target these key one-hour sessions:
London Open: 03:00 AM – 04:00 AM EST
New York AM Session: 10:00 AM – 11:00 AM EST
New York PM Session: 02:00 PM – 03:00 PM EST
Identify Liquidity Zones: Look for equal highs/lows or session highs/lows.
Execute Trades: Enter trades when price sweeps liquidity and rejects from an FVG or Breaker Block within the Silver Bullet window.
Targets: Use opposing liquidity pools or session extremes.
Key Considerations:
Strict Timing: Only trade within the designated time windows.
Confluence Factors: Combine with market structure shifts and order blocks.
Risk Management: Place stops beyond liquidity sweep wicks.
Conclusion
Mastering ICT trading strategies requires patience, precision, and continuous practice. These five strategies—FVG, PO3, IFVG with Liquidity Sweeps, Breaker Blocks, and the Silver Bullet—provide a comprehensive framework to align with institutional price delivery. Use confluence factors and practice in demo environments before applying these methods in live markets.
Happy Trading!
Note: This guide is for educational purposes only and not financial advice.
__________________________________________
Thanks for your support!
If you found this guide helpful or learned something new, drop a like 👍 and leave a comment, I’d love to hear your thoughts! 🚀
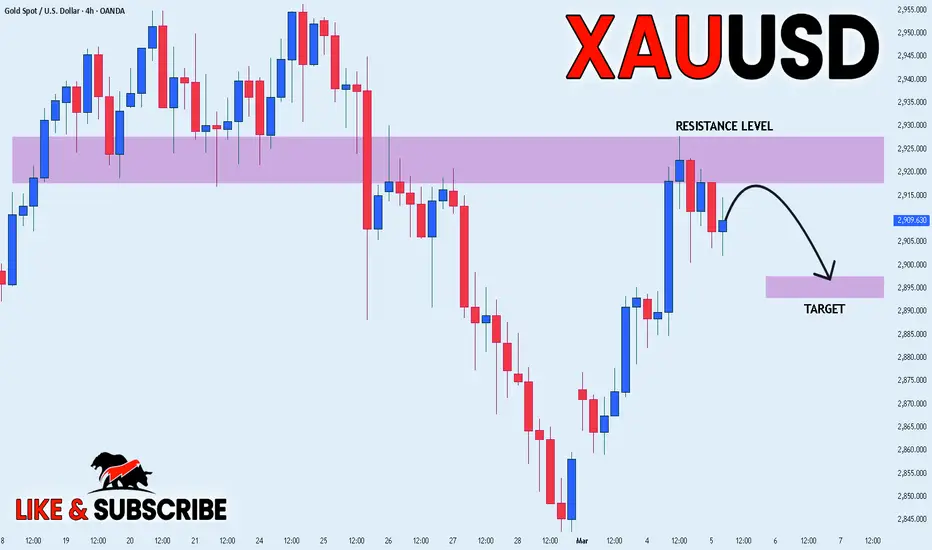
GOLD POTENTIAL SHORT|
✅GOLD has retested a key resistance level of 2927$
And as the price is already making a bearish pullback
A move down to retest the demand level below at 2895$ is likely
SHORT🔥
✅Like and subscribe to never miss a new idea!✅
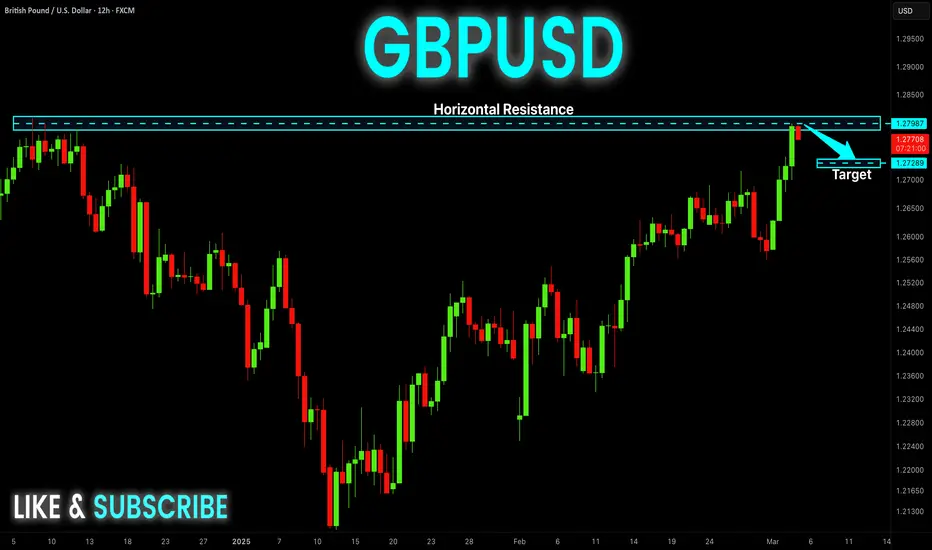
GBP-USD Will Fall! Sell!
Hello,Traders!
GBP-USD has hit horizontal
Resistance of 1.2812 and we
Are already seeing a local
Bearish reaction so a further
Move down is to be expected
Sell!
Comment and subscribe to help us grow!
Check out other forecasts below too!
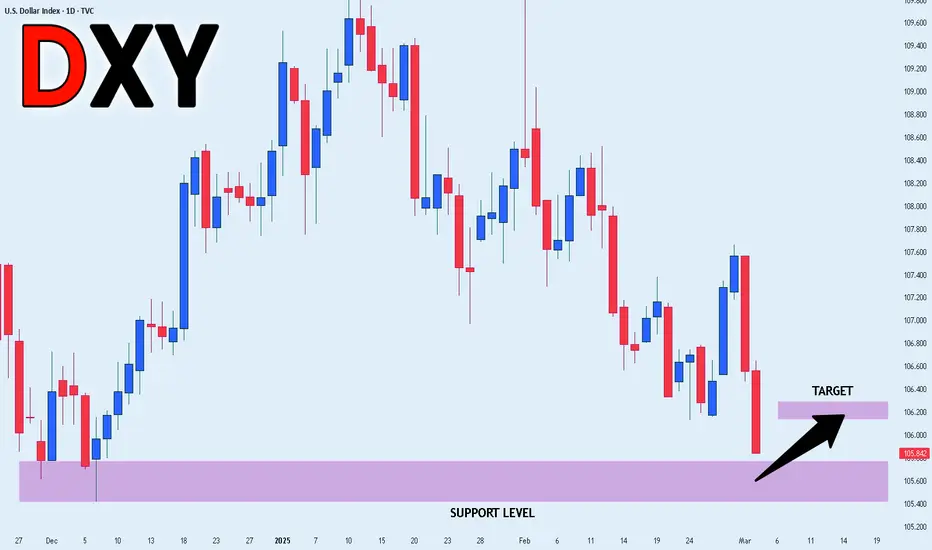
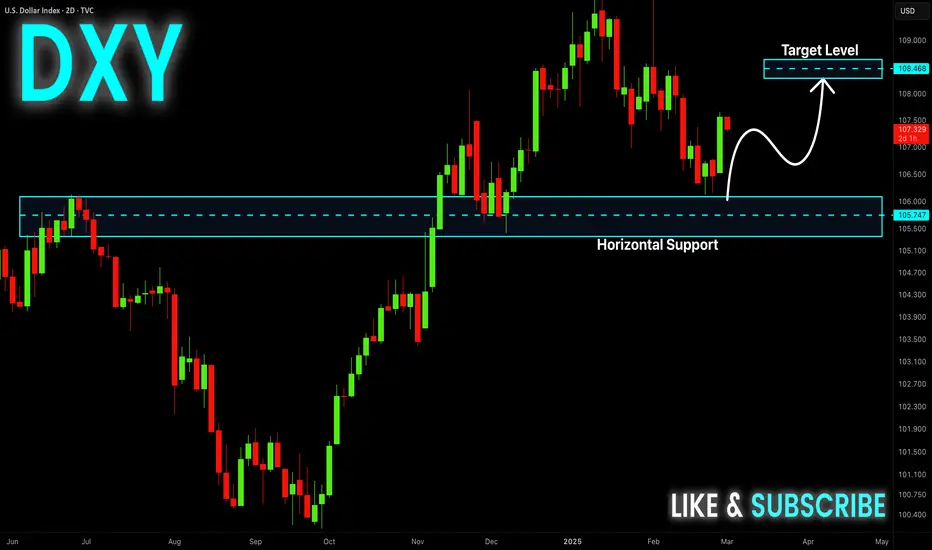
DXY BULLISH BIAS|LONG|
✅DXY is going down now
But a strong support level is ahead of 105.400
Thus I am expecting a rebound
And a move up towards the target of 106.200
LONG🚀
✅Like and subscribe to never miss a new idea!✅
DAX Support Ahead! Buy!
Hello,Traders!
DAX is fall down now
But will soon hit a horizontal
Support of 22,250 so after
The retest a local bullish
Rebound is to be expected
Buy!
Comment and subscribe to help us grow!
Check out other forecasts below too!

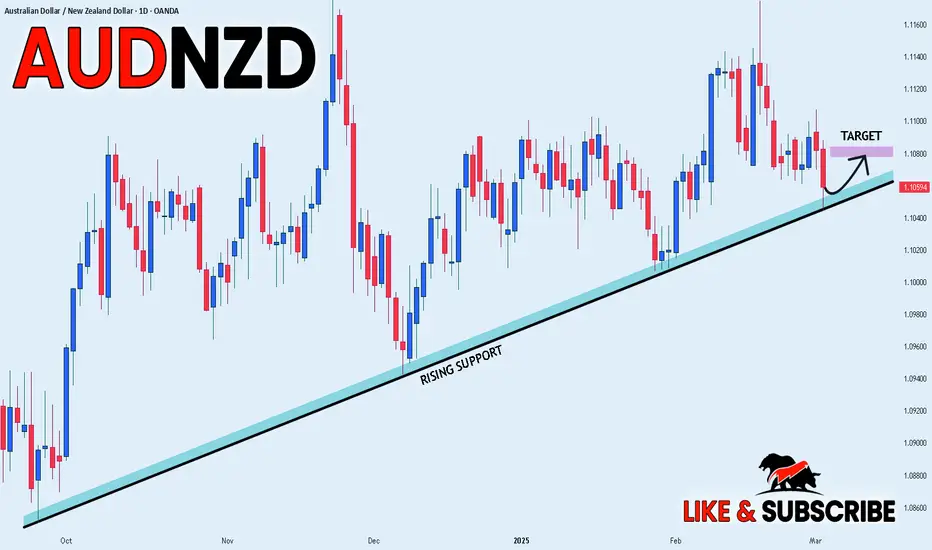
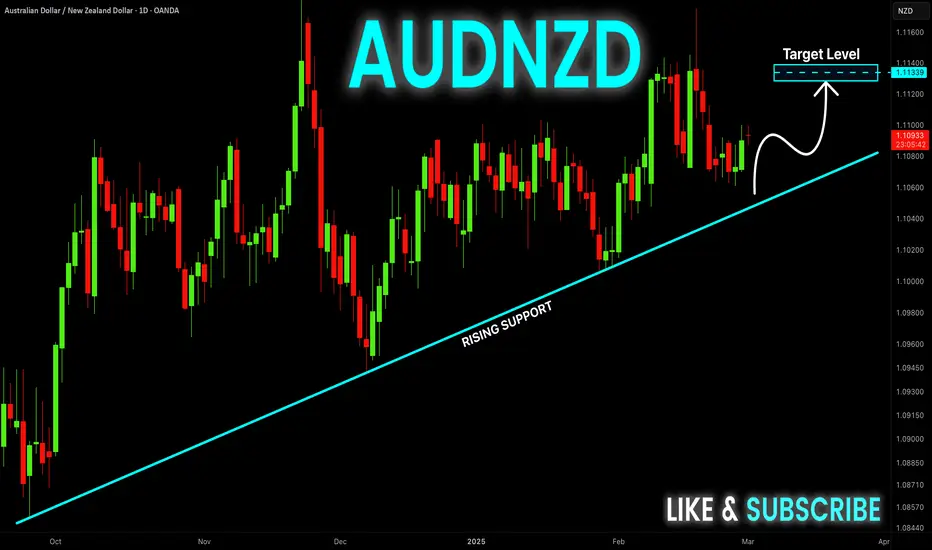
AUD_NZD RISKY LONG|
✅AUD_NZD is trading along the rising support
And as the pair will soon retest it
I am expecting the price to go up
To retest the supply levels above at 1.1080
LONG🚀
✅Like and subscribe to never miss a new idea!✅
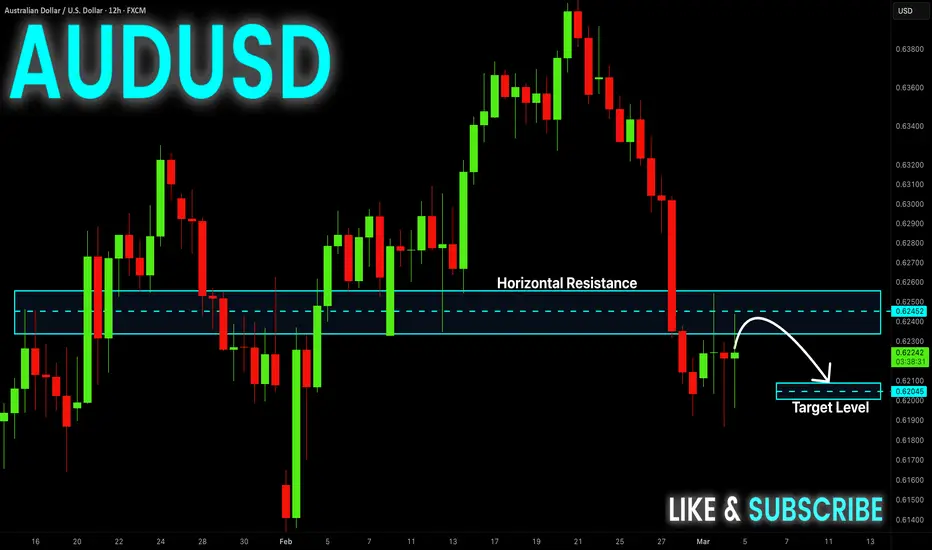
AUD-USD Local Short! Sell!
Hello,Traders!
AUD-USD broke the key
Horizontal level of 0.6250
And the pair is going up
Now to retest the new
Resistance from where
We will be expecting
A local move down
Sell!
Comment and subscribe to help us grow!
Check out other forecasts below too!
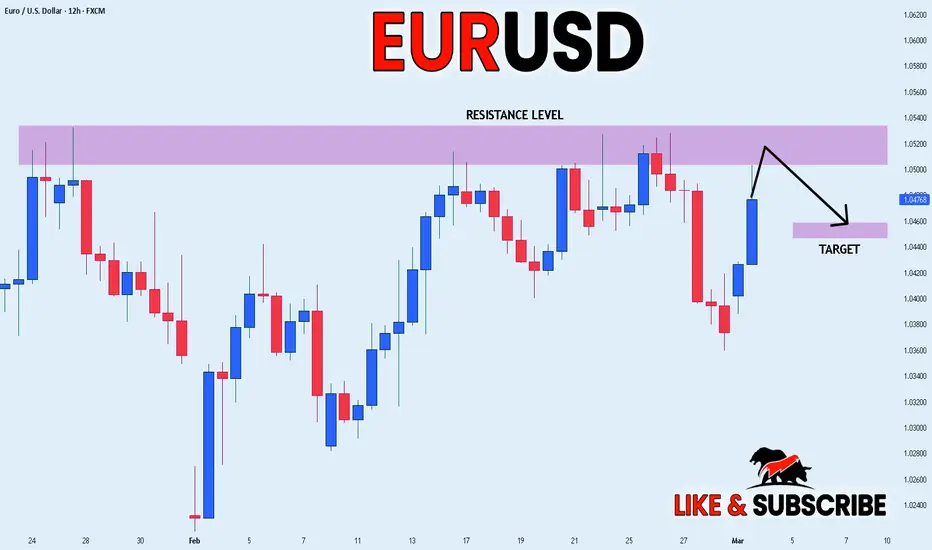
EUR_USD WILL GO DOWN|SHORT|
✅EUR_USD will soon retest a key resistance level of 1.0533
So I think that the pair will make a pullback
And go down to retest the demand level below at 1.0460
SHORT🔥
✅Like and subscribe to never miss a new idea!✅
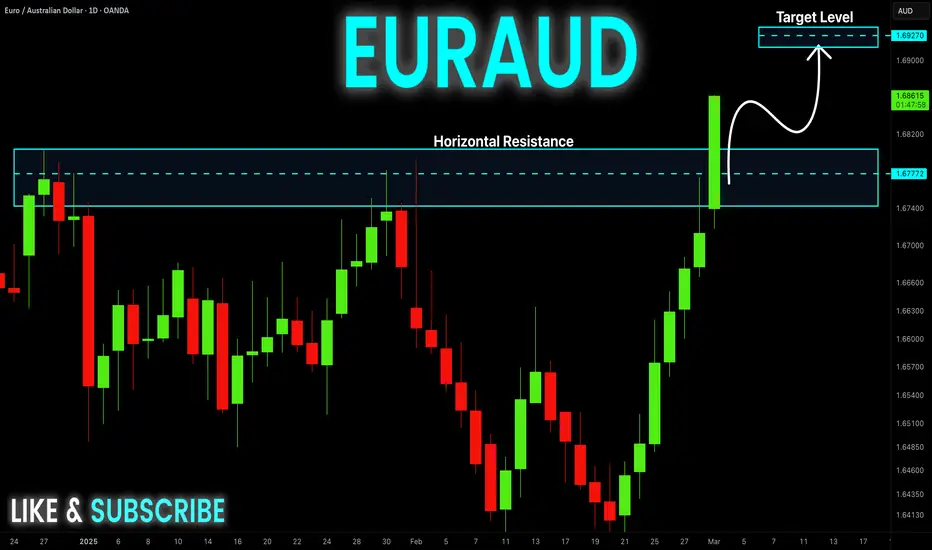
EUR-AUD Bullish Breakout! Buy!
Hello,Traders!
EUR-AUD is trading in an
Uptrend and the pair made
A bullish breakout of the
Key horizontal level of 1.6777
And the breakout is confirmed
So we will be expecting a
Further bullish move up
Buy!
Comment and subscribe to help us grow!
Check out other forecasts below too!
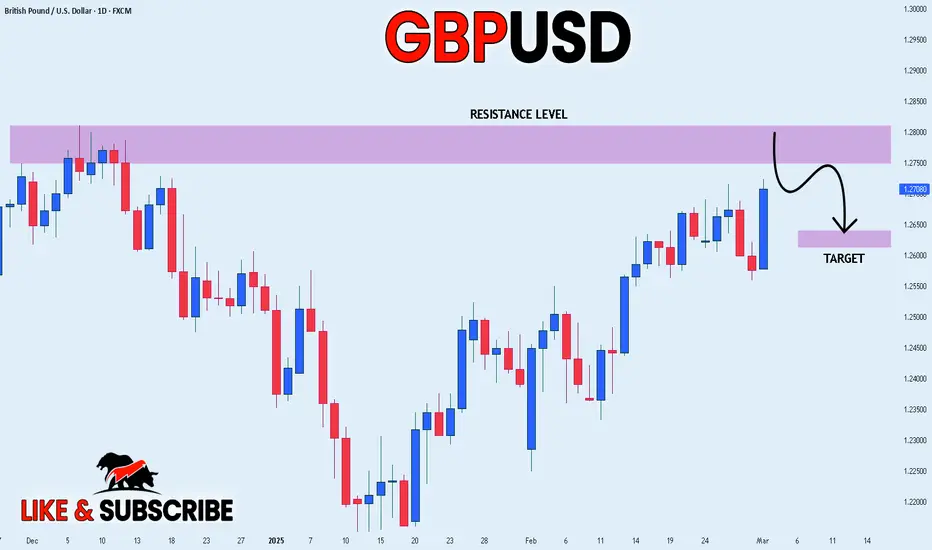
GBP_USD SWING SHORT|
✅EUR_USD is going up to retest a
Horizontal resistance of 1.2800
Which makes me locally bearish biased
And I think that we will see a pullback
And a move down from the level
Towards the target below at 1.2635
SHORT🔥
✅Like and subscribe to never miss a new idea!✅
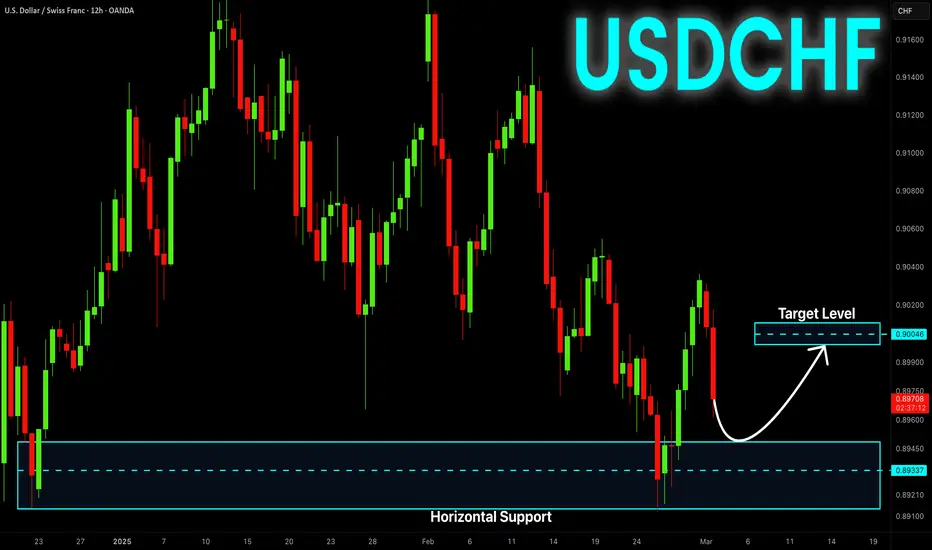
USD-CHF Support Ahead! Buy!
Hello,Traders!
USD-CHF is going down
But will soon hit a horizontal
Support level of 0.8921
From where we will be
Expecting a local rebound
And a move up
Buy!
Comment and subscribe to help us grow!
Check out other forecasts below too!
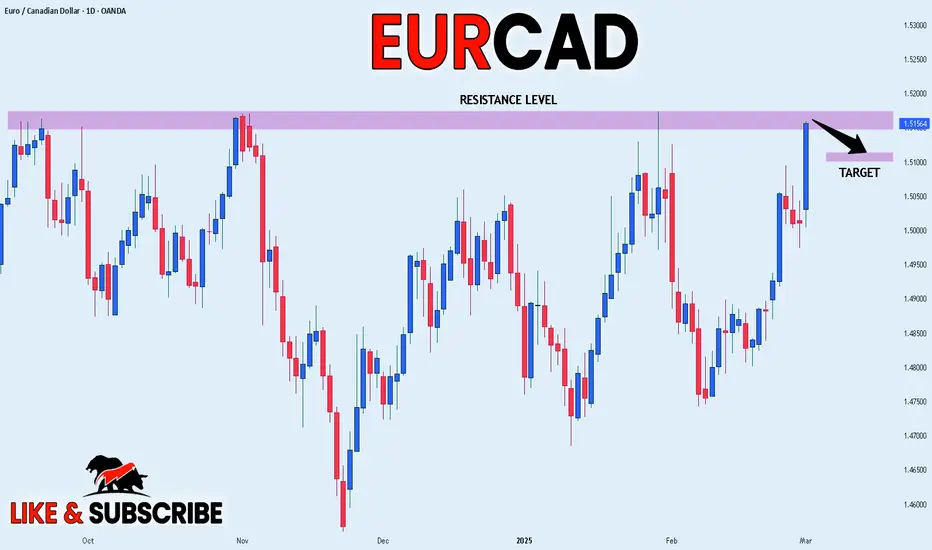
EUR_CAD RISKY SHORT|
✅EUR_CAD is set to retest a
Strong resistance level above at 1.5173
After trading in a local uptrend for some time
Which makes a bearish pullback a likely scenario
With the target being a local support below at 1.5113
SHORT🔥
✅Like and subscribe to never miss a new idea!✅
EUR-USD Short From Resistance! Sell!
Hello,Traders!
EUR-USD went up sharply
But will soon hit a horizontal
Resistance level of 1.0535
From where we will be
Expecting a local
Bearish correction
Sell!
Comment and subscribe to help us grow!
Check out other forecasts below too!

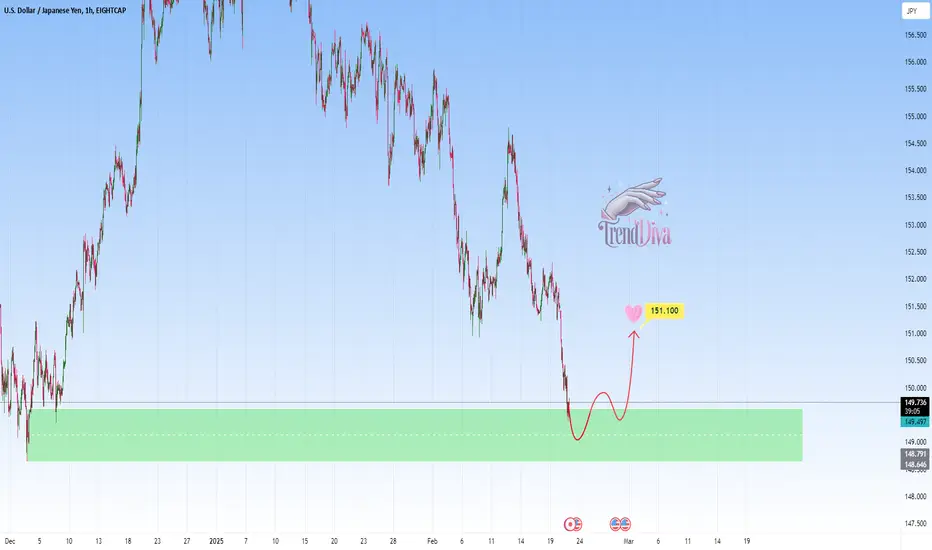
USDJPY - at potential Buy SetupOANDA:USDJPY is nearing a significant support area that has reversed bearish trends into bullish momentum. This support level aligns with prior price reactions and represents a strong foundation for potential upward moves.
If buyers confirm their presence with bullish price action, such as long lower wicks or bullish engulfing candles, I expect the price to go toward 151,100. Also, a break below this support could signal further bearish continuation.
Just my take on support and resistance zones—not financial advice. Always confirm your setups and trade with solid risk management!
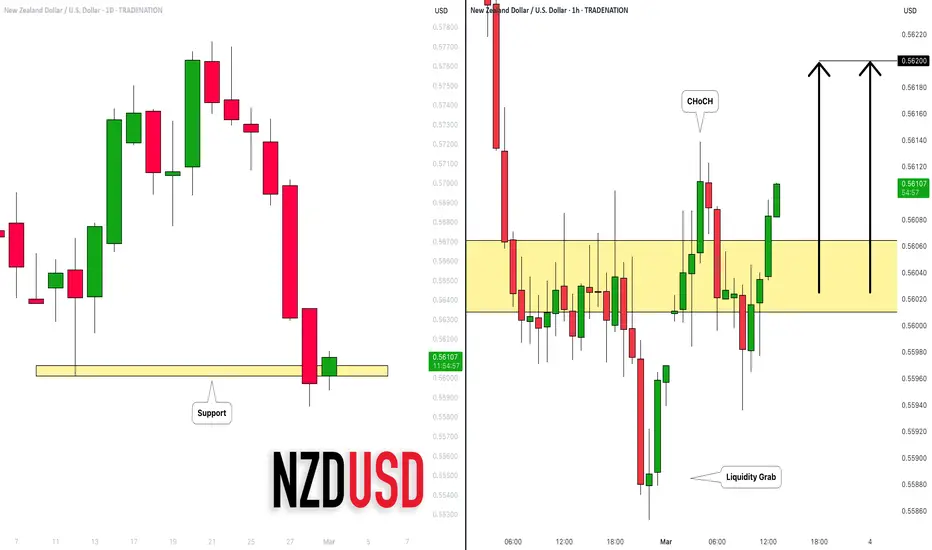
NZDUSD: Bullish Move After a Bearish Trap 🇳🇿🇺🇸
NZDUSD looks bullish after a false breakout of a key daliy support.
An intraday Change of Character on an hourly shows a strong local bullish sentiment.
I will expect a rise to 0.562
❤️Please, support my work with like, thank you!❤️
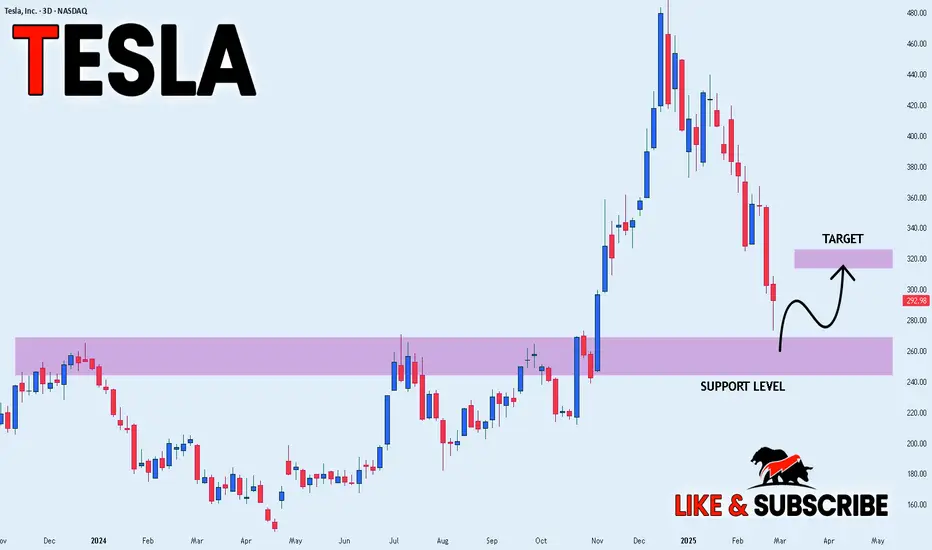
TESLA WILL GO UP|LONG|
✅TESLA fell again to retest the support of 245.00$
But it is a strong key level
So I think that there is a high chance
That we will see a bullish rebound and a move up
LONG🚀
✅Like and subscribe to never miss a new idea!✅
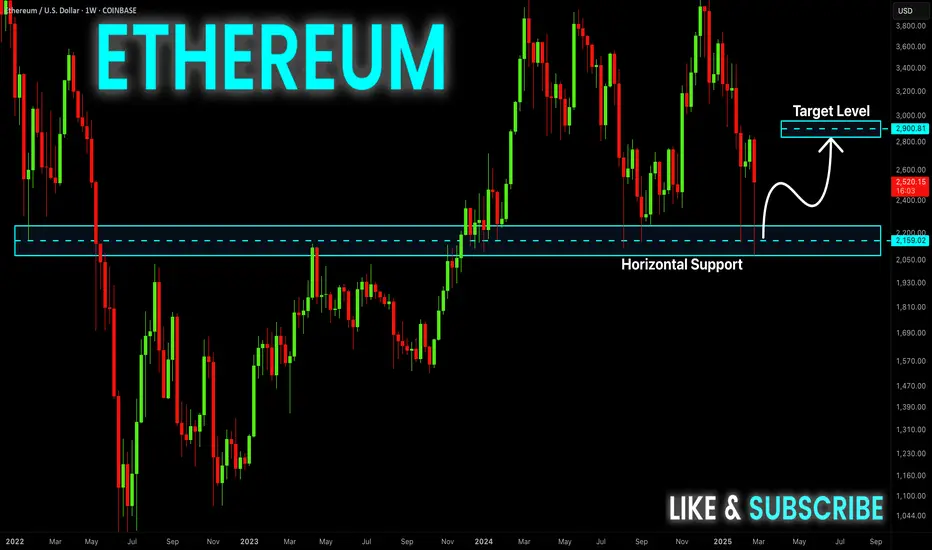
ETHEREUM Growth Ahead! Buy!
Hello,Traders!
ETHEREUM is trading in an
Uptrend and we are seeing
The coin make a strong rebound
From the horizontal support
Line of 2070$ so we are
Bullish biased and we
Will be expecting a further
Bullish move up
Buy!
Comment and subscribe to help us grow!
Check out other forecasts below too!
DXY Will Grow! Buy!
Hello,Traders!
DXY is trading in an uptrend
And the index is already making
A bullish rebound from the
Rising support line so we are
Bullish biased and we will be
Expecting a further bullish
Reaction and move up
Buy!
Comment and subscribe to help us grow!
Check out other forecasts below too!
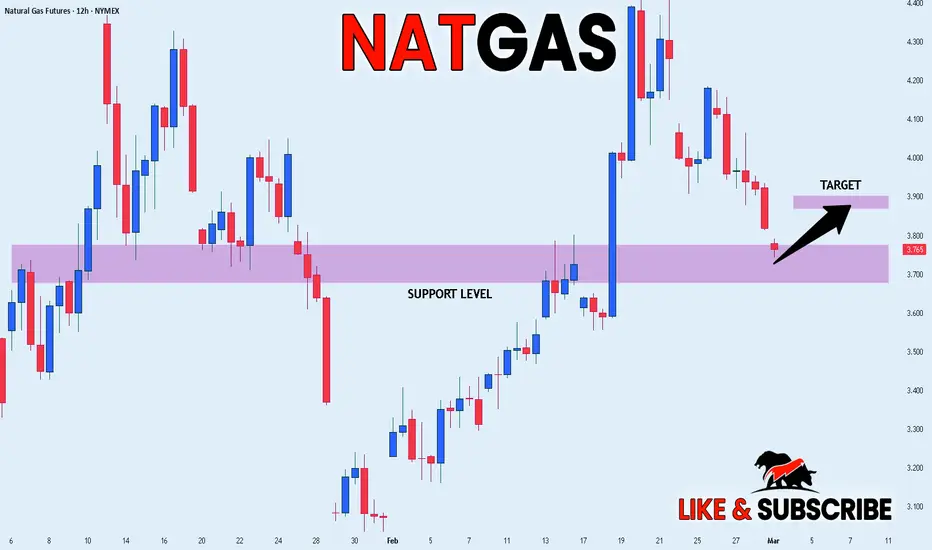
NATGAS POTENTIAL LONG|
✅NATGAS is about to retest a key structure level of 3.70$
Which implies a high likelihood of a move up
As some market participants will be taking profit from short positions
While others will find this price level to be good for buying
So as usual we will have a chance to ride the wave of a bullish correction
LONG🚀
✅Like and subscribe to never miss a new idea!✅
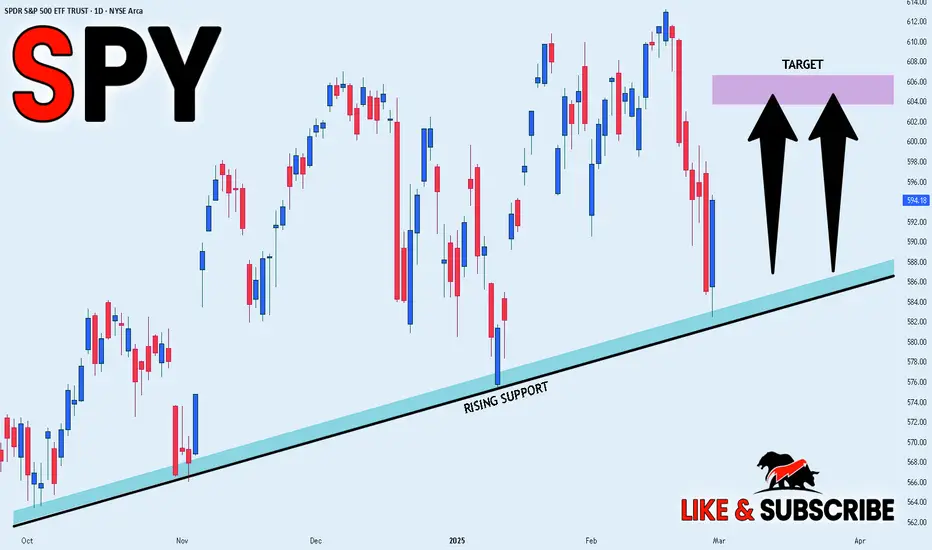
SPY GROWTH AHEAD|LONG|
✅SPY is trading along the rising support line
And as the pair is going up now
After the retest of the line
I am expecting the price to keep growing
To retest the supply levels above at 604.00$
LONG🚀
✅Like and subscribe to never miss a new idea!✅
AUD-NZD Bullish Bias! Buy!
Hello,Traders!
AUD-NZD is trading in an
Uptrend along the rising support
Line and we are seeing a bullish
Rebound already so we will be
Expecting a further move up
Buy!
Comment and subscribe to help us grow!
Check out other forecasts below too!
EURUSD 3-7 Mar 2025 W10 - Weekly Analysis- EU Rate - US NFP WeekThis is my Weekly analysis on EURUSD for 3-7 Mar 2025 W10 based on Smart Money Concept (SMC) which includes the following:
Market Sentiment
Weekly Chart Analysis
Daily Chart Analysis
4H Chart Analysis
Economic Events for the Week
Market Sentiment
The EUR/USD pair faces a slightly bearish bias this week, driven by key economic events, geopolitical risks, and trade uncertainties.
Key Events to Watch:
🔹 ECB Interest Rate Decision (March 6) – Markets expect a 25 bps rate cut to 2.50%. A dovish ECB could pressure the euro, while any hints of a pause may provide support.
🔹 U.S. Non-Farm Payrolls (March 7) – Forecast at +133K jobs, with unemployment steady at 4.0%. Weak data could weigh on the USD, while stronger payrolls and wage growth may boost it.
🔹 Trump’s Tariffs & Trade War Risks – New U.S. tariffs on Mexico, Canada, and China take effect March 4, with potential auto tariffs on Europe looming. These policies favor the dollar by driving risk-off sentiment.
🔹 Geopolitical Tensions – U.S.-Ukraine relations deteriorated after a public Oval Office clash between Trump and Zelenskiy. Further instability could impact investor confidence and increase safe-haven demand for the USD.
Trading Strategy:
✅ Bearish Scenario: A dovish ECB, strong U.S. NFP, and escalating trade risks could push EUR/USD down.
✅ Bullish Scenario: If the ECB signals a rate-cut pause and U.S. jobs data disappoint, EUR/USD may test 1.055–1.06 .
Overall, the fundamental backdrop leans in favor of the USD, but volatility is expected, especially around the ECB and NFP releases. Traders should stay alert to geopolitical developments and tariff announcements that may shift sentiment.
Weekly Chart Analysis
1️⃣
🔹Swing Bearish
🔹Internal Bearish (Pullback Phase)
🔹In Swing Discount
🔹Swing Continuation Phase (Pro Swing + Pro Internal)
2️⃣
🔹INT structure continuing bearish with iBOS following the Bearish Swing. (End of 2023 till end of 2024 was a pullback phase after the first bearish iBOS)
3️⃣
🔹After the bearish iBOS we expect a pullback, price tapped into Monthly Demand and the liquidity below Nov 2022 which is above the weekly demand formed with the initiation of the bearish iBOS pullback phase.
🔹Price made a bullish CHoCH which indicated that the liquidity was enough as per previous weeks analysis to initiate a pullback phase for the bearish iBOS.
🔹Price pulled back after the Bullish CHoCH to the Weekly Demand formed and showed reaction after volatile week.
🔹With the previous week Bearish close, weekly is consolidating between 1.05xx and 1.02xx
🔹Still the recent Bullish Fractal and Demand holding but failed to break the high (1.0533) so there is a probability to target the low 1.0285/10 and could extend to continue the Bearish INT Structure with iBOS.
Daily Chart Analysis
1️⃣
🔹Swing Bearish
🔹INT Bearish
🔹Swing Continuation Phase (Pro Swing + Pro Internal)
2️⃣
🔹Following the Bearish Swing BOS, INT Structure continuing bearish tapping the weekly demand zone.
3️⃣
🔹After the failure to close below the Weak INT Low, price continued bullish sweeping the liquidity above Dec 30 and mitigating a Daily supply zone within the INT Structure Premium Zone.
🔹With the mitigation of the Daily supply, price created a Bearish CHoCH signaling the end of the Pullback Phase of the INT structure and the start of the Bearish move targeting the Weak INT Low.
🔹Price failed for the 2nd time to close below the Weak INT Low after mitigating the Daily Demand formed from the failure to close below the Weak INT Low which triggered aggressive Bullish reaction and mitigating the Daily Supply Zone formed from the recent Bearish CHoCH.
🔹After Supply mitigation, price continued Bearish following the Bearish INT Structure continuation phase.
🔹With the Weekly is consolidating the Daily consolidation range showing that we are failing to continue Bullish and with the recent Bearish CHoCH we are back to the Bearish INT Structure continuation and we may target the Weak INT Low (At least 1.0285).
🔹Price could pullback to the recent Daily Supply before continuing down.
🔹Expectation is set to Bearish with cautious of the Liq. built above 1.05333 and the range we are in.
4H Chart Analysis
1️⃣
🔹Swing Bullish (Reached Swing Extreme Demand)
🔹INT Bearish (Adjusted my INT structure to align with the previous Bullish move)
🔹Complex Swing INT Structure
2️⃣
🔹As the Swing is Bullish, expectations were set to continue Bullish targeting the Weak Swing High and create a Bullish BOS after the Deep Pullback to the Swing Demand.
🔹During the Swing Bullish Continuation after the Deep Pullback, INT Structure kept holding Bullish to fulfill the Bullish continuation phase.
🔹With price reaching the Swing Extreme Premium zone and the expectation of breaking the Weak Swing High, price failed 2 times and with the 3rd attempt it created a Bearish iBOS. This indicated that the Swing INT structure is Complex and the Daily/Weekly TFs are still in play.
3️⃣
🔹After the Bearish iBOS, we expect PB, there is no clear POI for price to initiate PB except the Liq. at 1.03730 which was swept on Friday and 1.03173 before mitigating the last clear 4H Demand.
🔹With the recent Bearish iBOS, the PB could start at anytime. The Liq. swept from 1.0373 could provide that PB otherwise we will continue Bearish till the clear 4H Demand (Which I doubt that it could provide the continuation) but with LTF shifting Bullish, we can follow that.
Economic Events for the Week
