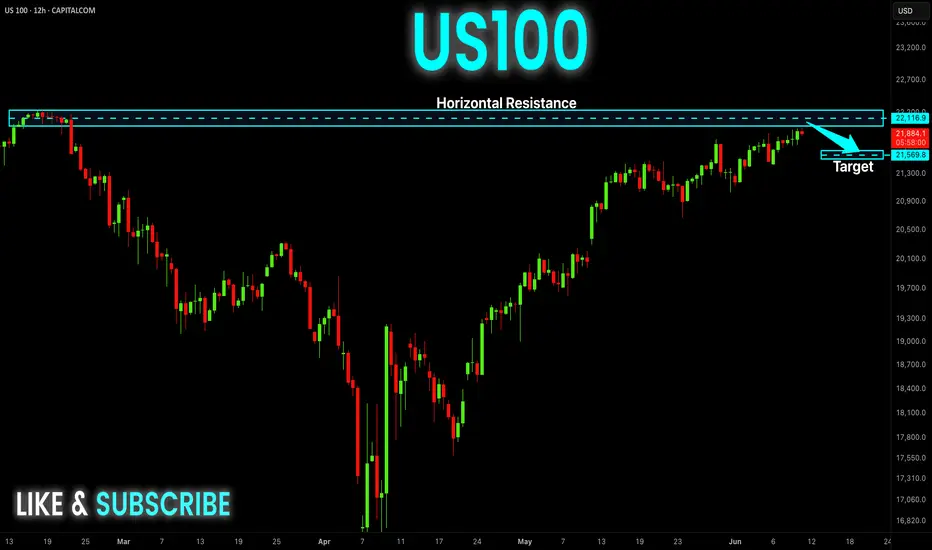
US100 Local Short! Sell!
Hello,Traders!
US100 keeps growing but
The index will soon hit a
Horizontal resistance
Of 22,243 so after the
Retest we will be expecting
A local pullback and a
Local move down
Sell!
Comment and subscribe to help us grow!
Check out other forecasts below too!
Disclosure: I am part of Trade Nation's Influencer program and receive a monthly fee for using their TradingView charts in my analysis.
Smartmoneyconcept
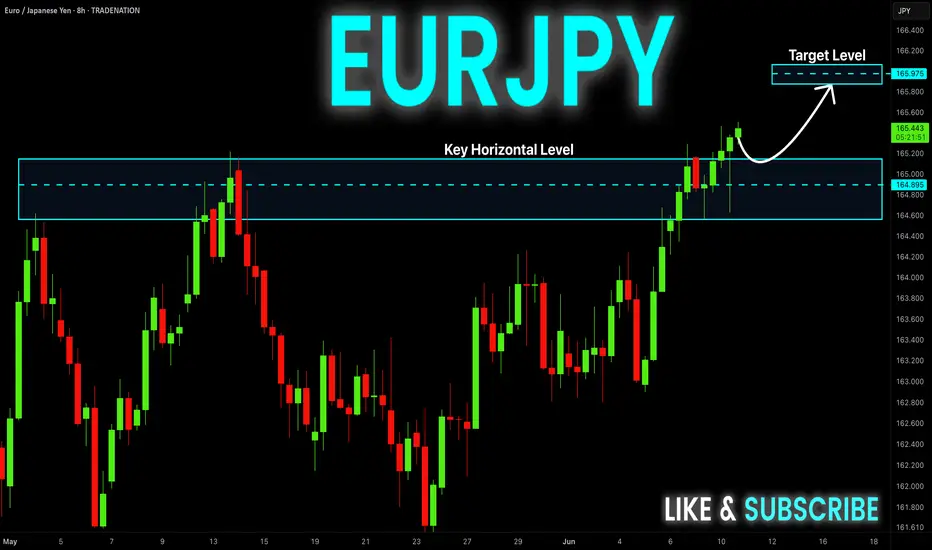
EUR-JPY Bullish Breakout! Buy!
Hello,Traders!
EUR-JPY is trading in an
Uptrend an the pair made a
Bullish breakout of the key
Horizontal level of 165.000
Which is confirmed so after
A a potential pullback we will
Be expecting a further
Bullish continuation
Buy!
Comment and subscribe to help us grow!
Check out other forecasts below too!
Disclosure: I am part of Trade Nation's Influencer program and receive a monthly fee for using their TradingView charts in my analysis.
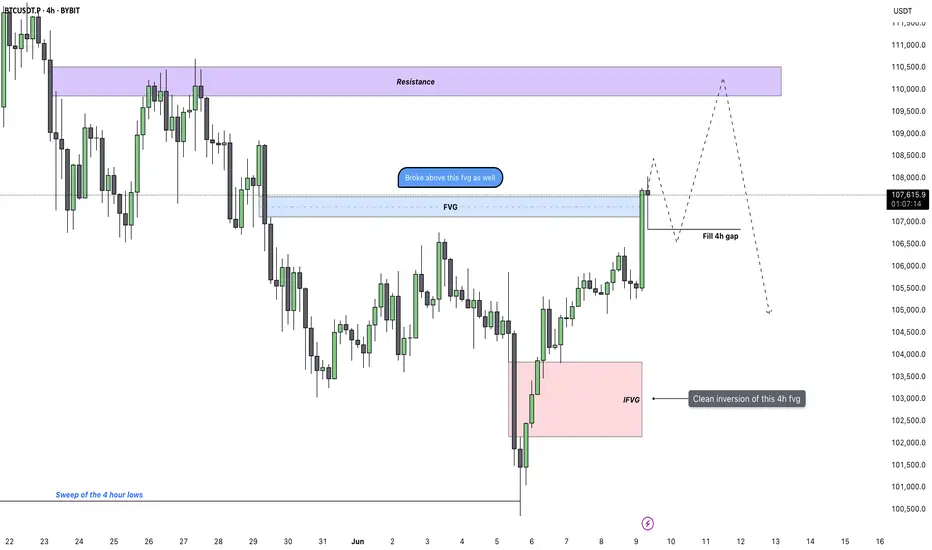
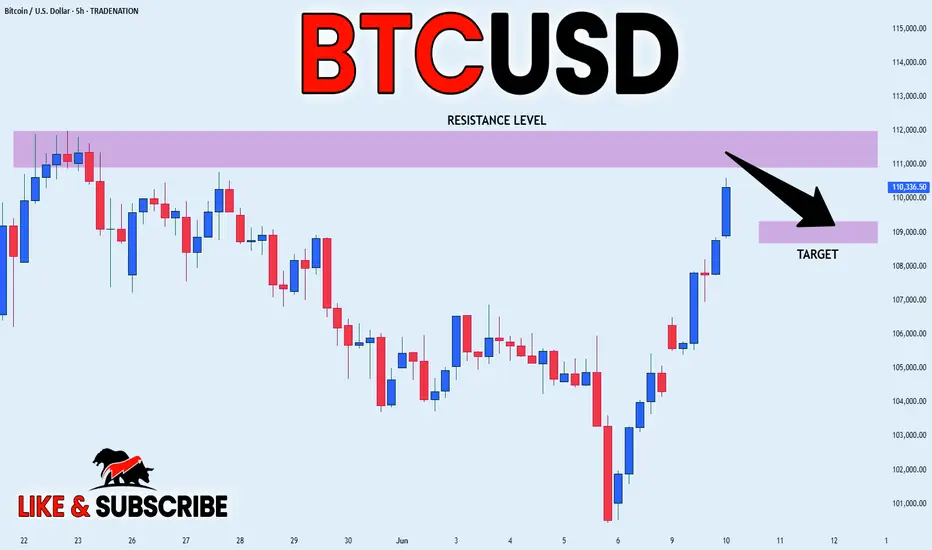
Bitcoin - Bulls in Control: Aiming For $110kBitcoin has just confirmed a strong bullish breakout after consolidating beneath a prior fair value gap. The market not only broke out of that zone cleanly but did so with conviction, creating a new inversion fair value gap (IFVG) along the way. This type of structure often indicates a shift in sentiment, especially when paired with increasing volume and impulsive candles.
Fair Value Gap Break and Continuation Context
Following the breakout, price surged straight through another 4H FVG overhead, flipping it with strength and no hesitation. That kind of move shows clear intent. The market didn't pause or stall at resistance, which increases the probability that the same pattern could play out again, clean break, shallow pullback, and continuation. The breakout level now holds as short-term support.
Near-Term Expectations – FVG Fill Before Higher
With this latest 4H candle close, I’m now expecting a short pullback to fill the newly created 4H FVG below. This would provide the market with the fuel it needs to continue higher without leaving inefficient price action behind. The structure is setting up a classic breakout-fill-continue sequence, and the next key objective sits just below a clear resistance zone overhead.
Conclusion
Bitcoin broke out of a compression zone, formed an IFVG, and followed up with a strong push through the next fair value gap. I’m expecting a controlled retracement to fill the new 4H imbalance, after which price could continue pushing toward the major resistance area. The momentum is clean and structured—until that changes, continuation remains the more likely path.
___________________________________
Thanks for your support!
If you found this idea helpful or learned something new, drop a like 👍 and leave a comment, I’d love to hear your thoughts! 🚀
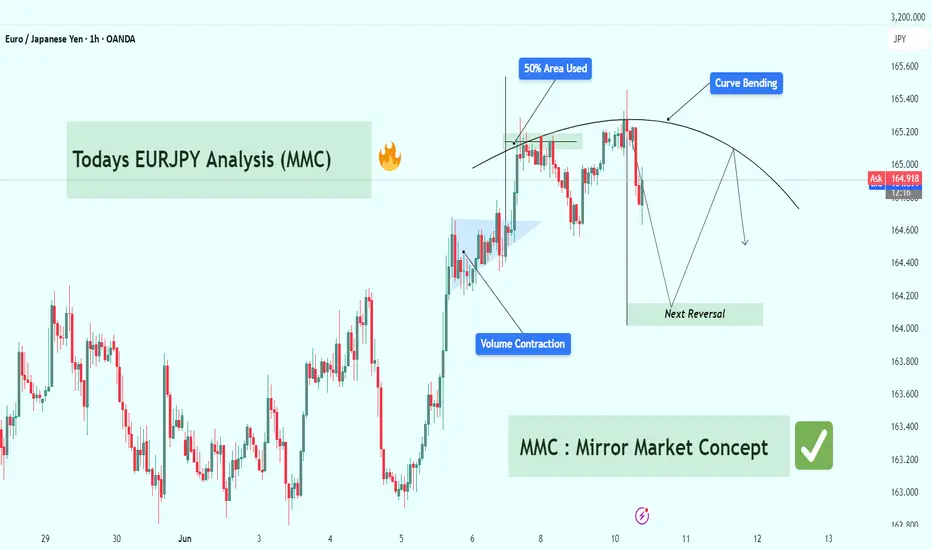
EURJPY Technical Breakdown (MMC Strategy) : Target Zone 🧠 Concept Focus: MMC – Mirror Market Concept
The Mirror Market Concept (MMC) helps identify pattern inversions, price reflection zones, and structural symmetry that hint at upcoming market turns. This chart reflects a curve-based reversal logic rooted in smart money behavior, volume analysis, and pattern exhaustion.
📊 Technical Structure Breakdown
🔹 1. Volume Contraction + Breakout (June 6–7)
Early signs of bullish pressure were detected with volume contraction, forming a tight range wedge/triangle.
This is often a liquidity trap where weak hands sell into strength.
Smart money absorbed sell-side liquidity before impulsively breaking out.
This is a common MMC move: contract > trap > expand.
🔹 2. 50% Area Used – Smart Money Trap (June 9)
After the breakout, price tapped into the 50% equilibrium zone of the previous major move.
This level often acts as a liquidity sweep zone, ideal for smart money to unload or build counter positions.
The rejection wick here confirms that institutional traders reacted at this level.
🔹 3. Curve Bending Pattern – Exhaustion in Play
The market has now entered a curve bending phase, visible with the arching price movement.
This signifies momentum exhaustion, where bullish attempts get weaker.
Think of this curve like a mirror ceiling — as each high gets tapped, it bends, showing the market can't sustain higher levels.
🔹 4. Next Reversal Zone (Projected Target: ~164.150–164.200)
Based on MMC symmetry and previous demand zones, the area highlighted as Next Reversal is a key structure zone.
This is where we expect price to react — either bounce (for buyers) or break (for continuation shorts).
A clean bounce here could mirror the earlier pattern in reverse, hence the Mirror Market Concept.
🔁 Summary of Market Psychology
🧲 Volume contraction signals manipulation.
🎯 50% zone rejection shows trap completion.
🪞 Curve bending shows buyers losing strength.
🔻 Price likely to drop into the reversal zone, completing the mirror leg.
🧩 What Traders Should Watch
Indicator/Zone Notes
50% Area Used Smart Money Exit or Entry Trap
Curve Bending Reversal Geometry (Momentum Exhaustion)
Next Reversal Zone Smart Money Demand Zone (~164.150)
Break Below 164.100 Confirms deeper bearish continuation
🎯 Trading Strategy Outlook
🔍 Short Bias: Look for confirmation (e.g., bearish engulfing, BOS on lower TFs) to enter shorts below curve zone.
🛑 Invalidation Level: Clean breakout above 165.500 would invalidate the mirror structure and shift to continuation long.
🎣 Reversal Scouting : If price respects the Next Reversal Zone, there could be a potential long scalp back into mid-range.
🧠 Educational Note: MMC in Action
The Mirror Market Concept is powerful for intraday trading. It uses pattern reflection, liquidity logic, and price symmetry to forecast reversals before typical indicators catch up. If mastered, this concept can give early reversal entries and trap avoidance.
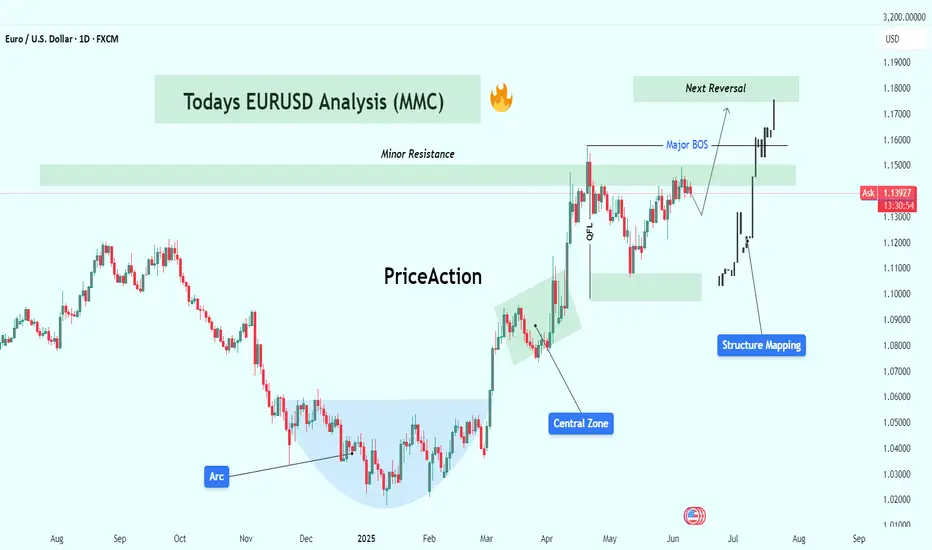
EURUSD Analysis (MMC Strategy) : Structure Mapping + Target🧠 Overview
This analysis is based on the MMC (Market Mapping Concept), combining smart money principles, structure mapping, and price behavior analysis. EUR/USD has been showing strong bullish activity over the past few months, but we are now approaching a critical decision zone. Let’s break it all down.
🔹 1. Arc Structure – Accumulation Phase (Dec 2024 – Feb 2025)
The chart starts with a well-defined Arc formation, signaling accumulation by large players.
Price showed a series of higher lows within the arc, compressing volatility.
This is where smart money quietly loads positions before pushing price.
Key Insight: This arc often precedes an impulsive breakout, as seen next.
🔹 2. Central Zone Breakout (Feb – Mar 2025)
The price exploded out of the arc, breaking through the central compression area.
Marked as the Central Zone, this acted as both support and a launchpad.
This phase included imbalance filling, reaccumulation, and clean price action.
Observation: Notice the aggressive bullish candles—clear indication of institutional interest.
🔹 3. Structure Mapping & QFL Zone (April 2025)
A classic QFL (Quick Flip Level) was formed after the initial rally.
Price pulled back into a structure support zone, respected it cleanly, and bounced back.
This gave a textbook smart money entry.
Structure Mapping highlights how each leg of the trend is forming based on supply/demand reaction.
🔹 4. Major BOS – Break of Structure (May 2025)
Price broke the previous swing high, giving us a Major Break of Structure.
This BOS confirms a change in character (CHOCH) from ranging to trending.
After BOS, the market retested the breakout zone—providing a second ideal long entry for continuation traders.
🔹 5. Minor Resistance Zone (Current Price)
Currently, price is testing a Minor Resistance zone around 1.1400–1.1450.
This level acted as resistance earlier and may slow price down temporarily.
However, there’s still room for bullish continuation unless reversal patterns emerge.
Key Watch Point: If price shows weakness here (e.g., rejection wicks, bearish engulfing), short-term retracement may follow.
🔹 6. Next Reversal Zone (Projected Target: 1.1700–1.1800)
The green box above marks the Next Reversal Zone, based on historical supply, Fibonacci extension levels, and structure analysis.
Expect this area to act as strong resistance unless momentum is very strong.
This is a potential TP zone for long traders or an area to scout for short opportunities if reversal signals appear (divergence, order block rejection, liquidity grab).
📌 Key Levels
Zone Price Range Role
Central Zone 1.0800–1.1000 Support/Accumulation
Minor Resistance 1.1400–1.1450 Immediate Hurdle
Next Reversal Zone 1.1700–1.1800 Target / Short Setup
QFL Zone 1.1100–1.1200 Smart Money Entry Point
🧠 Strategy Outlook
✅ Bullish Bias: Structure is clearly bullish. Buyers are in control.
🕵️♂️ Watch for Reaction at Minor Resistance – a clean break = continuation, rejection = short-term pullback.
BITCOIN LOCALLY OVERBOUGHT|SHORT|
✅BITCOIN will soon retest a
Key resistance level of 112,000$
Which is an all-time-high
And the coin is locally overbought
So I think that the price will make a pullback
And go down to retest the demand level below at 109,000$
SHORT🔥
✅Like and subscribe to never miss a new idea!✅
Disclosure: I am part of Trade Nation's Influencer program and receive a monthly fee for using their TradingView charts in my analysis.
EUR-AUD Potential Long! Buy!
Hello,Traders!
EUR-AUD made a retest
Of the horizontal support
Around 1.7480 and we are
Already seeing a bullish rebound
So a further move up
Is to be expected
Buy!
Comment and subscribe to help us grow!
Check out other forecasts below too!
Disclosure: I am part of Trade Nation's Influencer program and receive a monthly fee for using their TradingView charts in my analysis.

EUR_NZD WILL GO UP|LONG|
✅EUR_NZD fell down sharply
But a strong support level was hit at 1.8820
Thus as a rebound is already happening
A move up towards the target of 1.8923 shall follow
LONG🚀
✅Like and subscribe to never miss a new idea!✅
Disclosure: I am part of Trade Nation's Influencer program and receive a monthly fee for using their TradingView charts in my analysis.

EUR-CHF Local Short! Sell!
Hello,Traders!
EUR-CHF is making a rebound
And will soon hit a horizontal
Resistance level of 0.9400
From where we will be
Expecting a local bearish
Pullback and a move down
Sell!
Comment and subscribe to help us grow!
Check out other forecasts below too!
Disclosure: I am part of Trade Nation's Influencer program and receive a monthly fee for using their TradingView charts in my analysis.

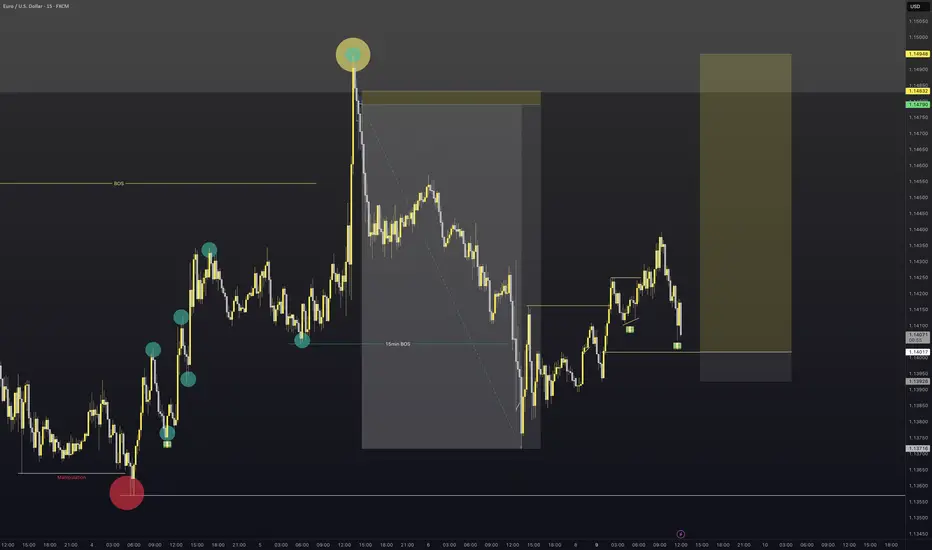
EURUSD - Long 15min orderflow changeI have set a pending order on EURUSD based on the structure shift and liquidity left behind to the left and now the right.
Entry order placed. lets see what happens on this position.
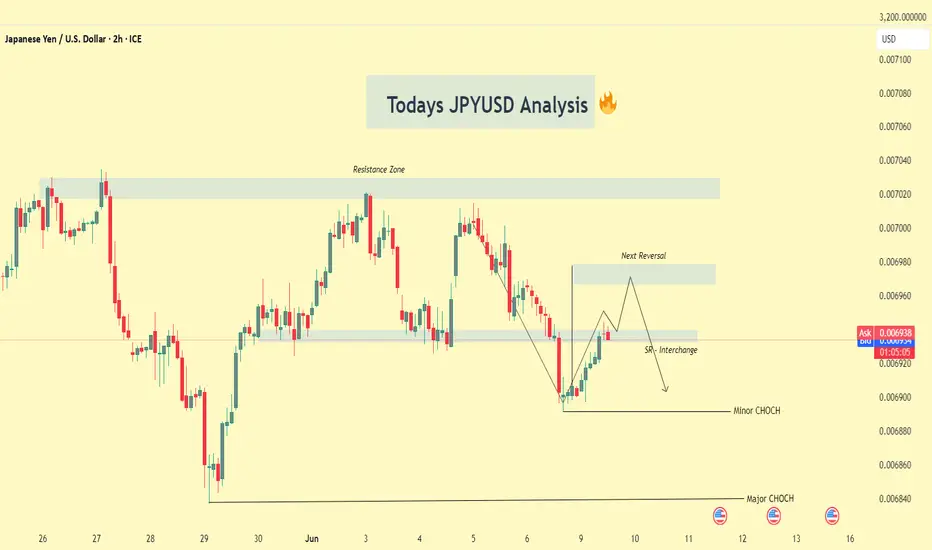
JPYUSD Smart Money VIP Analysis – Eyeing High-Probability Target📈 Market Context:
The JPYUSD (Japanese Yen vs. US Dollar) is currently navigating through a critical structure phase where price is reacting to previously established institutional zones. Recent price movements reveal a clean and structured setup — one that aligns perfectly with Smart Money Concepts (SMC) and CHoCH (Change of Character) theory.
This 2H chart provides a roadmap for anticipating the next high-probability reversal, giving traders an edge in both short-term scalps and mid-term swing trades.
🔍 In-Depth Chart Analysis:
🧱 Resistance Zone (0.007020–0.007040):
This area has been tested multiple times in the past and acted as a strong supply zone. Institutional orders have previously caused significant bearish pressure from this level. Unless a strong bullish breakout occurs with volume, this zone is likely to hold again.
🔁 Next Reversal Zone (0.006975–0.006985):
Price is currently climbing from the SR Interchange Zone, heading toward this marked reversal area. Here's why this zone matters:
Confluence of past resistance and imbalance
Potential liquidity sweep above minor highs
Perfect setup for a bearish reaction to form a lower high
Traders should watch for signs of weak bullish candles, wicks, or a bearish engulfing here.
🔄 SR Interchange (Support-Resistance Flip):
This level held firm, showing buyer interest after a previous structure break. It signals a healthy correction phase — a typical SMC signature before larger moves occur. The market is offering a retracement opportunity.
🟡 CHoCH Zones:
Minor CHoCH (0.006900): A break and close below this level would invalidate bullish correction and confirm the shift in momentum.
Major CHoCH (0.006840): The final confirmation of bearish dominance. A breach here opens the door for new lows, targeting long-term support areas.
⚔️ Smart Money Playbook:
Current Move: Price is in bullish retracement from previous demand zone
Watch Zone: 0.006975–0.006985 (Potential Smart Money sell zone)
Reaction Setup:
Bearish structure forms (e.g., M pattern, liquidity sweep, bearish engulfing)
Price breaks minor CHoCH
Sell Entry: After confirmation, with stops above reversal zone
TP1: SR Interchange level
TP2: Major CHoCH zone
📅 Fundamental Triggers Ahead:
Watch for upcoming USD economic data (CPI, PPI, interest rate decisions) between June 11–14, which could act as catalysts for volatility and confirm technical setups.
🧠 Educational Note:
This setup is a classic example of market structure shift, liquidity engineering, and order block theory — concepts used by banks and smart money traders. Retail traders often get trapped on the wrong side of these zones. Your edge lies in anticipating the trap, not reacting to it.
🎯 Conclusion:
JPYUSD is offering a textbook Smart Money setup. The current retracement gives an opportunity to position early into a likely bearish continuation, provided structure confirms at the next reversal zone. Patience, discipline, and precise timing will be key to capitalizing on this move.
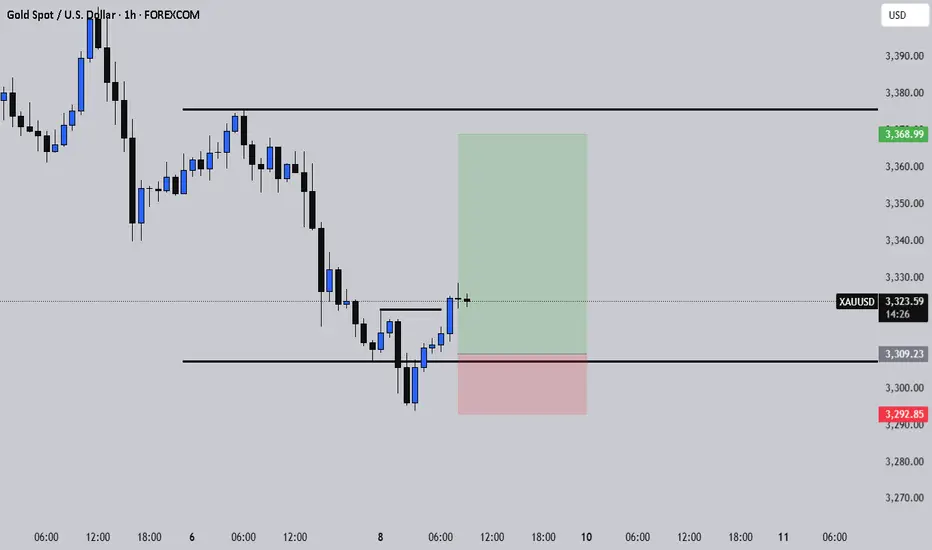
Did Gold Just Sweep the Low for a Reversal?After a clean sweep of the Previous Day’s Low (PDL) on XAUUSD, price reacted sharply, grabbing liquidity and signaling a possible shift in order flow. This forms the first pillar of my CRT model (Candle Range Theory) : Sweep, Break, Retest .
Following the sweep, we observed a strong Break of Structure (BOS) , indicating bullish intent. We will then wait for price to retrace back to a FVG at a discount, and then execute the trade.
The stop loss was logically placed just beneath the PDL sweep and FVG zone, protecting against deeper liquidity hunts. Take profit targets the next high where resting buy-side liquidity is likely to be engineered.
This setup checks all the boxes:
Sweep of PDL ✅
BOS confirming shift ✅
FVG retest for refined entry ✅
Solid RR and clean narrative ✅
This is a great example of how patience and a structured approach can create high-probability setups.
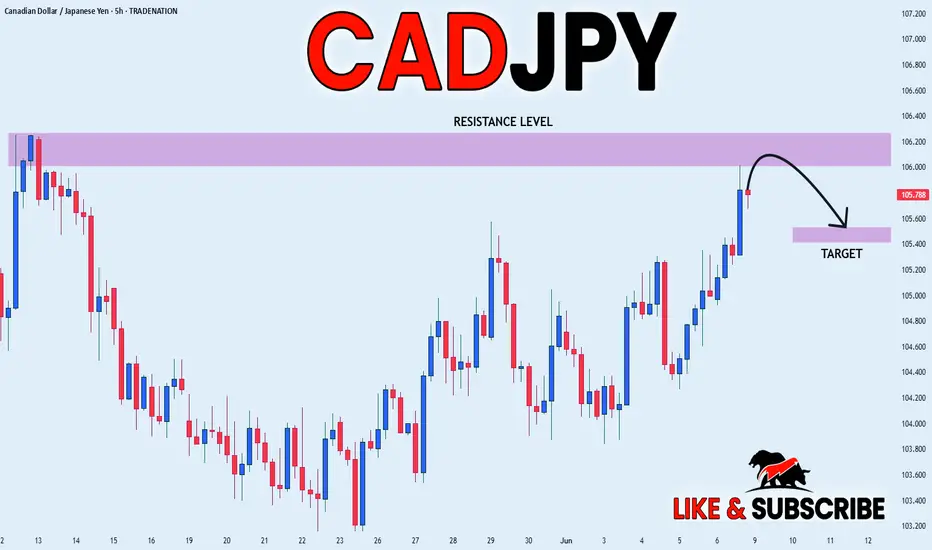
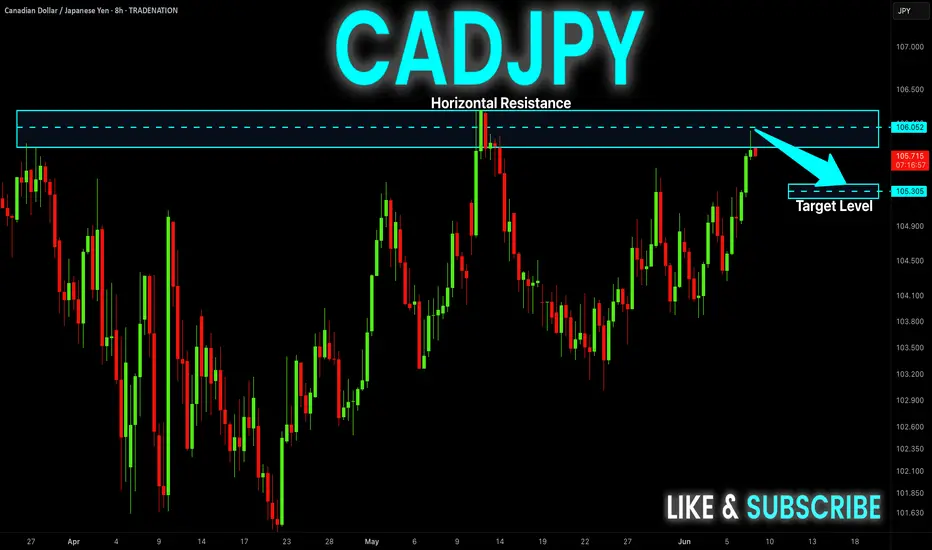
CAD-JPY Pullback Expected! Sell!
Hello,Traders!
CAD-JPY made a retest of
The strong horizontal resistance
Level of 106.083 and as you
Can see the pair is already
Making a local pullback from
The level which sends a clear
Bearish signal to us therefore
We will be expecting a
Further bearish correction
Sell!
Comment and subscribe to help us grow!
Check out other forecasts below too!
Disclosure: I am part of Trade Nation's Influencer program and receive a monthly fee for using their TradingView charts in my analysis.
CHF_JPY WILL FALL|SHORT|
✅CHF_JPY price went up sharply
But a strong resistance level was hit around 176.330
Thus, as a pullback is already happening
And a move down towards the target of 175.799 shall follow
SHORT🔥
✅Like and subscribe to never miss a new idea!✅
Disclosure: I am part of Trade Nation's Influencer program and receive a monthly fee for using their TradingView charts in my analysis.
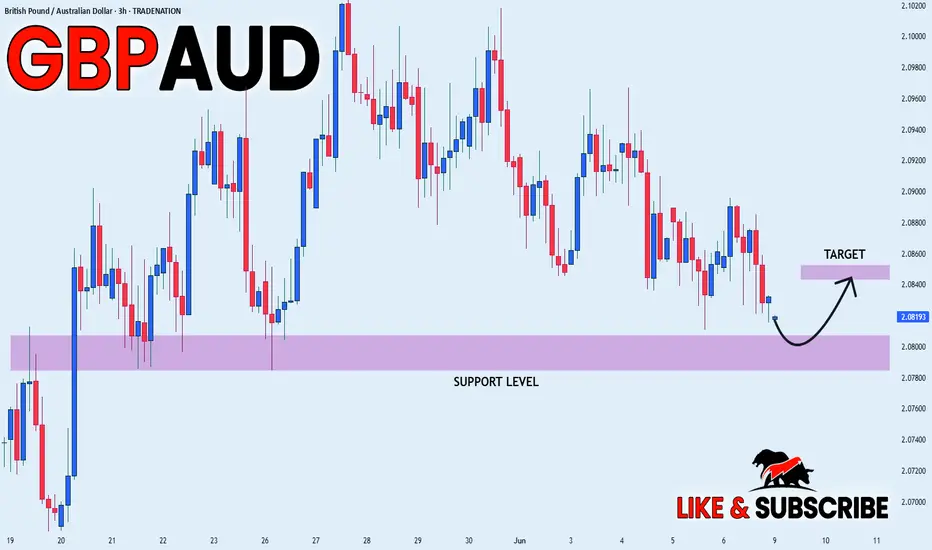
GBP_AUD REBOUND AHEAD|LONG|
✅GBP_AUD has been falling recently
And the pair seems locally oversold
So as the pair is approaching a horizontal support of 2.0786
Price growth is to be expected
LONG🚀
✅Like and subscribe to never miss a new idea!✅
Disclosure: I am part of Trade Nation's Influencer program and receive a monthly fee for using their TradingView charts in my analysis.
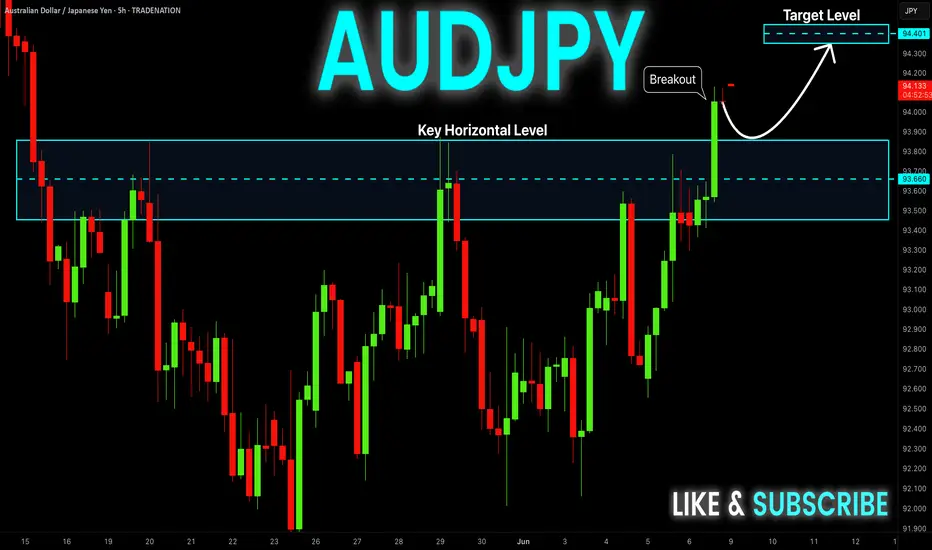
AUD-JPY Will Keep Growing! Buy!
Hello,Traders!
AUD-JPY made a bullish
Breakout of the key
Horizontal level of 93.800
And the breakout is confirmed
So we are bullish biased
And we will be expecting
A further bullish move up
Buy!
Comment and subscribe to help us grow!
Check out other forecasts below too!
Disclosure: I am part of Trade Nation's Influencer program and receive a monthly fee for using their TradingView charts in my analysis.
NZDUSD - Time to buyWhen the market opens and we have a clear longing opportunity to get long on NZDUSD
We have an inducement level to the left and already have a sign of strength to the upside.

GBPUSD - Very InterestingWith NFP creating massive volatility on Friday this pair is a bit messy.
We have however created an internal structure shift on the 15min timeframe to the downside lower the HTF order flow still being bullish
This could be a case of get what we can to the downside until we hit the HTF demand and look to get long.
As you can see I am already trying to forecast ahead of what could potentially happen with this pair as when it gets to certain levels and there are reactions it will come as no surprise.
If I can be of assistance to anybody please don't hesitate to message.
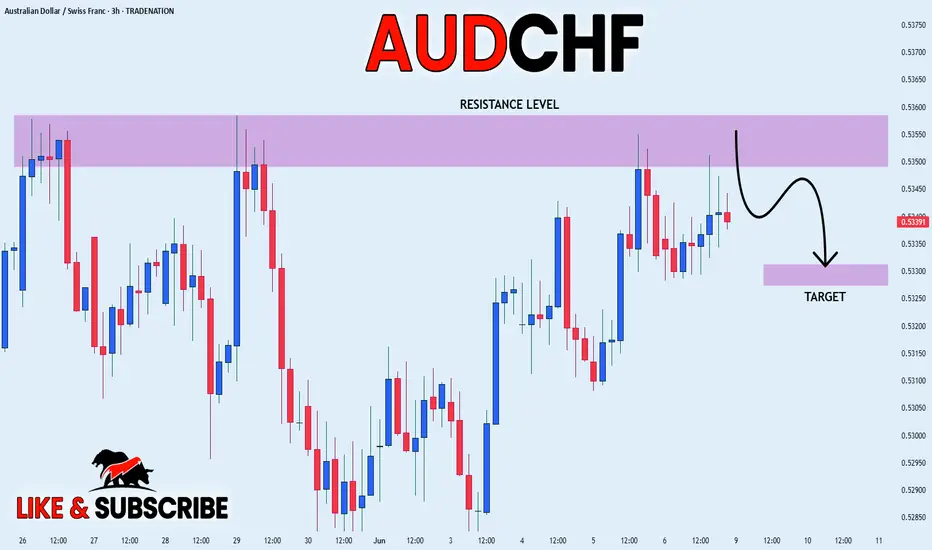
AUD_CHF ELEGANT SHORT|
✅AUD_CHF went up to retest
A horizontal resistance level of 0.5358
Which makes me locally bearish biased
And I think that a move down
From the level is to be expected
Towards the target below at 0.5330
SHORT🔥
✅Like and subscribe to never miss a new idea!✅
Disclosure: I am part of Trade Nation's Influencer program and receive a monthly fee for using their TradingView charts in my analysis.
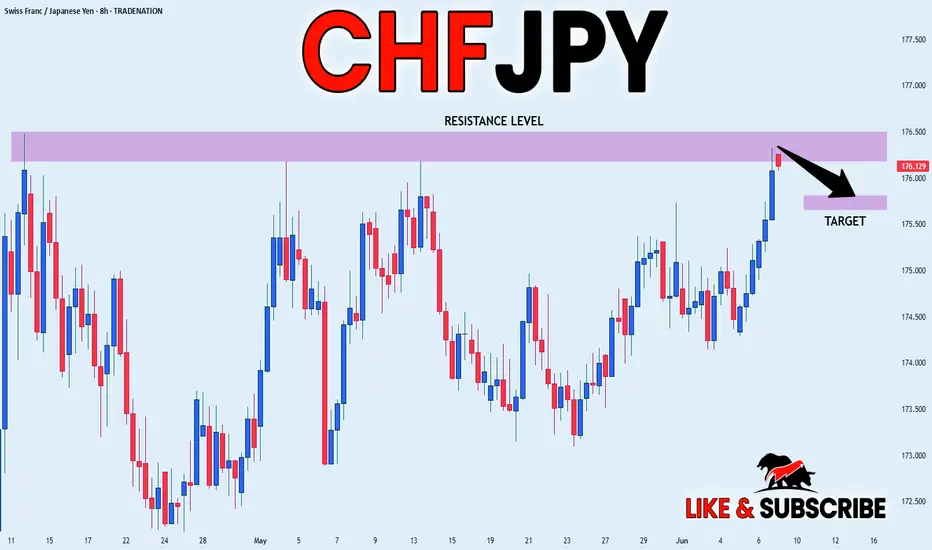
CHF-JPY Correction Ahead! Sell!
Hello,Traders!
CHF-JPY will soon hit a
Horizontal resistance
Of 176.500 and as the
Pair is overbought we
Will be expecting a bearish
Correction next week
Sell!
Comment and subscribe to help us grow!
Check out other forecasts below too!
Disclosure: I am part of Trade Nation's Influencer program and receive a monthly fee for using their TradingView charts in my analysis.

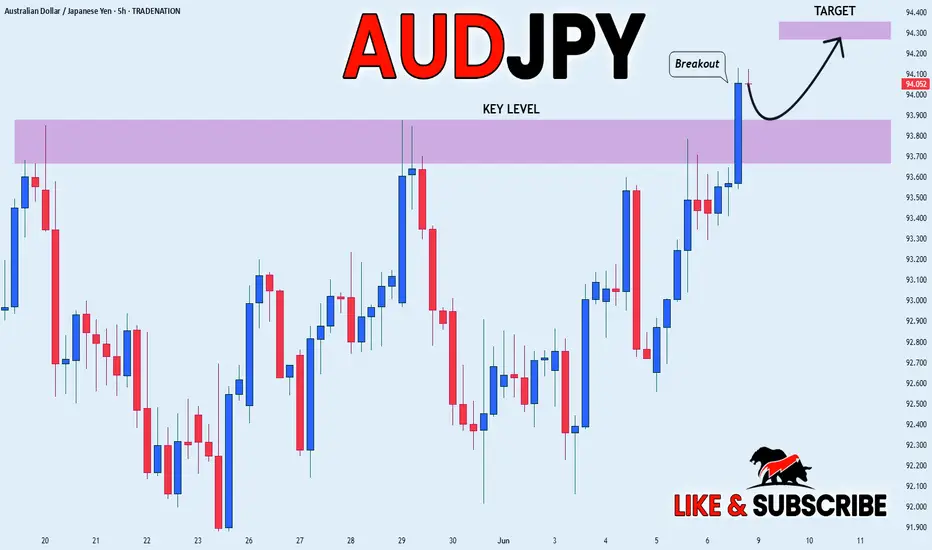
AUD_JPY BULLISH BREAKOUT|LONG|
✅AUD_JPY is trading in a
Local uptrend and the pair
Broke the key horizontal level
Of 93.866 and the breakout is
Confirmed so we will be
Expecting a further
Bullish move up on Monday
LONG🚀
✅Like and subscribe to never miss a new idea!✅
Disclosure: I am part of Trade Nation's Influencer program and receive a monthly fee for using their TradingView charts in my analysis.
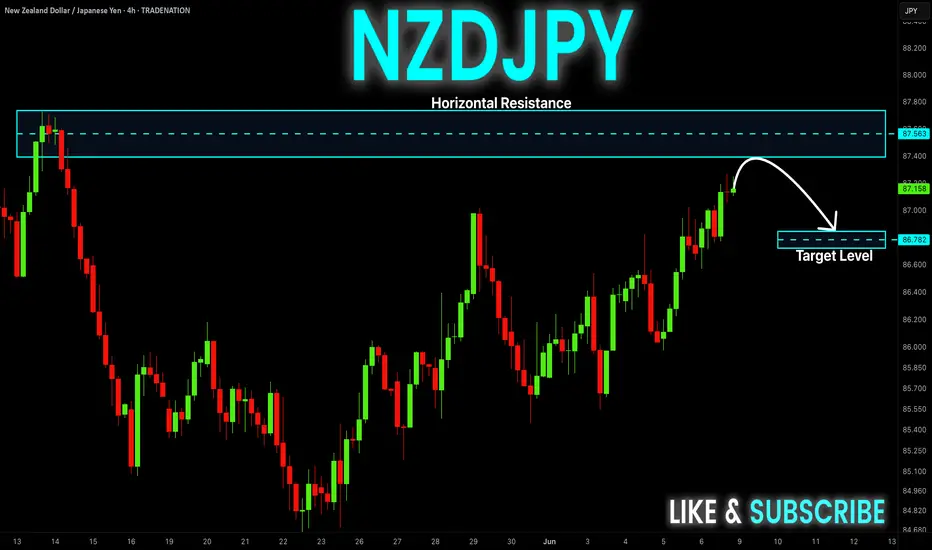
NZD-JPY Will Go Down! Sell!
Hello,Traders!
NZD-JPY keeps growing
But will soon hit a horizontal
Resistance of 87.730 and as
The pair is locally overbought
So after the retest we will
Be expecting a local
Bearish correction
Sell!
Comment and subscribe to help us grow!
Check out other forecasts below too!
Disclosure: I am part of Trade Nation's Influencer program and receive a monthly fee for using their TradingView charts in my analysis.
CAD_JPY SHORT FROM RESISTANCE|
✅CAD_JPY has been growing recently
And the pair seems locally overbought
So as the pair is approaching a horizontal resistance of 106.269
Price decline is to be expected
SHORT🔥
✅Like and subscribe to never miss a new idea!✅
Disclosure: I am part of Trade Nation's Influencer program and receive a monthly fee for using their TradingView charts in my analysis.