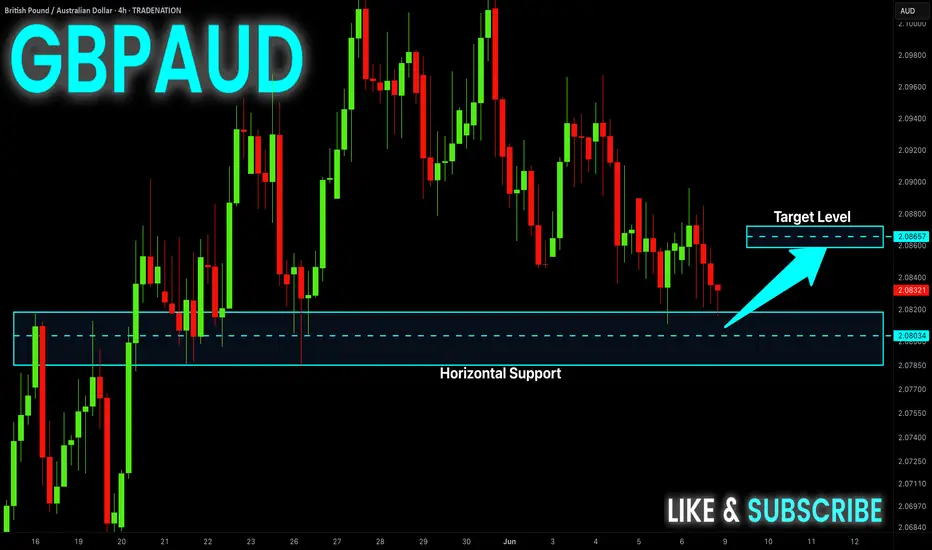
GBP-AUD Local Long! Buy!
Hello,Traders!
GBP-AUD will soon hit
A horizontal support
Of 2.0780 and as it is
A strong level we will
Be expecting a bullish
Rebound and a move up
Buy!
Comment and subscribe to help us grow!
Check out other forecasts below too!
Disclosure: I am part of Trade Nation's Influencer program and receive a monthly fee for using their TradingView charts in my analysis.
Smartmoneyconcept
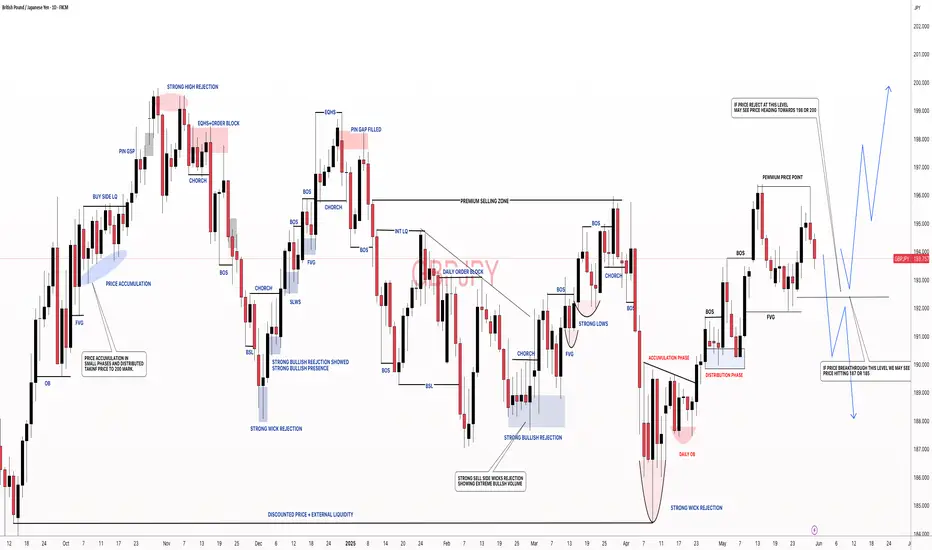
#GBPJPY: Buyers and Sellers Both Has Equal Chances! Hey there! So, GBPJPY is at a pivotal moment, and we might see a mix of buying and selling activity in the market. Since the bulls aren’t exactly sure what to do next, here’s what we think:
- The GBPJPY pair is having a tough time breaking through the 194 region. The Japanese yen (JPY) is holding steady, making it hard to predict what will happen next. This has made trading JPY pairs a real challenge.
- Looking back at how prices have behaved in similar situations can give us some clues about what might happen in the future. But it’s important to do thorough research before we start trading. Just because something happened in the past doesn’t mean it will happen again.
- The Japanese yen (JPY) also tends to go down when the US dollar (USD) goes up. Since we’re bullish on the DXY index in the coming days, we think the JPY will probably take a hit, and it could go down a lot. It’s also worth keeping an eye on the GBP, which has been one of the most popular currencies since the market opened earlier today.
- In the meantime, we suggest setting two take-profit targets: one at 197 and another at 199. These levels are likely to see a lot of selling activity.
Now, let’s talk about what sellers should do:
- The price is currently in favour of sellers since it dropped from 195.50 to 193.50. And since the last two daily candles closed with strong bearish volume, it looks like the price is going to keep going down.
- If the price breaks below 190.50, that would be a great opportunity for sellers to make some money.
Good luck and trade safely!
Thank you for your unwavering support! 😊
If you’d like to contribute, here are a few ways you can help us:
- Like our ideas
- Comment on our ideas
- Share our ideas
Team Setupsfx_
❤️🚀
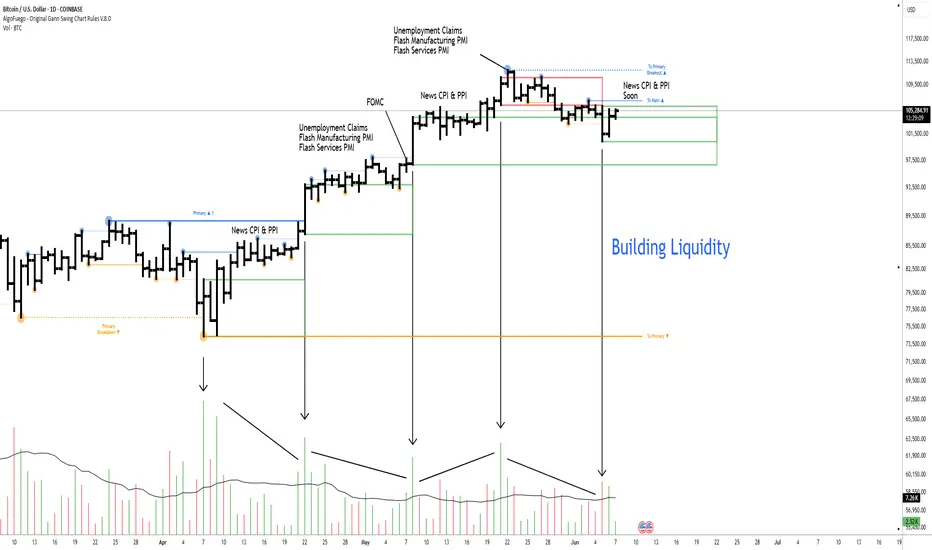
Building Liquidity: What It Really Means🔵 Building Liquidity: What it really means
Professional traders often need liquidity (buyers and sellers) to enter/exit large positions without moving the market too much.
This means manipulating the market within a pre-determined range, which serves as the operating center for everything that follows.
🔹 How is liquidity built
Price Ranging: Sideways consolidation before big moves attracts both buyers and sellers.
False Breakouts (Stop hunts): Price may briefly break support/resistance to trigger retail stop-losses and fill institutional orders.
News Timing: Pro traders often execute during or just before major news when volatility brings liquidity.
🔹 How can you spot a Liquidity-building zone
🔸 Volume
Unusual spikes in volume: Often indicate institutional activity.
Volume clusters at ranges or breakouts: Suggest accumulation/distribution zones.
Volume with price divergence: Price rises but volume falls = possible exhaustion. Volume rises and price consolidates = potential accumulation.
🔸 Price Action
Order Blocks / Imbalance zones: Sharp moves followed by consolidations are often pro trader footprints.
Break of Structure (BoS): Institutions often reverse trends by breaking previous highs/lows.
Liquidity sweeps: Price moves aggressively above resistance or below support then reverses = stop-loss hunting.
🔸 News Reaction
Watch pre-news volume spikes.
Look for contrarian moves after news — when price moves opposite to expected direction, it often reveals smart money traps.
Analyze price stability post-news — slow movement shows absorption by pros.
Wick traps and reversals around news events = stop hunting.
🔸 Narrative is Everything
Higher timeframe trends show intent.
Lower timeframes show execution zones.
Look for alignment between timeframes in a specific direction.
🔹 Why do whales move the market in an orderly manner
To fill large positions at optimal prices.
To create liquidity where there is none.
To trap retail on the wrong side of the move.
To trap other whales on the wrong side of this move.
To rebalance portfolios around economic cycles/news.
🔹 Professionals never forget what they've built
When you track price, volume, and news, you’ll find specific bars that form areas that are the foundation for the short-term direction.
This is pure VPA/VSA logic, the interplay of Price Analysis ,Volume Analysis and News, where each bar is not just a bar , but a clue in the story that professionals are writing.
When you monitor volume, price, and news together and perform multi-timeframe analysis, it becomes clear what the whales are doing, and why.
🔹 From the chart above
The market reached a weekly resistance level and then pulled back slightly after whales triggered the stop-losses of breakout traders.
Prior to the breakout, whales had accumulated positions by creating a series of liquidity-rich buying zones on the daily timeframe.
It's essential to understand the broader context before choosing to participate alongside them—whether you're planning to buy or sell.
🔴 Tips
Use volume and price analysis together, not separately.
Monitor any unusual volume bars before economic market news.
Monitor news and volatility spikes to detect traps and entries.
Combine this with liquidity zones (support/resistance clusters).
Build a "narrative" per week: What is smart money trying to do?
A smart trader understands the tactics whales use, and knows how to navigate around them.
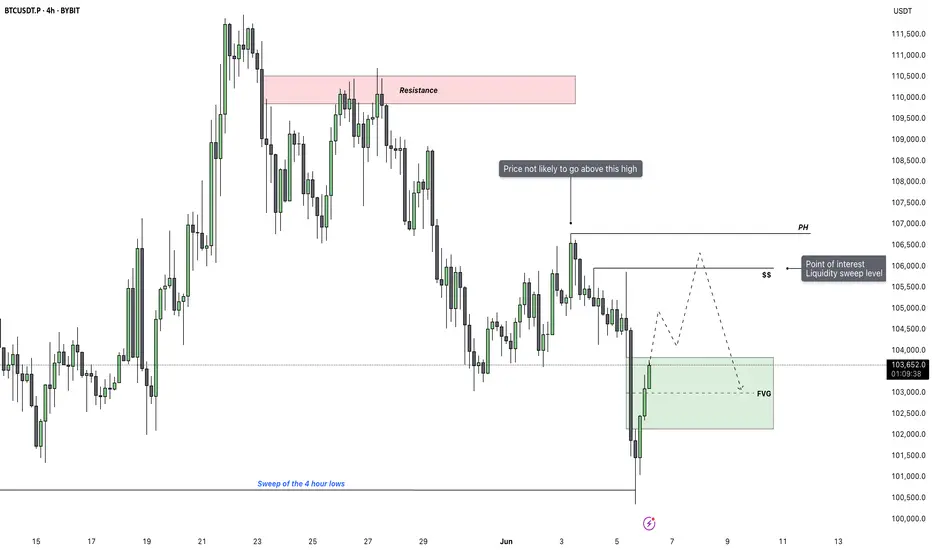
Bitcoin - Reclaim or Reject? Key 4H FVG Levels in FocusAfter an extended move lower, Bitcoin has just swept the major 4H lows and immediately bounced back with strength. This aggressive reaction suggests the sweep was likely a liquidity grab rather than a continuation. Price is now trading back inside a large 4H fair value gap, which could serve as a short-term magnet while market participants reassess direction.
Key Price Reaction and Fair Value Gap Context
The current rebound into the 4H FVG is notable. This zone holds significance because it's the last inefficiency left unfilled before the final leg down. If buyers manage to push through and close above this imbalance, it would indicate a short-term reclaim and open the door to a bullish liquidity sweep higher. The clean highs just above are marked by the $$ label, which align with a key inducement zone and should attract price if bullish momentum sustains.
Upside Scenario – Targeting the Liquidity Sweep
If we do see a clean move and close above the fair value gap, I’ll be looking for price to extend toward the highs just above it. These highs are likely to be the next target for liquidity collection, especially if short-term traders begin chasing strength. However, I’m not expecting price to trade beyond that zone. There’s a protected high resting above, and unless a significant fundamental shift occurs, it’s unlikely we break that structure.
Downside Risk – Failure to Hold Could Lead to 99K
If the market fails to close above the FVG or quickly gets rejected on a wick into it, the bullish scenario becomes invalid. That would confirm the move back up was simply a retracement after the sweep, setting the stage for further downside continuation. In that case, I expect the market to break lower and move toward 99K, which remains my downside target under bearish conditions.
Conclusion
Bitcoin just swept key 4H lows and is now testing a large imbalance. A close above could trigger a run on the $$ liquidity, but I do not expect price to move beyond that due to the presence of protected highs. On the other hand, failure to break and hold above the FVG opens the door for a deeper flush toward 99K.
___________________________________
Thanks for your support!
If you found this idea helpful or learned something new, drop a like 👍 and leave a comment, I’d love to hear your thoughts! 🚀
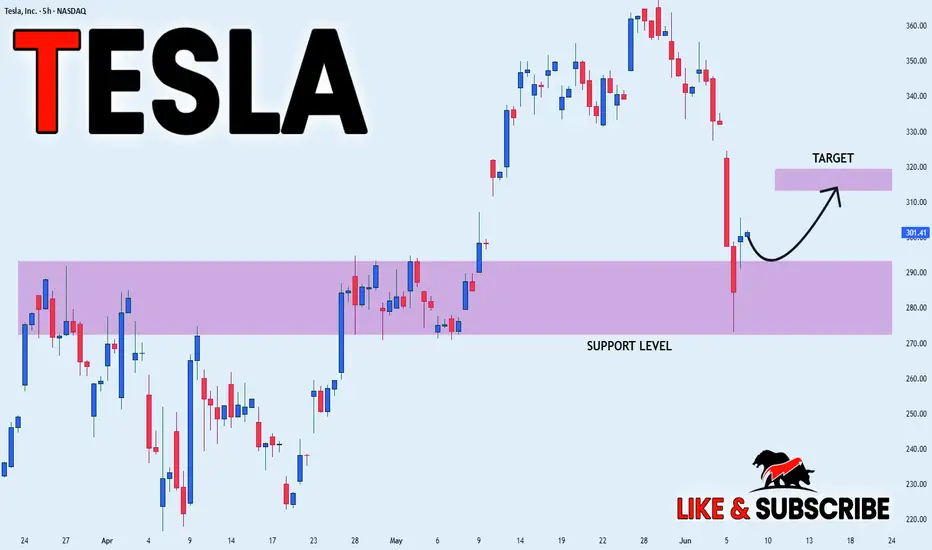
TESLA RECOVERY AHEAD|LONG|
✅TESLA lost more than 25%
On the Elon VS Trump fallout
In less than a week which is
Seen by many as an excellent
Opportunity to add TESLA stocks
To their portfolios with a great
Discount which is why we are
Already seeing a nice rebound
From the wide strong horizontal
Support just above 270$ level
And as we are locally bullish
Biased we will be expecting
Further growth on Monday
LONG🚀
✅Like and subscribe to never miss a new idea!✅
Disclosure: I am part of Trade Nation's Influencer program and receive a monthly fee for using their TradingView charts in my analysis.
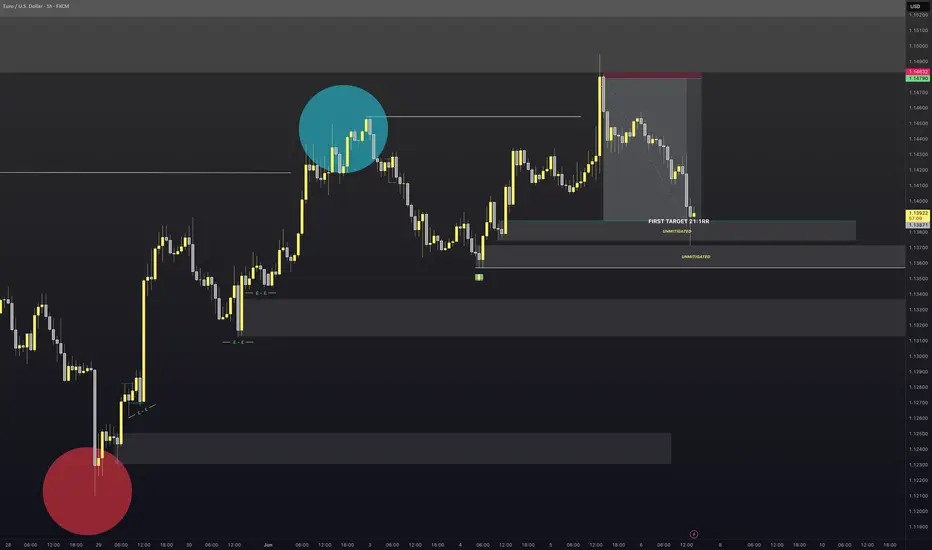
EURUSDVery important area now for EURUSD
Will the unmitigated OB's on the 1H stand strong or, will we continue lower. due to the HTF area of value.
Took a nice short on the 5min TF for a 1:21 RR.
Now lets see how this plays out should be really interesting
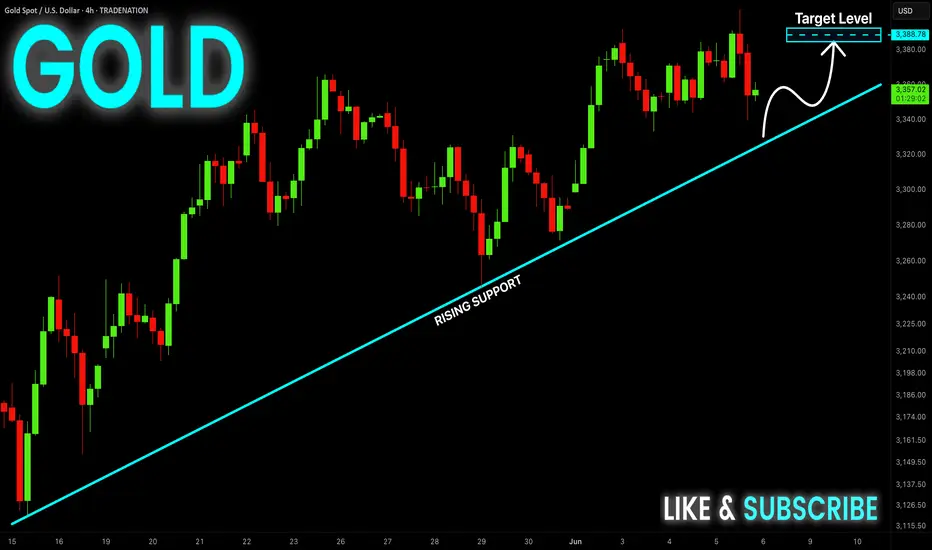
GOLD Long From Rising Support! Buy!
Hello,Traders!
GOLD is trading in an
Uptrend and the price is
Making a local pullback
But as we are bullish
Biased we will be expecting
A rebound from the rising
Support line and a move up
Buy!
Comment and subscribe to help us grow!
Check out other forecasts below too!
Disclosure: I am part of Trade Nation's Influencer program and receive a monthly fee for using their TradingView charts in my analysis.
EURUSD - SellEntered this earlier on the 1min TF
Target will be the first Order Block which is 21:RR.
The reason I am targeting here is the 4H order flow is still bullish. So if we can hit the target I close 50% of the position and let the rest ride and manage accordingly to price.
Lets see how it plays out

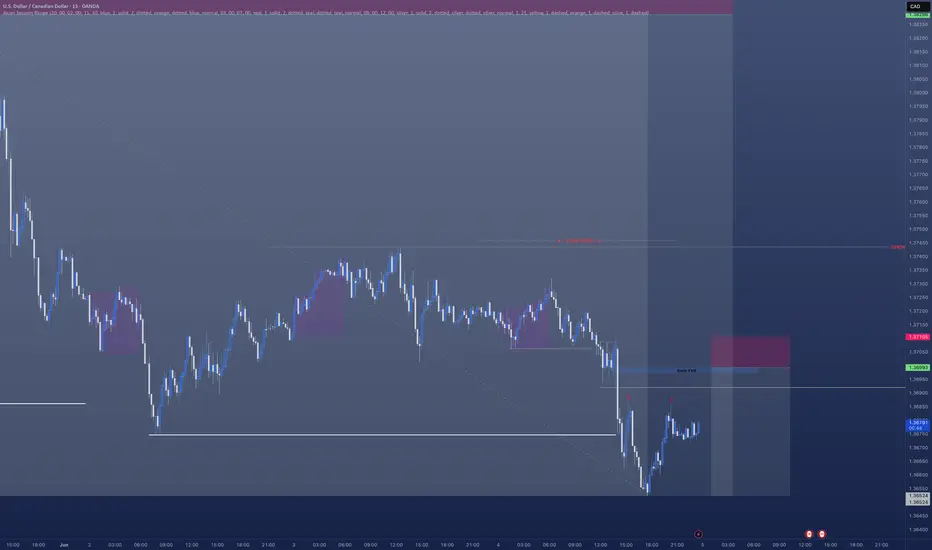
USDCAD - Short ContinuationHave a really nice short currently open on USDCAD
However I am looking to get a further position opened which come in the morning.
There's a clear break of structure.
- A nice FVG left behind.
- We are creating liquidity / inducement
- All pointing towards a nice further sell off in the morning.
Ideal situation is we sweep Asian session highs in the morning in the hope we move lower
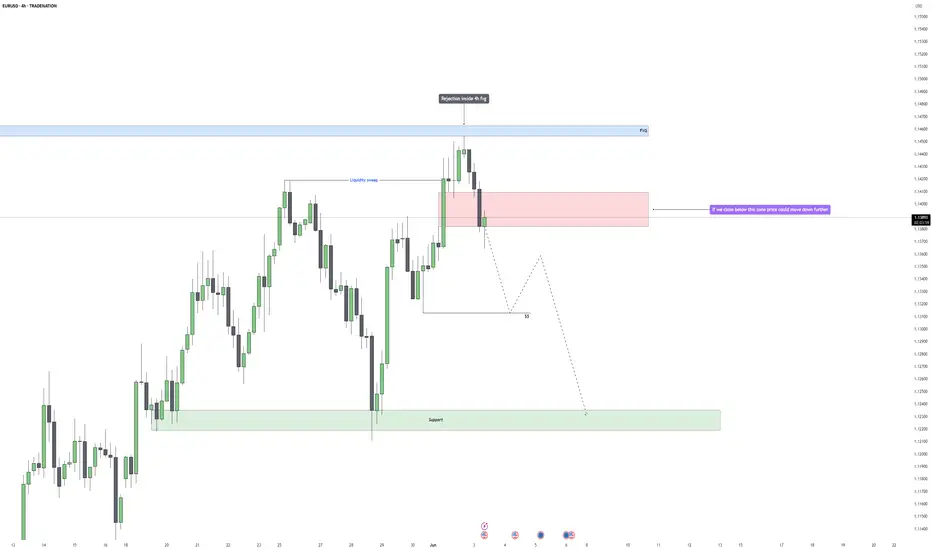
EURUSD - Potential Bearish ContinuationEURUSD recently tapped into a 4-hour Fair Value Gap, aligning perfectly with a prior liquidity sweep just above the recent swing high. This zone acted as a magnet for buy-side liquidity, and price reacted sharply once that liquidity was taken out. The rejection confirms this area was used by larger players to offload positions rather than push higher.
Rejection and Structure Shift
After the sweep and tap into the FVG, we saw an immediate and aggressive bearish reaction, signaling a clear rejection of higher prices. Momentum flipped decisively, breaking smaller structural points on the way down. The rejection is not just technical, it’s reactive, showing that the intent was never to sustain the breakout.
Break of Support Zone and Bearish Setup
Price is now testing the critical mid-range structure marked in red. This zone previously held as support multiple times, but it is now under pressure. If we get a clean 4H close below this area, it confirms a market structure shift and opens the door for further downside.
Bearish Target and Liquidity Zone Below
If the break confirms, the next logical move would be a push down into the broader support area below. That zone holds untapped liquidity and marks the base of the recent rally. A sweep of those lows would align perfectly with the narrative of a failed breakout, followed by a deeper correction.
Conclusion
The rejection from the 4H Fair Value Gap, combined with a liquidity sweep and a pending structure break, builds a clean bearish case. A confirmed close below the marked zone would shift this into a continuation setup, with expectations for a move toward the lower support and a potential sweep of the lows.
Disclosure: I am part of Trade Nation's Influencer program and receive a monthly fee for using their TradingView charts in my analysis.
___________________________________
Thanks for your support!
If you found this idea helpful or learned something new, drop a like 👍 and leave a comment, I’d love to hear your thoughts! 🚀
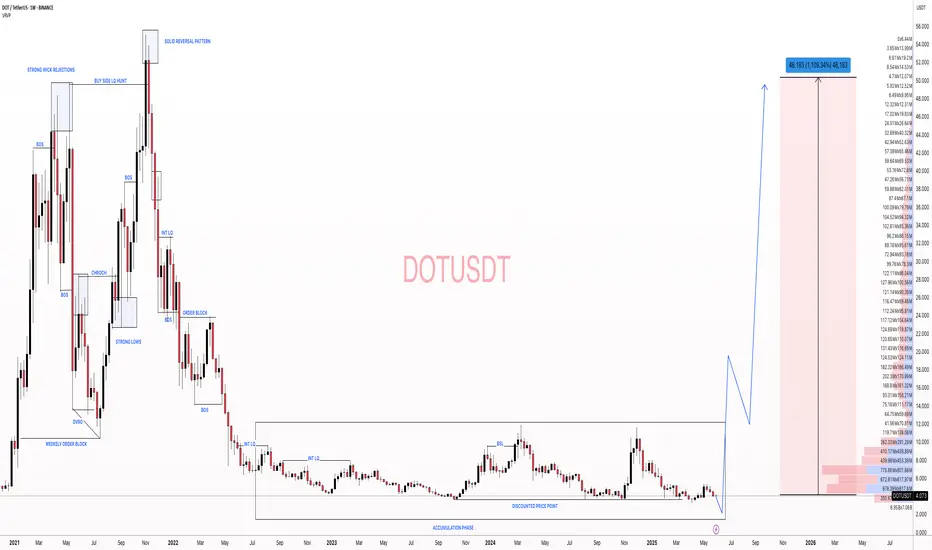
#DOTUSDT: Targeting $50 By End Of The Year! Wait For Volume ? Hey everyone!
So, about DOTUSDT, it’s been trading sideways at $4 lately. However, it has the potential to break through and hit new highs in the coming weeks or months. We’re not sure exactly what will happen next, but once it does, we expect it to start distributing its value. If this happens, we could see it reach our $50 mark by the end of the year.
I know this is just our speculative view, and we can’t rely solely on technical analysis to make this happen. We also need strong fundamental support. But hey, it’s worth a shot, right?
If you like our work, please give it a like and let us know what you think in the comments. We’d love to hear your thoughts!
Wishing you all the best and happy trading! 😊
We really appreciate your unwavering support! ❤️🚀
And if you’d like to lend a hand, here are a few ways you can contribute:
- Give our ideas a like
- Share your thoughts in the comments
- Spread the word about our ideas
Cheers,
Team Setupsfx_
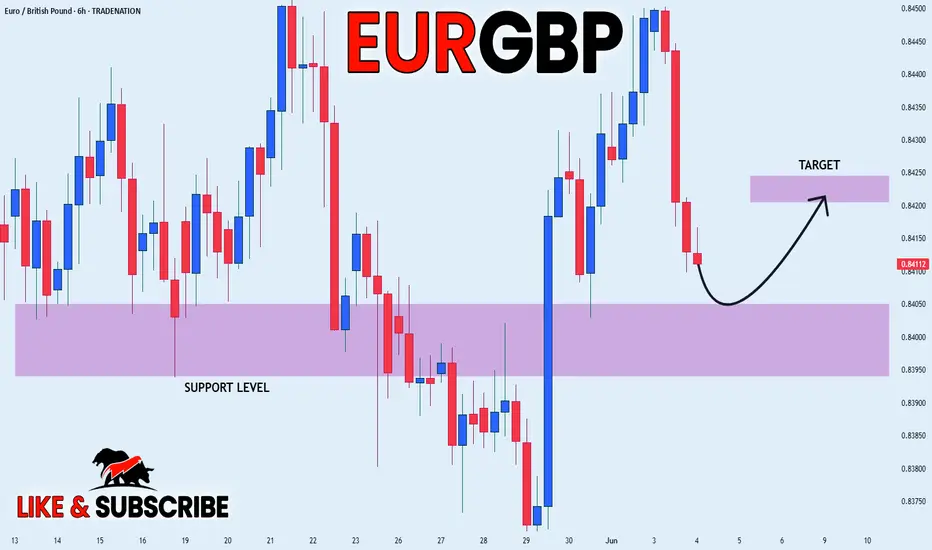
EUR_GBP POTENTIAL LONG|
✅EUR_GBP will be retesting a support level soon at 0.8400
From where I am expecting a bullish reaction
With the price going up but we need
To wait for a reversal pattern to form
Before entering the trade, so that we
Get a higher success probability of the trade
LONG🚀
✅Like and subscribe to never miss a new idea!✅
Disclosure: I am part of Trade Nation's Influencer program and receive a monthly fee for using their TradingView charts in my analysis.
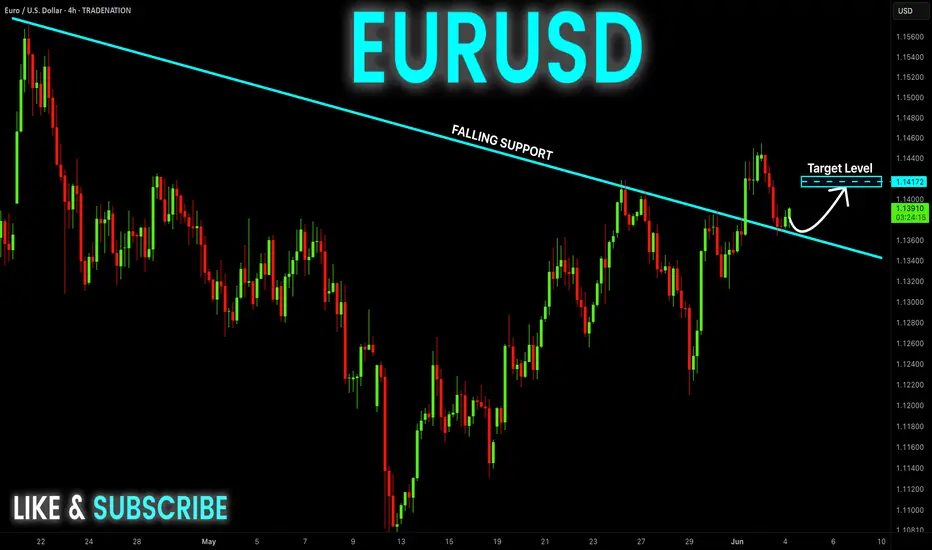
EUR-USD Bullish Rebound! Buy!
Hello,Traders!
EUR-USD made a retest of
The falling support line
While trading in a local
Uptrend and we are already
Seeing a bullish reaction
So we are locally bullish
Biased and we will be
Expecting a further move up
Buy!
Comment and subscribe to help us grow!
Check out other forecasts below too!
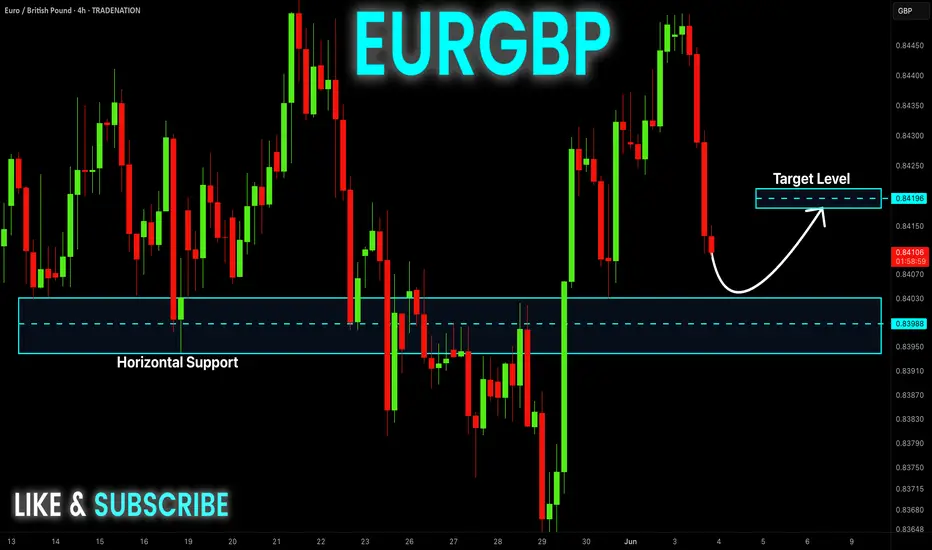
EUR-GBP Support Ahead! Buy!
Hello,Traders!
EUR-GBP made a pullback
From the horizontal resistance
Above just as we predicted
In our previous analysis
But a local horizontal support
Level is ahead at 0.8398
So after the retest we
Will be expecting a
Bullish rebound and a
Local bullish move up
Buy!
Comment and subscribe to help us grow!
Check out other forecasts below too!
Disclosure: I am part of Trade Nation's Influencer program and receive a monthly fee for using their TradingView charts in my analysis.
Bitcoin - Bears in control: Back to $103kPrice just swept the 1-hour and 4-hour swing highs, grabbing liquidity from anyone who had stops above the high. This was followed by an immediate and aggressive selloff, showing a clear bearish displacement. That move confirms smart money was unloading into retail longs, and we now have a shift in momentum pointing down.
Liquidity Sweep and Displacement Context
The sweep of the high was immediately followed by a strong bearish displacement. There was no hesitation after the breakout, which confirms this wasn’t a real breakout but a stop hunt. The reaction tells us that price was tapping into a key supply area or simply running out of buying interest above the high. This kind of rejection usually signals that smart money is positioning for a move lower.
Fair Value Gap and Pullback Zone
The drop left behind a clear 1-hour Fair Value Gap, sitting just below the swept high, between roughly $105,600 and $106,000. Price hasn’t returned to it yet, which opens the possibility for a short-term retracement back into that imbalance before continuation. That FVG becomes the main short entry zone, if price trades back into it, it’s likely to reject again.
Bearish Target and Market Structure Outlook
If we retrace into the FVG and reject, I expect a break of the recent short-term low around $104,300. That level will act as the first sign of bearish continuation. If that goes, there’s clean liquidity sitting below near the higher-timeframe low in the $103,600 zone. That’s the larger target for this setup, sweeping those lows would complete the move.
Conclusion
This is a clean high sweep followed by strong displacement and an unfilled FVG. If price trades back into that imbalance and shows rejection, I’m expecting continuation lower, with targets at $104,300 and ultimately down to $103,600.
___________________________________
Thanks for your support!
If you found this idea helpful or learned something new, drop a like 👍 and leave a comment, I’d love to hear your thoughts! 🚀

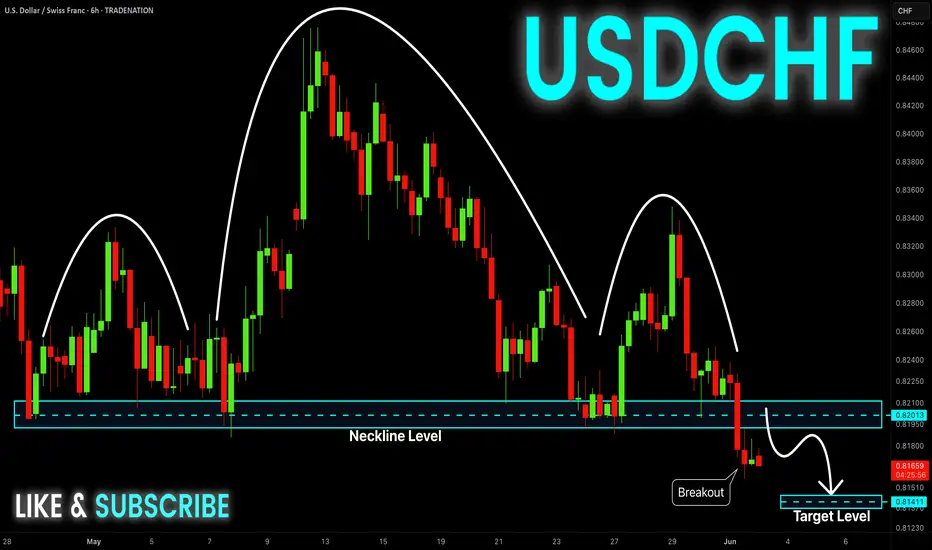
USD-CHF Head And Shoulders Breakout! Sell!
Hello,Traders!
USD-CHF formed a H&S
Pattern and then made a
Bearish breakout which is
Confirmed so we are bearish
Biased and we will be expecting
A further bearish move down
Sell!
Comment and subscribe to help us grow!
Check out other forecasts below too!
Disclosure: I am part of Trade Nation's Influencer program and receive a monthly fee for using their TradingView charts in my analysis.
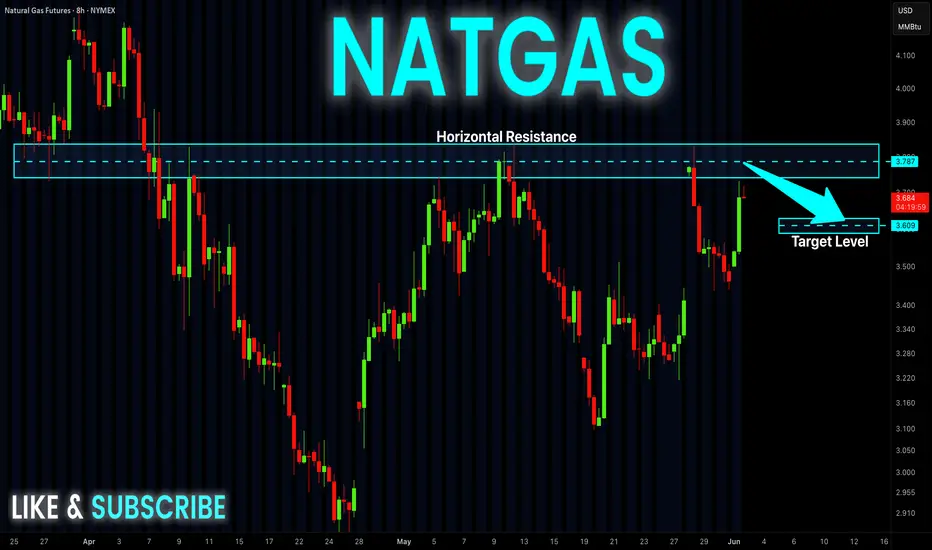
NATGAS Short From Resistance! Sell!
Hello,Traders!
NATGAS went up sharply
But the price will soon hit
A wide horizontal resistance
Of 3.809$ from where we will
Be expecting a pullback and
A local move down
Sell!
Comment and subscribe to help us grow!
Check out other forecasts below too!
Disclosure: I am part of Trade Nation's Influencer program and receive a monthly fee for using their TradingView charts in my analysis.
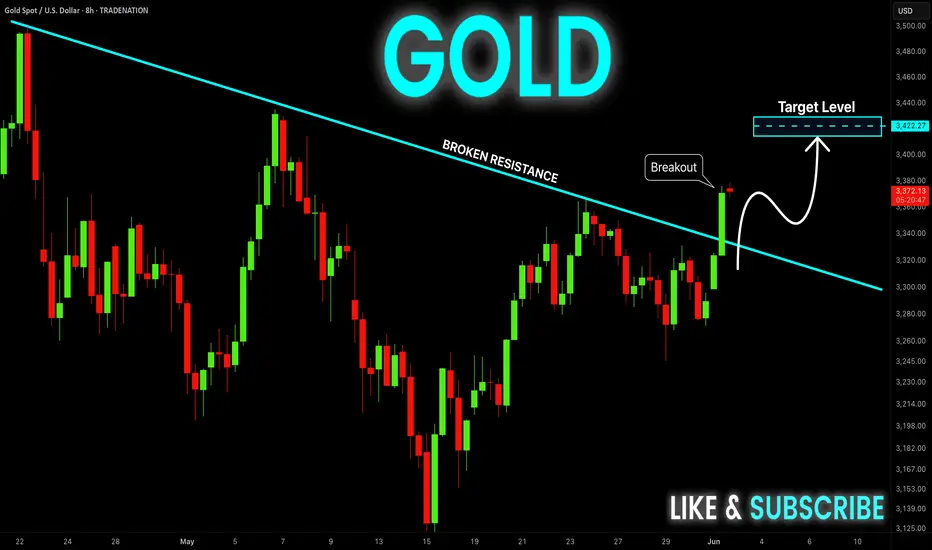
GOLD Massive Bullish Breakout! Buy!
Hello,Traders!
GOLD is trading in a strong
Uptrend and the price just
Made a massive bullish
Breakout of the falling
Resistance line and the
Breakout is confirmed
So after a potential pullback
We will be expecting a
Further bullish continuation
Buy!
Comment and subscribe to help us grow!
Check out other forecasts below too!
Disclosure: I am part of Trade Nation's Influencer program and receive a monthly fee for using their TradingView charts in my analysis.
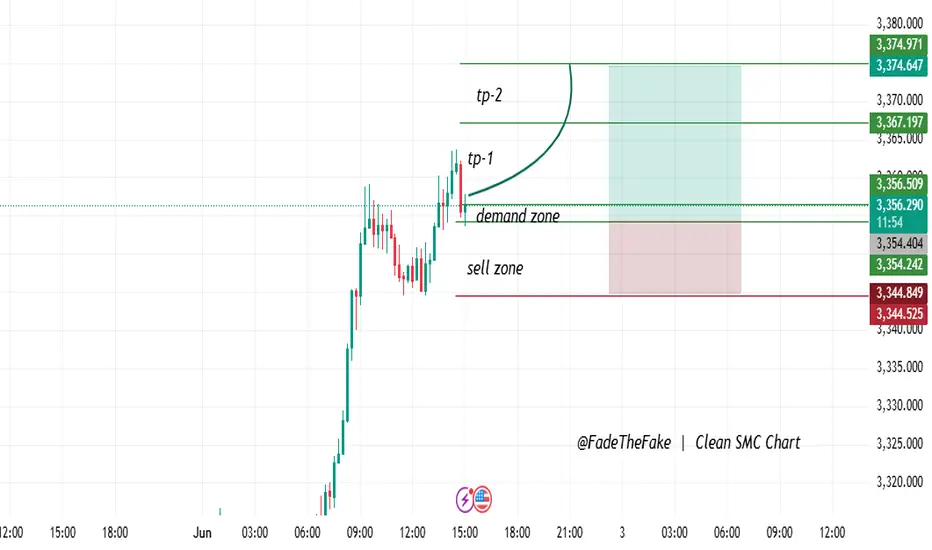
"Demand Zone Play – Targeting Fresh Highs!"Clean Buy Setup | Reaction in Demand Zone
- Price has touched a well-defined demand zone.
- Confirmed bullish reaction with good wick rejections.
- Placed entry just above the zone, stop loss below structural low.
- Targeting more liquidity zones as TP1 and TP2.
Entry: 3356.50
SL: 3344.50
TP1: 3367.20
TP2: 3374.97
This concept draws on a blend of Smart Money Ideas and Demand/Supply Zones
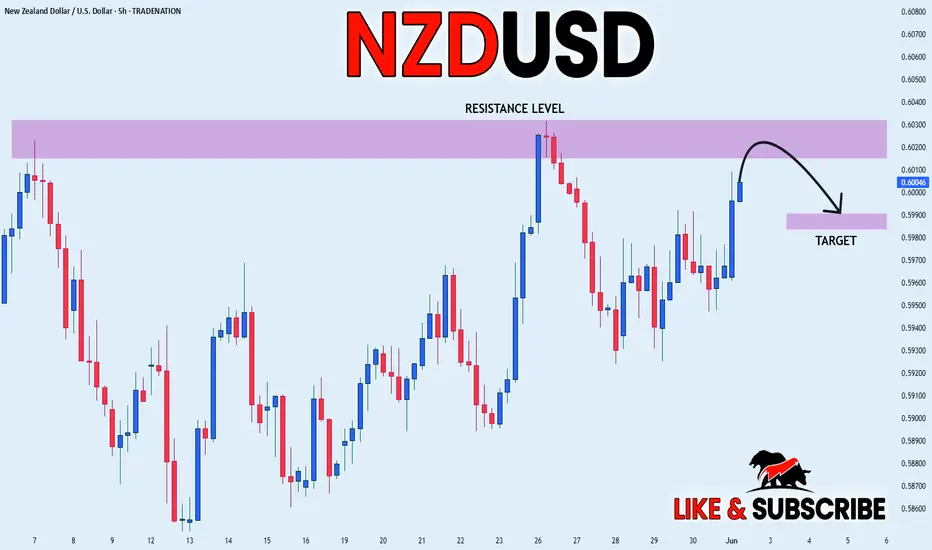
NZD_USD RISKY SHORT FROM RESISTANCE|
✅NZD_USD has been growing recently
And the pair seems locally overbought
So as the pair is approaching a horizontal resistance of 0.6030
Price decline is to be expected
SHORT🔥
✅Like and subscribe to never miss a new idea!✅
Disclosure: I am part of Trade Nation's Influencer program and receive a monthly fee for using their TradingView charts in my analysis.
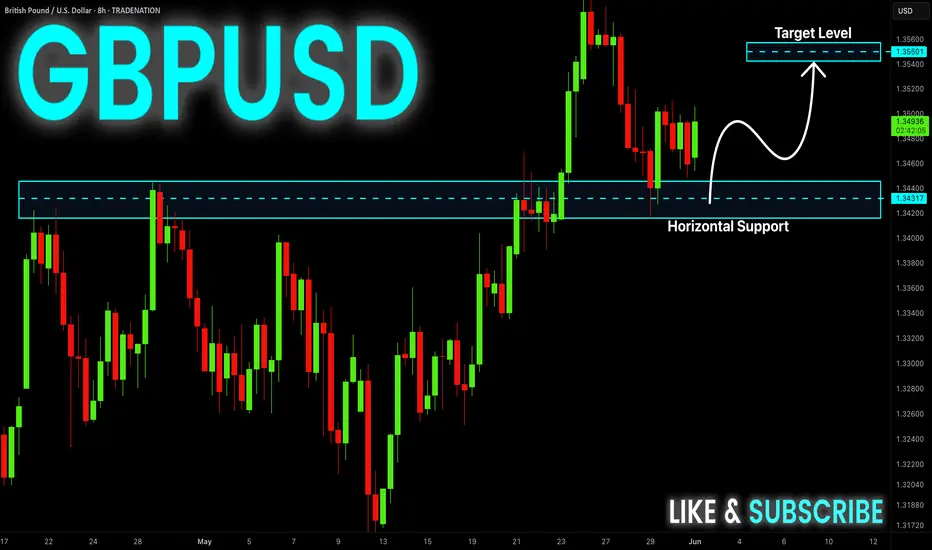
GBP-USD Will Go UP! Buy!
Hello,Traders!
GBP-USD is trading in an
Uptrend and the pair already
Made a rebound from the
Horizontal support level
Around 1.3431 from where
So we are bullish biased
And we will be expecting
A further bullish move up
Buy!
Comment and subscribe to help us grow!
Check out other forecasts below too!
Disclosure: I am part of Trade Nation's Influencer program and receive a monthly fee for using their TradingView charts in my analysis.
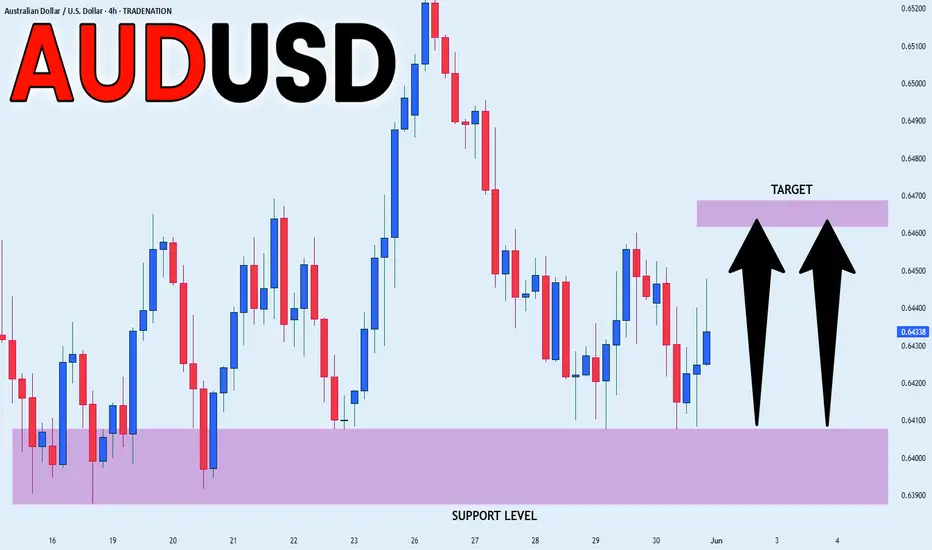
AUD_USD POTENTIAL LONG|
✅AUD_USD fell down sharply
But a strong support level was hit around 0.6400
Thus as a rebound is already happening
A move up towards the target of 0.6463 shall follow
LONG🚀
✅Like and subscribe to never miss a new idea!✅
Disclosure: I am part of Trade Nation's Influencer program and receive a monthly fee for using their TradingView charts in my analysis.
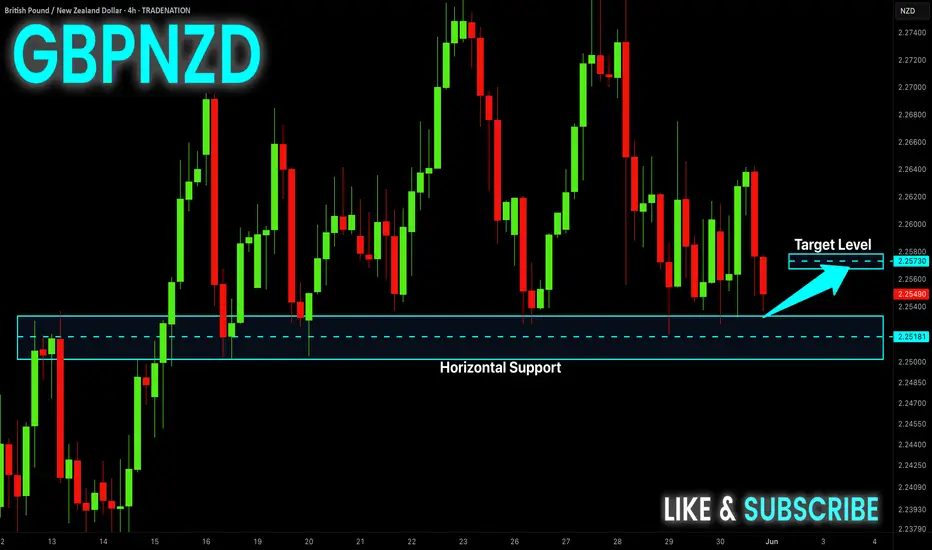
GBP-NZD Local Long! Buy!
Hello,Traders!
GBP-NZD will soon hit a
Horizontal support level
Of 2.0518 and as we have
Seem multiple rebounds
From the level we can
Bet on a one more rebound
And go long from the level
On Monday
Buy!
Comment and subscribe to help us grow!
Check out other forecasts below too!
Disclosure: I am part of Trade Nation's Influencer program and receive a monthly fee for using their TradingView charts in my analysis.