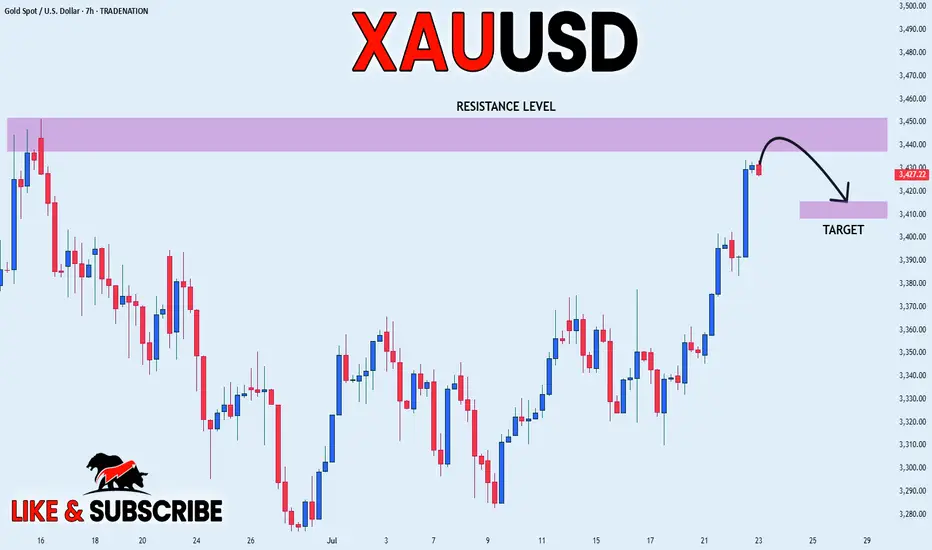
GOLD SHORT FROM RESISTANCE|
✅GOLD is set to retest a
Strong resistance level above at 3450$
After trading in an uptrend for some time
Which makes a bearish pullback a likely scenario
With the target being a local support below at 3414$
SHORT🔥
✅Like and subscribe to never miss a new idea!✅
Disclosure: I am part of Trade Nation's Influencer program and receive a monthly fee for using their TradingView charts in my analysis.
Smartmoneyconcept
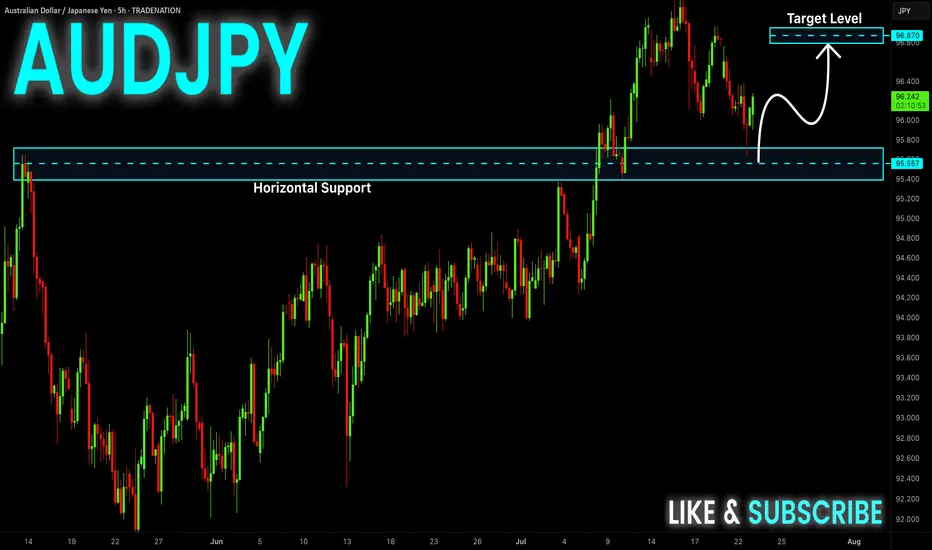
AUD-JPY Will Grow! Buy!
Hello,Traders!
AUD-JPY already made a
Bullish rebound from the
Strong horizontal support
Of 95.610 and as we are
Bullish biased we will be
Expecting a further bullish
Move up
Buy!
Comment and subscribe to help us grow!
Check out other forecasts below too!
Disclosure: I am part of Trade Nation's Influencer program and receive a monthly fee for using their TradingView charts in my analysis.
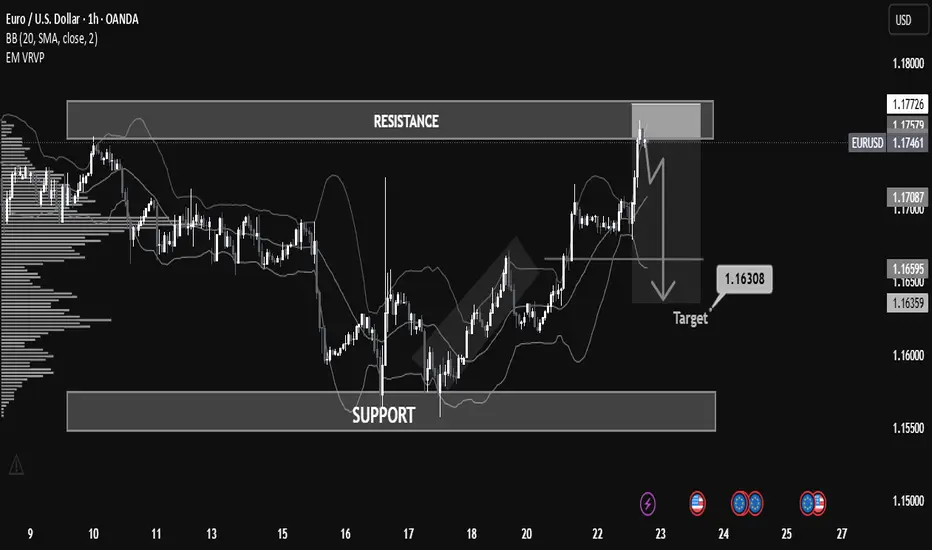
Why EUR/USD Dropped: A Step-by-Step Breakdown for Learners📉 Overview:
The EUR/USD has recently approached a key resistance zone near 1.17726, showing signs of a potential rejection after a bullish rally. The price is currently hovering around 1.17468, forming a short-term bearish setup that could lead to a retracement or reversal.
⸻
⚙ Key Technical Zones:
• 🔼 Resistance: 1.17500 – 1.17726
Price was strongly rejected after testing this area. This level has historically acted as a supply zone.
• 🔽 Support: 1.15500 – 1.16000
This is a historically significant demand zone, where price previously consolidated and reversed.
• 🎯 Target Zone: 1.16308
Marked as a potential take-profit level based on prior price structure and volume profile imbalance.
⸻
🧠 Indicators & Tools:
• Bollinger Bands: Price touched the upper band in overbought conditions, suggesting a possible mean reversion.
• Volume Profile (VRVP): Indicates declining volume near resistance, pointing to weak buyer momentum.
• Price Action: Bearish engulfing candle and strong rejection wick at resistance, confirming selling pressure.
⸻
🧭 Market Bias:
📌 Short-Term Bearish
A short opportunity is forming based on the rejection from resistance and overextension of price.
⸻
🧩 Possible Scenario:
1. Breakdown below 1.17061 (mid-level support) could trigger acceleration to the downside.
2. 1.16500 and 1.16308 are ideal short targets before reevaluation for continuation or bounce.
⸻
🛑 Risk Management Tips:
• Consider SL above 1.17800 (previous high).
• Monitor for confirmation before entry (e.g., bearish candle close below 1.17000).
• Adjust size and risk-reward ratio appropriately.
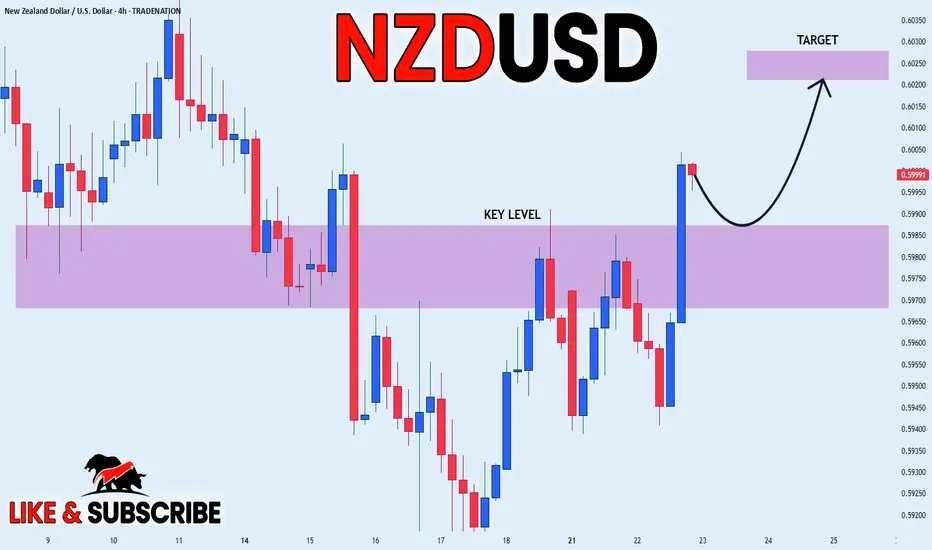
NZD_USD BULLISH BREAKOUT|LONG|
✅NZD_USD is going up
Now and the pair made a bullish
Breakout of the key horizontal
Level of 0.5980 and the breakout
Is confirmed so we are bullish
Biased and we will be expecting
A further bullish move up
LONG🚀
✅Like and subscribe to never miss a new idea!✅
Disclosure: I am part of Trade Nation's Influencer program and receive a monthly fee for using their TradingView charts in my analysis.
USOIL Long From Support! Buy!
Hello,Traders!
USOIL made a retest of
The horizontal support
Level of 64.86$ from where
We are already seeing a bullish
Reaction so we will be expecting
A further local move up
Buy!
Comment and subscribe to help us grow!
Check out other forecasts below too!
Disclosure: I am part of Trade Nation's Influencer program and receive a monthly fee for using their TradingView charts in my analysis.

Bitcoin – Breakout Coming, But May Be a TrapBitcoin is trading within a well-defined bullish pennant structure on the 1H chart, with clear compression between a rising support and descending resistance. This pattern typically signals a continuation of the prior trend, but given the surrounding liquidity and recent FVG formation, the setup looks more nuanced. After a liquidity sweep earlier this session, price has rebounded and is currently respecting a newly formed 1H fair value gap within the pennant range.
Pennant Structure and Price Reaction
The consolidation is tight and clean, with buyers stepping in off the ascending trendline support. This area overlaps with a small FVG that has so far held as intraday support, suggesting active demand. Until this gap is violated, the structure remains intact and favors a breakout play to the upside. However, with a larger unmitigated FVG sitting just under 121,000 and a previous swing high forming a strong liquidity pool, the upside might be limited.
Buy Side Liquidity and Reversal Area
If price can push above the descending trendline, the next logical target is the buy side liquidity sitting around 120,800 to 121,200. That zone is also where sellers may step in, given it aligns with prior inefficiency and a probable stop hunt level. This makes it a high-probability reversal area. I expect price to take out that buy side before we get a meaningful shift lower again.
Displacement and FVG Reactions
Any clean displacement toward the upside, particularly into the 121k range, will be key to watch for rejection signs. Should we see rejection or an SFP at the liquidity zone, that would likely confirm the short-term top. At that point, I’d expect a return into the pennant or even a sweep of the trendline support again, setting up a deeper retracement.
Short-Term Expectations
In the immediate term, as long as price holds above the current FVG and trendline confluence, I expect Bitcoin to slowly grind higher and break out of the pennant. The objective is the liquidity above 120,800. Once that’s taken, I’ll be watching closely for signs of exhaustion or reversal patterns to get positioned short again.
Conclusion
Bitcoin is compressing within a bullish pennant and currently holding a fair value gap, suggesting bullish continuation in the short term. However, the real play may come after a sweep of the buy side liquidity near 121k, where I expect a bearish rejection and opportunity for downside positioning. The market structure remains neutral to bullish until that liquidity is tagged.
Disclosure: I am part of Trade Nation's Influencer program and receive a monthly fee for using their TradingView charts in my analysis.
___________________________________
Thanks for your support!
If you found this idea helpful or learned something new, drop a like 👍 and leave a comment, I’d love to hear your thoughts! 🚀

USDJPY - M15 Downtrend with Supply Zone RetestThe USD/JPY market currently exhibits a downtrend with price rebounding slightly from recent lows. The key focus is the Lower Time Frame (LTF) Supply Zone around 148.2, which acts as a strong resistance level.
The trading plan anticipates the price to rise into this LTF Supply Zone, where selling pressure is expected to resume, leading to a continuation of the downward trend. The ultimate target is near the previous strong low around 146.8, representing a potential demand zone and support level.
This plan suggests watching for price action signals such as rejection wicks or bearish candlestick patterns within the supply zone to confirm entries for short positions. Managing risk involves placing stop losses just above the supply zone to protect against unexpected breakouts.

GBPUSD - Analysis with Order Blocks and Demand ZoneThe GBP/USD market currently shows an upward momentum with prices climbing from a Lower Time Frame (LTF) Demand Zone. Two significant Order Blocks are identified as potential areas for price reaction and entry points. The first Order Block near 1.34564 offers a risk-to-reward ratio of approximately 1.3, while the second, lower Order Block near 1.34350 provides a better risk-to-reward ratio of about 1.5.
Price action indicates a possible retracement to one of these Order Blocks before resuming the upward trend. The ultimate target levels for the bullish movement are marked around 1.35214 and 1.35297, which lie above a recent weak high.
This plan highlights a patient approach, suggesting waiting for price to reach these Order Blocks for optimal entry opportunities with clear risk management levels, aiming to capitalize on the continuation of the bullish trend from the strong LTF Demand Zone.

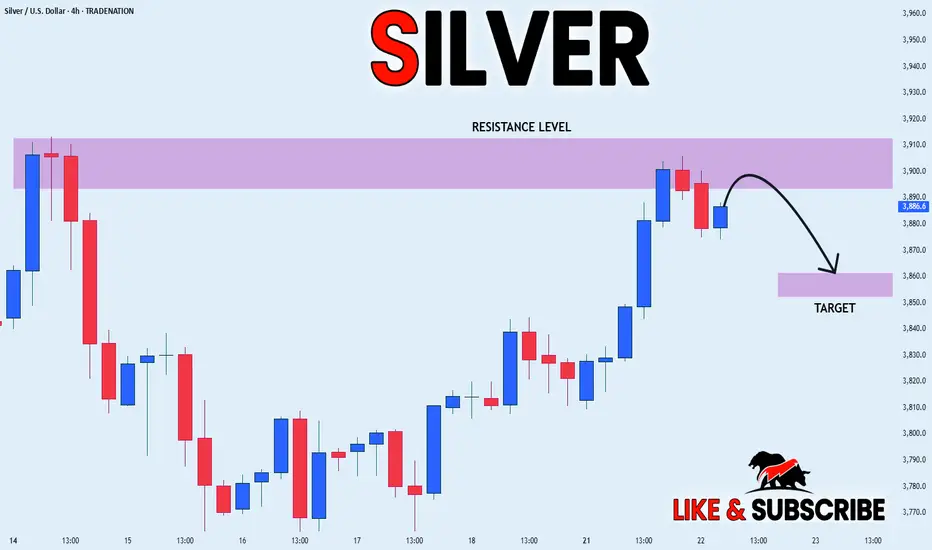
SILVER LOCAL SHORT|
✅SILVER has retested a key resistance level of 39.10$
And as the pair is already making a bearish pullback
A move down to retest the demand level below at 38.61$ is likely
SHORT🔥
✅Like and subscribe to never miss a new idea!✅
Disclosure: I am part of Trade Nation's Influencer program and receive a monthly fee for using their TradingView charts in my analysis.
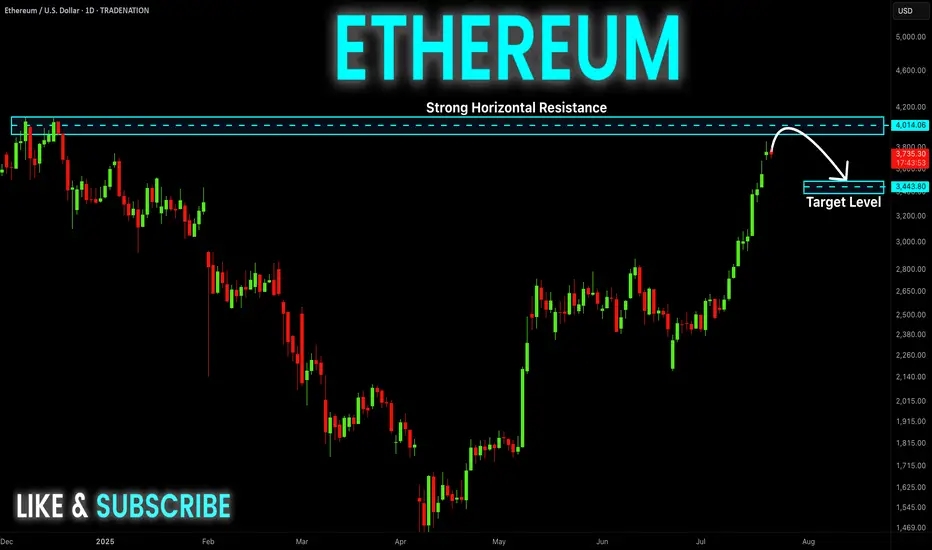
ETHEREUM Resistance Ahead! Sell!
Hello,Traders!
ETHEREUM is trading in a strong
Uptrend and the coin has grown
By more than 70% since the last low
So the coin is locally overbought
And after it retest the horizontal
Resistance of 4100$ we will be
Expecting a local bearish correction
Sell!
Comment and subscribe to help us grow!
Check out other forecasts below too!
Disclosure: I am part of Trade Nation's Influencer program and receive a monthly fee for using their TradingView charts in my analysis.
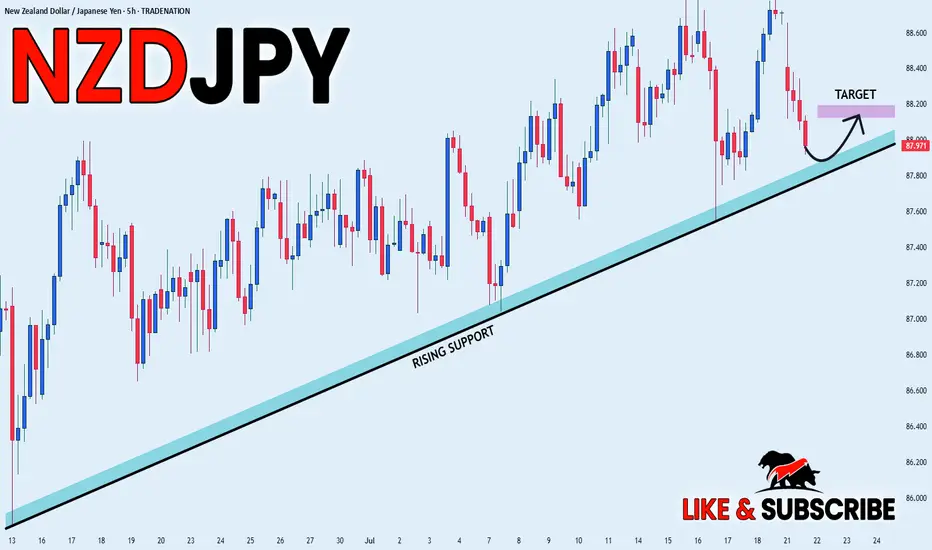
NZD_JPY RISING SUPPORT AHEAD|LONG|
✅NZD_JPY went down from
The resistance just as I predicted
In my previous analysis but now
The pair is approaching a rising
Support line from where we will
Be expecting a local bullish rebound
LONG🚀
✅Like and subscribe to never miss a new idea!✅
Disclosure: I am part of Trade Nation's Influencer program and receive a monthly fee for using their TradingView charts in my analysis.
USD-CHF Bearish Wedge! Sell!
Hello,Traders!
USD-CHF is trading in a
Downtrend and has formed
A bearish wedge pattern
So IF we see a breakout
Then we a further bearish
Continuation will be expected
Sell!
Comment and subscribe to help us grow!
Check out other forecasts below too!
Disclosure: I am part of Trade Nation's Influencer program and receive a monthly fee for using their TradingView charts in my analysis.

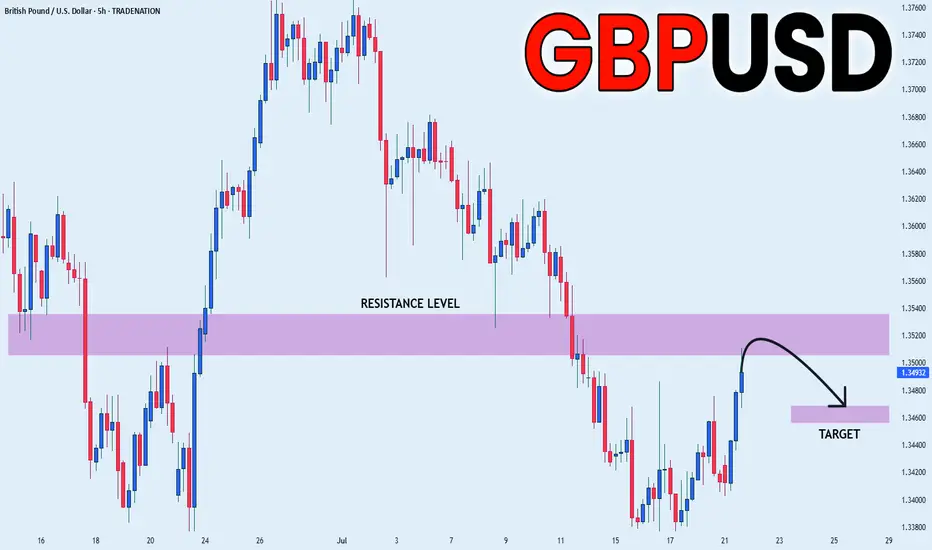
GBP_USD RESISTANCE AHEAD|SHORT|
✅GBP_USD has been growing recently
And the pair seems locally overbought
So as the pair is approaching
A horizontal resistance of 1.3520
Price decline is to be expected
SHORT🔥
✅Like and subscribe to never miss a new idea!✅
Disclosure: I am part of Trade Nation's Influencer program and receive a monthly fee for using their TradingView charts in my analysis.
XAUUSD Trade Idea - 30m Structure with 4H ConfluenceCurrently, price is trading below the 4H descending trendline, respecting bearish structure on lower timeframe (30m).
✅ 1H Order Block (OB) marked between 3335-3340 remains a strong demand zone where price can bounce break the trendline to sweep liquidity above around 3377 to form bullish continuation.
📌 Scenarios I'm Watching:
Short-term rejection from the 4H trendline.
Potential reversal towards 1H OB.
Bullish reaction from OB could trigger a breakout above the 4H trendline.
Final upside target remains at the liquidity pool around 3377 zone ($$$).
🟣 Overall Bias: Bullish after liquidity sweep. Watching for bullish confirmation at OB before executing buys.

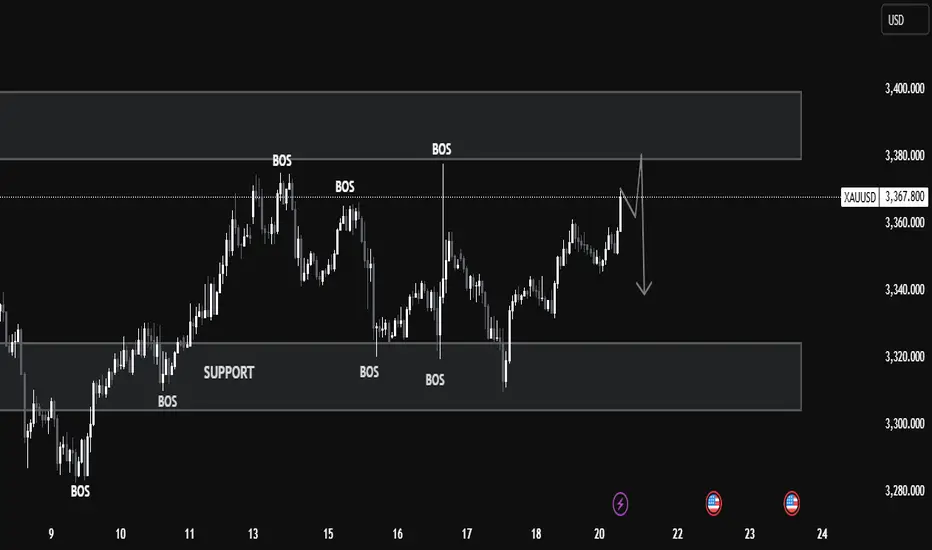
Smart Money Concepts in Action: XAUUSD Tests Strong Resistance Market Context and Structure
On the 1-hour chart, XAUUSD (Gold) has been in a bullish market structure, forming consecutive Breaks of Structure (BOS)—a clear sign of buying pressure and upward momentum. These BOS points mark moments when the market forms new highs, confirming bullish continuation.
However, as price approaches the 3370–3380 zone, it reaches a well-defined resistance/supply area. This zone has previously rejected price and can be viewed as a region where institutional selling may occur.
🧠 Smart Money and Liquidity Concepts
From a Smart Money Concepts (SMC) perspective, price often moves to areas of liquidity—zones where buy stops (above highs) or sell stops (below lows) are collected. In this chart:
Price pushes up towards 3370, potentially grabbing liquidity above recent highs.
This move could be a liquidity sweep, where the market fakes a breakout to trap retail traders before reversing.
Such behavior often occurs near institutional zones, suggesting a possible distribution phase—where large players offload positions before a move in the opposite direction.
⚙️ Resistance Analysis: Why 3370 Matters
The 3370–3380 area has acted as a ceiling in the past.
Price is currently reacting near this level, showing early signs of rejection.
This zone aligns with previous order blocks, where institutions may have placed sell orders.
In educational terms, this shows how supply zones can act as natural turning points in a market, especially when price approaches them after an extended move.
📦 Support & Potential Downside
If a reversal happens from this resistance, the next key support zone lies between 3300–3320. This level has historically acted as demand and could be revisited for price rebalancing or order filling.
📝 Educational Summary
This XAUUSD chart provides a great learning opportunity in observing:
How Break of Structure (BOS) confirms trend direction.
The role of liquidity zones in trapping retail traders.
How smart money operates around key levels like 3370.
The importance of combining structure, zones, and reaction for confluence.
EURUSD - M15 Supply Zone RetestThe current price action shows that the market is expected to first fill the Fair Value Gap (FVG) area, which acts as a price inefficiency zone demanding liquidity clearance. After the FVG is filled, the price is anticipated to retest the Higher Time Frame (HTF) Supply Zone, which serves as a strong resistance area.
Following the retest of the supply zone, the prevailing downtrend is likely to resume, pushing the price downwards towards the HTF Demand Zone. This demand zone is identified as a key support level where buying interest is expected to emerge, potentially halting the decline temporarily or initiating a reversal.
This trading plan emphasizes waiting patiently for the FVG fill as a prerequisite step before looking for a supply zone retest confirmation to enter short positions targeting the demand zone below, aligning with the overall bearish trend continuation.

GBPJPY 15-Minute Analysis with Supply and Demand Zones1. Market Context
The price recently experienced a strong upward move followed by a rejection at the Higher Time Frame (HTF) Supply Zone near the 200.051 level.
Key levels have been identified including an HTF Supply Zone (resistance area) and HTF Demand Zone (support area).
2. Price Structure and Key Levels
The chart marks a weak high (x-weak high) near the supply zone which indicates possible exhaustion of upward momentum.
A break of structure (x-bos) was followed by a retracement to the supply zone.
The HTF Demand Zone around 198.070 marks a strong support area from which price might potentially rebound.
3. Trading Plan and Execution
Entry: Consider a short (sell) position near the HTF Supply Zone (around 199.8 to 200.05) after confirmation of bearish rejection or reversal patterns.
Target: Set the take profit near the HTF Demand Zone (around 198.07), which represents a strong support level.
Stop Loss: Place a stop loss just above the HTF Supply Zone to protect against unexpected breakouts.
Trade Management: Expect a possible retest or small pullback after the initial move from the supply zone before continuing the downward trend.
4. Outlook and Strategy
The primary expectation is a downward movement from the supply zone to the demand zone.
Watch for price action cues such as bearish engulfing candles or strong rejection wicks at the supply zone to confirm entry.
If price breaks above the HTF Supply Zone strongly, reconsider the bearish bias for possible trend shifts.

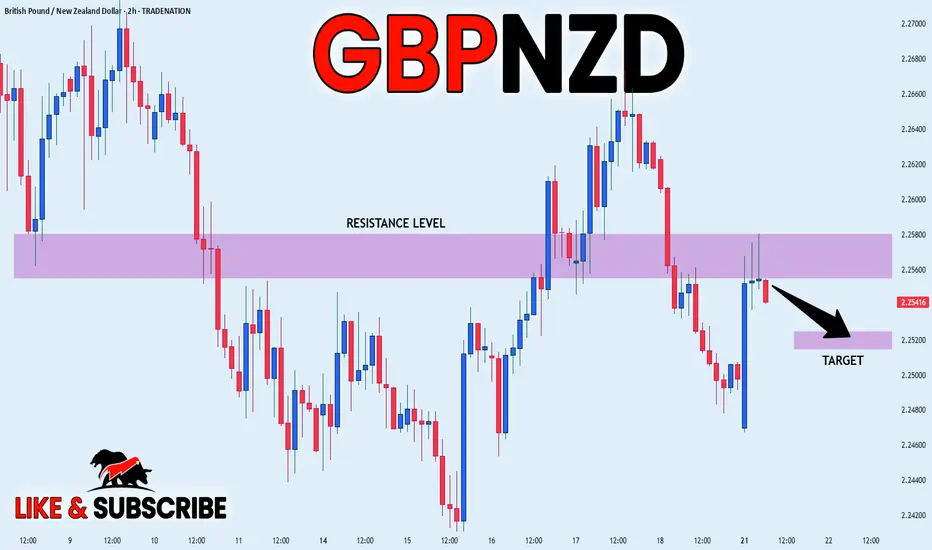
GBP_NZD LOCAL SHORT|
✅GBP_NZD made a retest of the
Local horizontal resistance level of 2.2580
And as you can see the pair is already
Making a local pullback from
The level which sends a clear
Bearish signal to us therefore
We will be expecting a
Further bearish correction
SHORT🔥
✅Like and subscribe to never miss a new idea!✅
Disclosure: I am part of Trade Nation's Influencer program and receive a monthly fee for using their TradingView charts in my analysis.
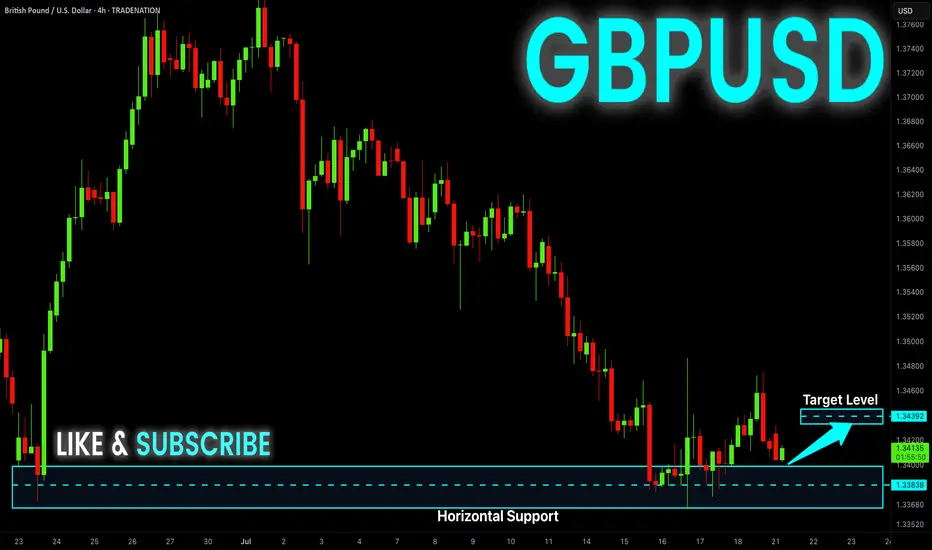
GBP-USD Local Long! Buy!
Hello,Traders!
GBP-USD is about to retest
The horizontal support
Level below at 1.3383
And as this is a strong
Support level we will be
Expecting a local bullish
Rebound and a move up
Buy!
Comment and subscribe to help us grow!
Check out other forecasts below too!
Disclosure: I am part of Trade Nation's Influencer program and receive a monthly fee for using their TradingView charts in my analysis.
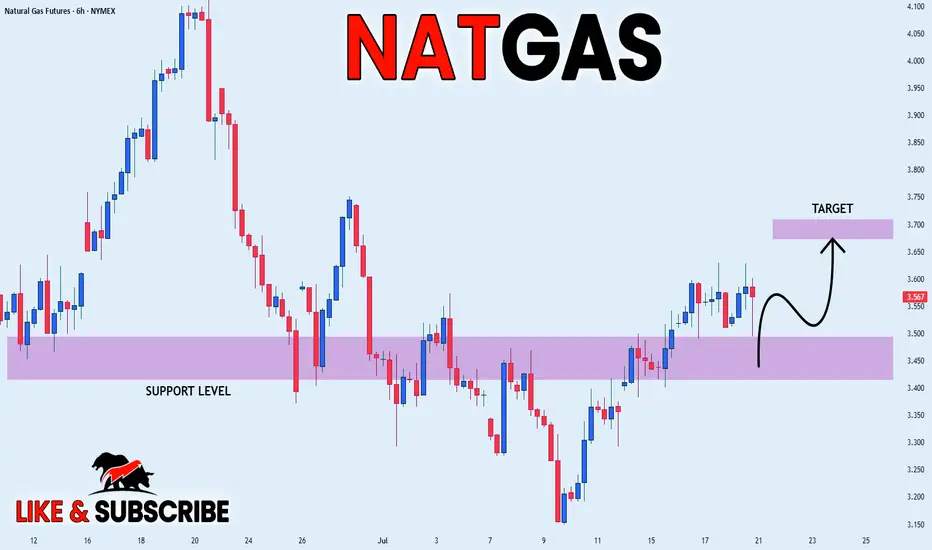
NATGAS REBOUND AHEAD|LONG|
✅NATGAS is going up now
And the price made a bullish
Rebound from the horizontal
Support level around 3.50$
So we are bullish biased and
We will be expecting a
Further bullish move up
LONG🚀
✅Like and subscribe to never miss a new idea!✅
Disclosure: I am part of Trade Nation's Influencer program and receive a monthly fee for using their TradingView charts in my analysis.
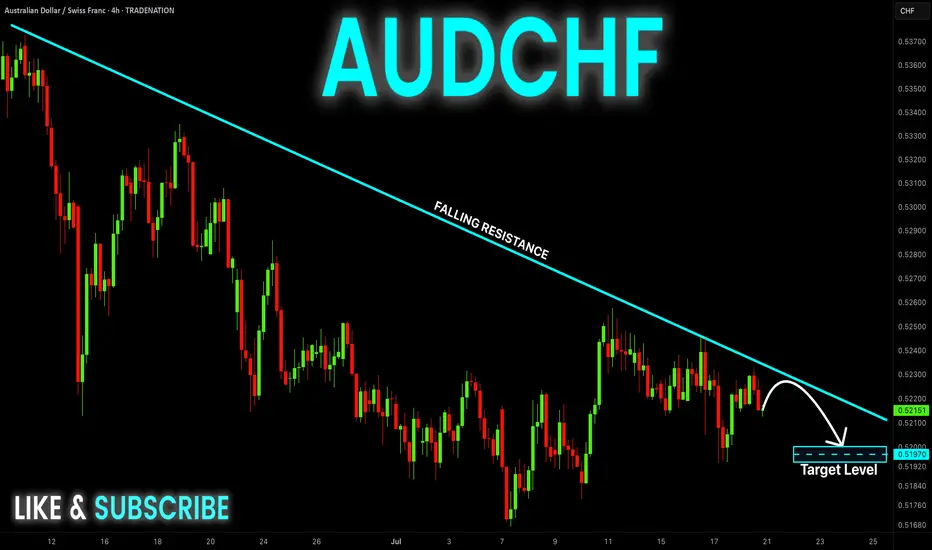
AUD-CHF Risky Short From Falling Resistance! Sell!
Hello,Traders!
AUD-CHF is trading in a
Downtrend along the falling
Resistance line so we are
Bearish biased and after
The potential retest of the
Falling resistance we will
Be expecting a further
Bearish move down
Sell!
Comment and subscribe to help us grow!
Check out other forecasts below too!
Disclosure: I am part of Trade Nation's Influencer program and receive a monthly fee for using their TradingView charts in my analysis.
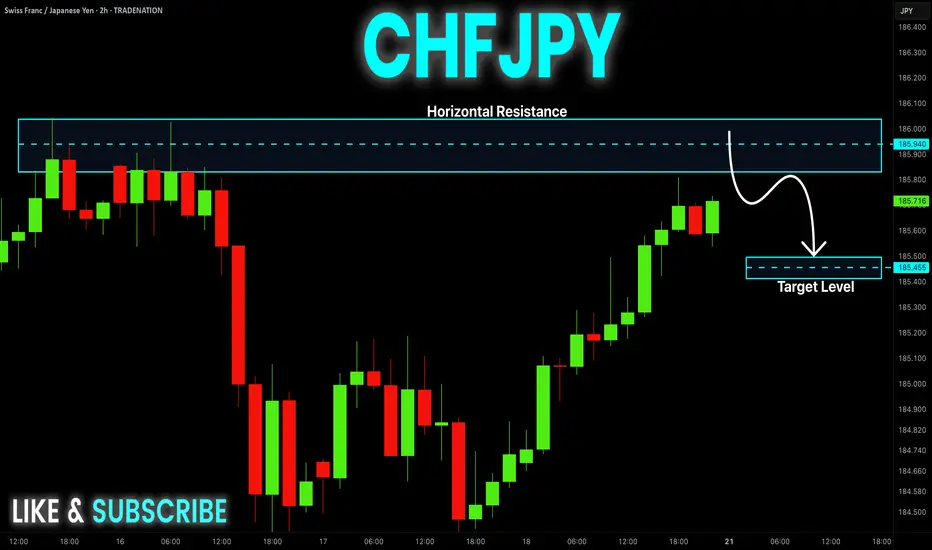
CHF-JPY Resistance Ahead! Sell!
Hello,Traders!
CHF-JPY keeps growing in
An uptrend and the pair is
Locally oversold so after the
Retest of the horizontal
Resistance of 186.000
From where we will be
Expecting a local bearish
Pullback on Monday
Sell!
Comment and subscribe to help us grow!
Check out other forecasts below too!
Disclosure: I am part of Trade Nation's Influencer program and receive a monthly fee for using their TradingView charts in my analysis.
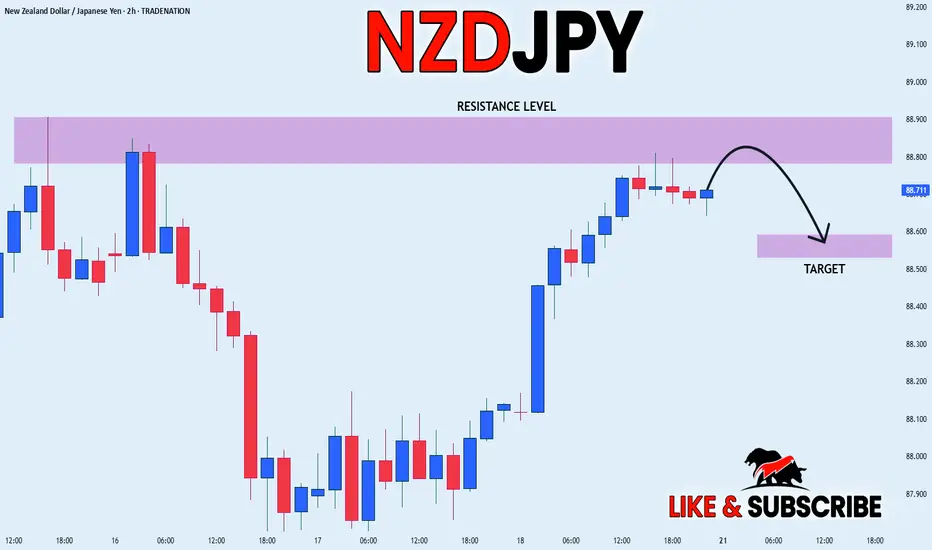
NZD_JPY PULLBACK EXPECTED|SHORT|
✅NZD_JPY has been growing recently
And the pair seems locally overbought
So as the pair has approached
A horizontal resistance of 88.900
Price fall is to be expected
SHORT🔥
✅Like and subscribe to never miss a new idea!✅
Disclosure: I am part of Trade Nation's Influencer program and receive a monthly fee for using their TradingView charts in my analysis.