USD-CAD Risky Short! Sell!
Hello,Traders!
USD-CAD is trading beneath
A wide strong horizontal
Resistance level around 1.4027
So after the retest we will
Be expecting a local
Bearish pullback and
A move down
Sell!
Comment and subscribe to help us grow!
Check out other forecasts below too!
Disclosure: I am part of Trade Nation's Influencer program and receive a monthly fee for using their TradingView charts in my analysis.
Smartmoneyconcept

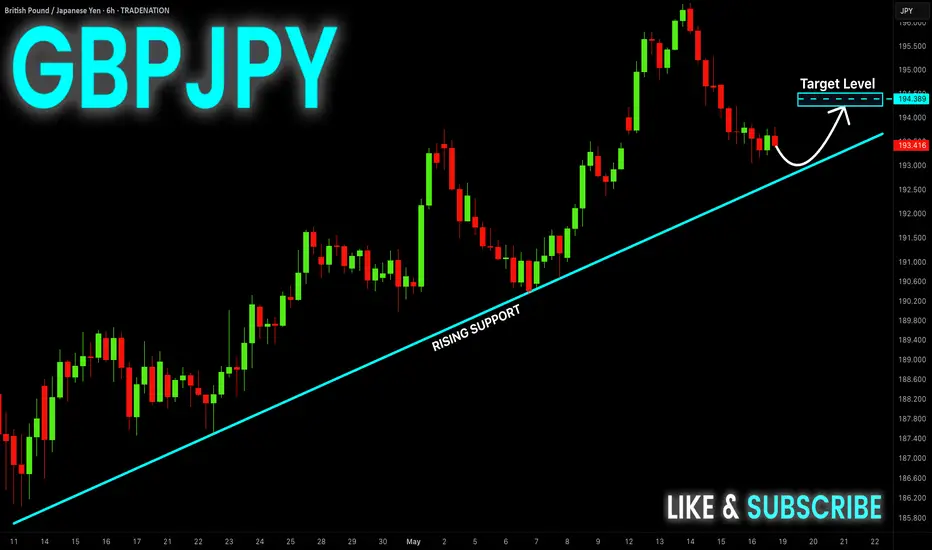
GBP_JPY GROWTH AHEAD|LONG|
✅GBP_JPY is going down now
But a strong support level is ahead
Thus I am expecting a rebound
And a move up towards the target above 194.000
LONG🚀
✅Like and subscribe to never miss a new idea!✅
Disclosure: I am part of Trade Nation's Influencer program and receive a monthly fee for using their TradingView charts in my analysis.
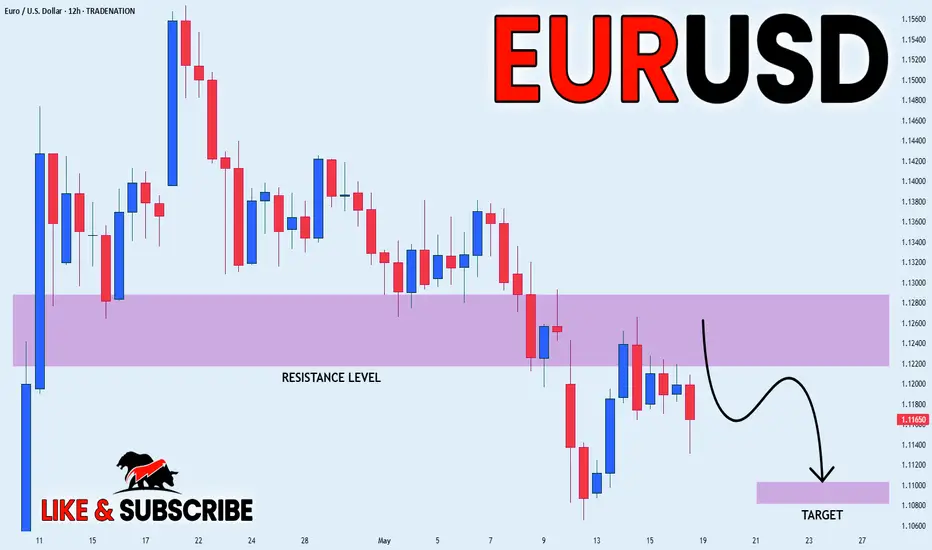
EUR-USD Bearish Bias! Sell!
Hello,Traders!
EUR-USD made a retest
Of the key horizontal level
Around 1.1255 and already
Made a pullback so we will
Be expecting a local
Bearish move down
Sell!
Comment and subscribe to help us grow!
Check out other forecasts below too!
Disclosure: I am part of Trade Nation's Influencer program and receive a monthly fee for using their TradingView charts in my analysis.
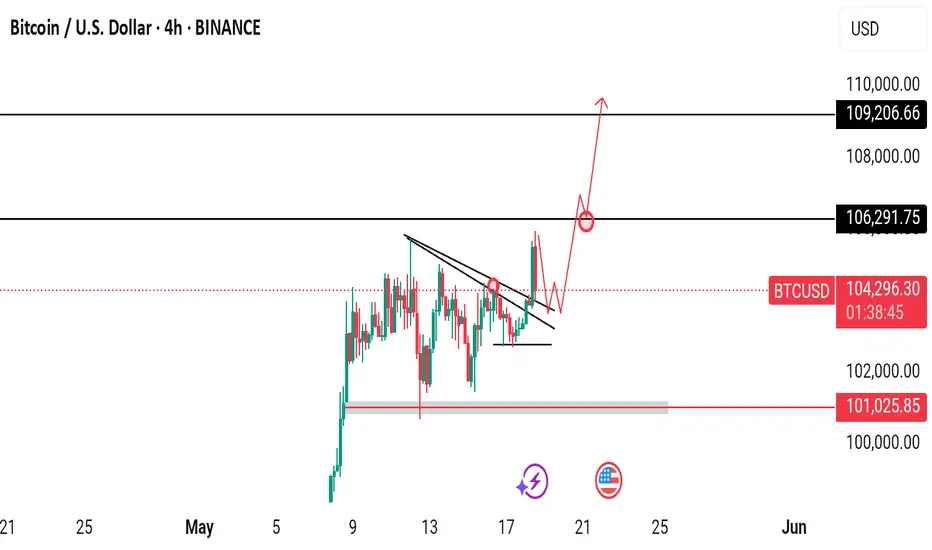
BTC Preparing for A Move Towards $110k Are You Ready?Bitcoin Market Update: BTC Preparing for a Move Towards 109,200 and 110,000 Levels
Bitcoin (BTC) appears to be gearing up for a potential upward move targeting the 109,200 to 110,000 price range. Over the past several days, Bitcoin has been consolidating within a tight range, indicating accumulation and market indecision. However, the latest price action has shown a strong bullish breakout, confirmed by a solid bullish candle, followed by a healthy retest of the breakout zone.
This retest suggests that Bitcoin may now be preparing for its next leg upward. The current price area presents a possible buying opportunity, especially as we approach the key black-marked zones on the chart. These levels are significant because they hold pending liquidity from previous days’ highs and also correspond to notable swing highs—areas where the market previously reversed.
Traders should remain alert and not miss this potential opportunity. It's crucial to monitor the market closely for any structural shifts or additional confirmation signals, such as bullish patterns, increased volume, or momentum indicators aligning with the upward trend.
As always, conduct your own research (DYOR) before making any trading decisions. Market conditions can change rapidly, and informed decisions backed by solid analysis are essential for successful trading.
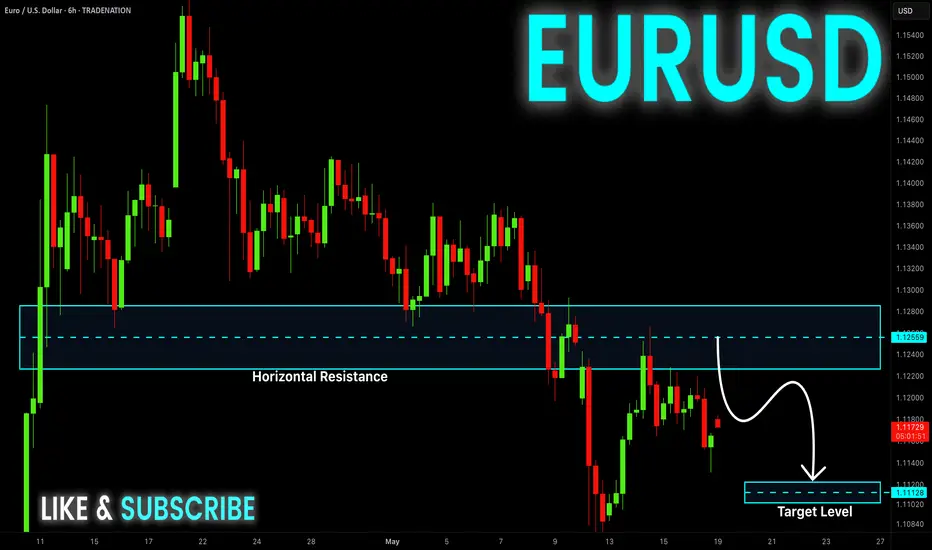
EUR_USD WILL GO DOWN|SHORT|
✅EUR_USD made a bearish
Breakout of the key horizontal
Level around 1.1260 which is now
A resistance then made a
Retest and is going down now
So we are bearish biased and
We will be expecting a
Further bearish move down
SHORT🔥
✅Like and subscribe to never miss a new idea!✅
Disclosure: I am part of Trade Nation's Influencer program and receive a monthly fee for using their TradingView charts in my analysis.
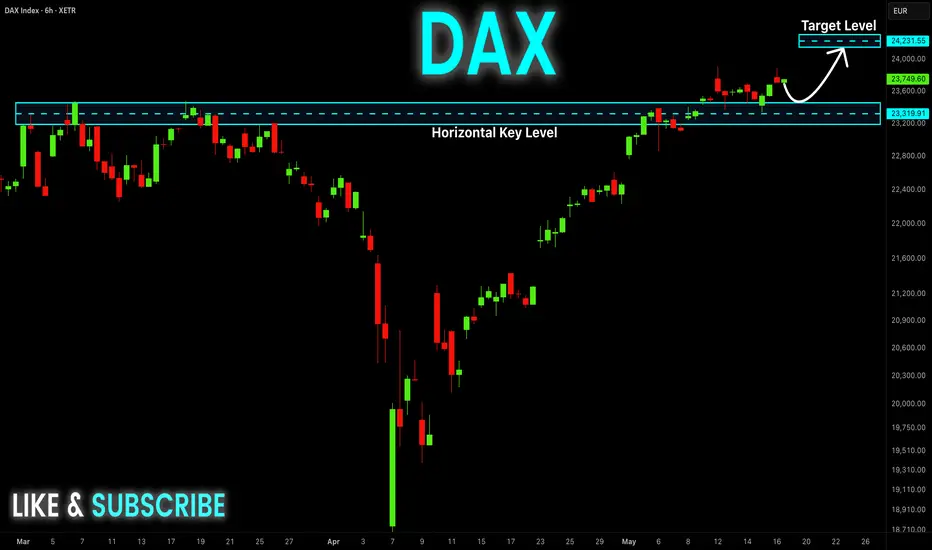
DAX Will Keep Growing! Buy!
Hello,Traders!
DAX broke the key horizontal
Level of 23,319 and the index
Made a pullback and retest
And is now going up again
So we are bullish biased
And we will be expecting
A further bullish move up
Buy!
Comment and subscribe to help us grow!
Check out other forecasts below too!
Disclosure: I am part of Trade Nation's Influencer program and receive a monthly fee for using their TradingView charts in my analysis.
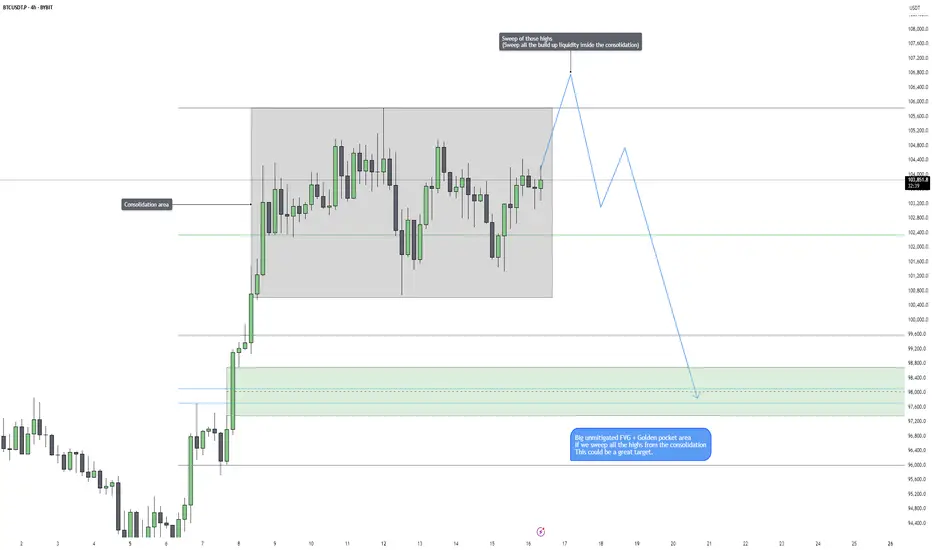
Bitcoin – Sweep the Highs, Next Target $98kMarket Overview
Bitcoin has been trading sideways for more than 8 days now, forming a tight consolidation range with no real breakout in sight. This kind of price action typically signals accumulation or distribution by larger players. While it may seem indecisive on the surface, this phase is often where the market sets its trap. What looks like inaction is actually a setup in progress. Price is compressing, volume is thinning out, and both bulls and bears are being lured in. That’s a perfect recipe for a sudden, aggressive move that wipes out one side entirely.
Liquidity Structure
The structure of this range is very clean, which in trading terms usually means dangerous. On the top side, we have a lot of liquidity, just above $105,800. This level has been tapped multiple times but never convincingly broken, and it now acts as a magnet for liquidity. On the flip side, the downside holds multiple clean lows, all clustered under the $100,000 mark. Both ends of this range are packed with liquidity. Smart money doesn’t trade in fair value, it trades where the most liquidity sits, and in this case, both the top and bottom of the range are loaded.
Inducement and Manipulation
The real purpose of this kind of range is not balance, it’s inducement. The market is inviting traders to take breakout positions on both sides, knowing full well that it’s unlikely to follow through cleanly. I believe we are currently in the inducement phase of the cycle. The equal highs around $105,800 are baiting breakout longs and short stop-losses alike. A move above that level would act as the stop hunt, triggering the final wave of longs before the rug is pulled. Once that liquidity is taken, I expect a sharp reversal that targets the lows of the range and continues further toward the real pool of liquidity sitting between $98,000 and $97,500.
Scenario Outlook
The most probable sequence from here is a fake breakout to the upside, followed by an impulsive selloff. A wick above $105,800 would serve as the signal, and once that inducement is cleared, the move down should be fast and decisive. This drop would take out the range lows and sweep the stops of everyone who tried to buy the breakout. If price does hold above $105,800 and shows continuation with strong volume and follow-through, that would be an invalidation of this short setup and a shift in structure, in which case I would reassess and wait for a pullback before considering any longs.
Price Target and Expectations
The first key event is the sweep above $105,800. That’s where breakout traders will commit, and that’s where I expect the reversal to begin. From there, downside targets include the low of the range and deeper liquidity near $98,000 to $97,500. This area aligns with a big imbalance zone, inefficiencies and the golden pocket fib level.. The expectation is for a quick drop once the trap is sprung, with a potential for a reaction or even a new bullish setup forming near that demand region.
Conclusion
Bitcoin has been compressing for over a week, and that usually ends with expansion. But expansion is not always trend continuation, especially when the structure suggests manipulation. The current setup looks ideal for a stop run above the range before dumping into deeper liquidity. The key is to wait for the sweep and watch how price reacts. The more obvious the breakout, the more likely it is to fail. Liquidity is king in this environment, and right now, the biggest pockets lie below.
___________________________________
Thanks for your support!
If you found this idea helpful or learned something new, drop a like 👍 and leave a comment, I’d love to hear your thoughts! 🚀
Make sure to follow me for more price action insights, free indicators, and trading strategies. Let’s grow and trade smarter together! 📈
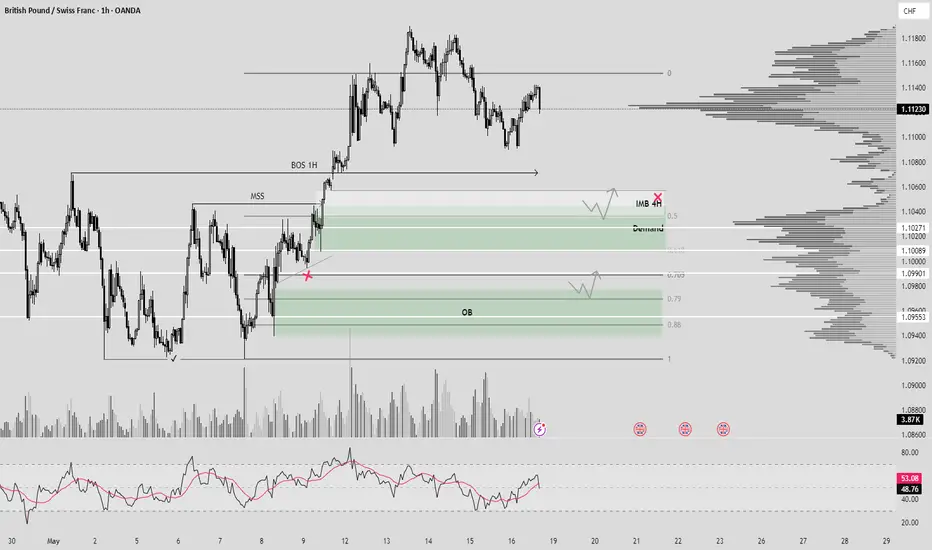
GBPCHF (MSS + DEMAND + OTE + 0.5 FIB)Hello Traders!
We have 2 strong zone for buying:
1) Unmitigated Demand + MSS + OTE
2) OB with Inducement.
Both scenario are valid in my opinion.
Have a profitable day and don't forget to subscribe for updates!
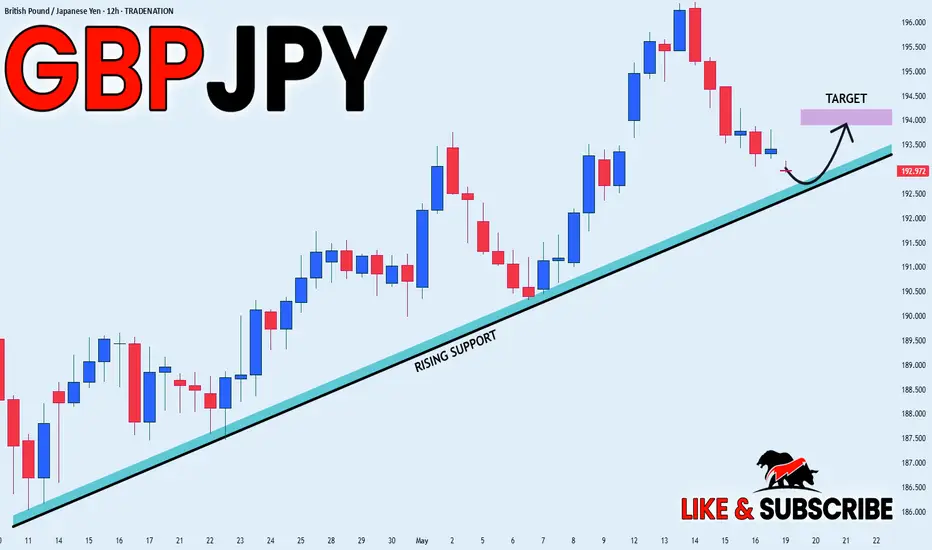
GBP-JPY Long From Rising Support! Buy!
Hello,Traders!
GBP-JPY is trading along
The rising support line
And the pair will soon hit
A trend-line from where we
Will be expecting a local
Bullish rebound and a
Further bullish move up
Buy!
Comment and subscribe to help us grow!
Check out other forecasts below too!
Disclosure: I am part of Trade Nation's Influencer program and receive a monthly fee for using their TradingView charts in my analysis.
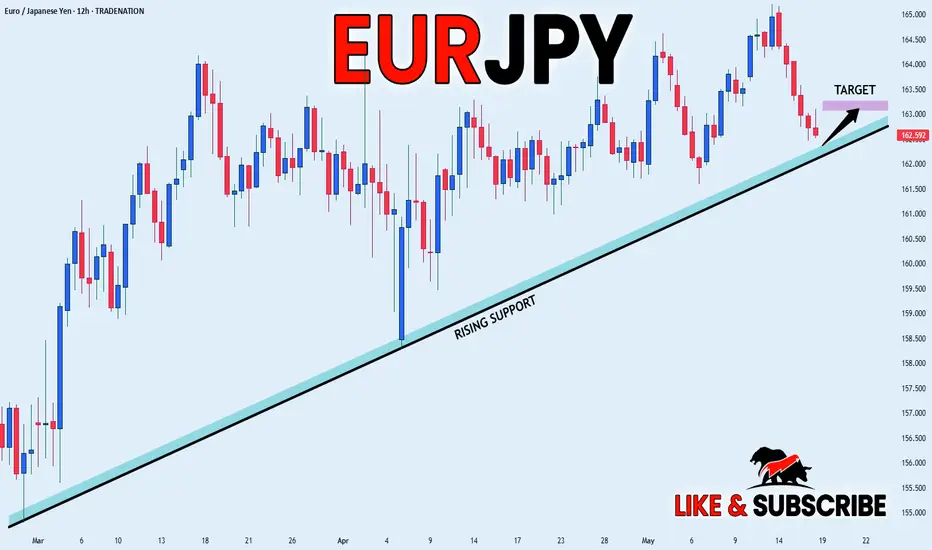
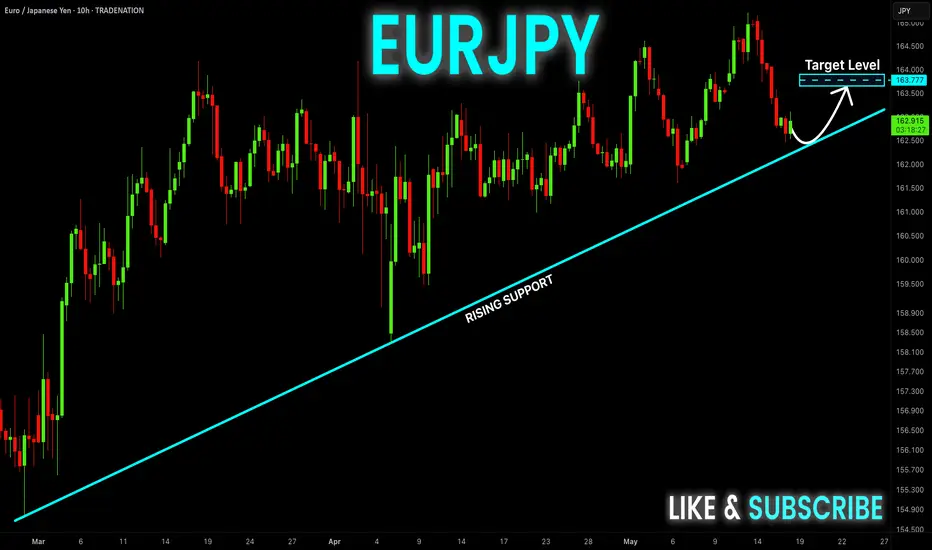
EUR_JPY LOCAL LONG|
✅EUR_JPY is trading in an uptrend
With the pair set to retest
The rising support line
From where I think the growth will continue
LONG🚀
✅Like and subscribe to never miss a new idea!✅
Disclosure: I am part of Trade Nation's Influencer program and receive a monthly fee for using their TradingView charts in my analysis.
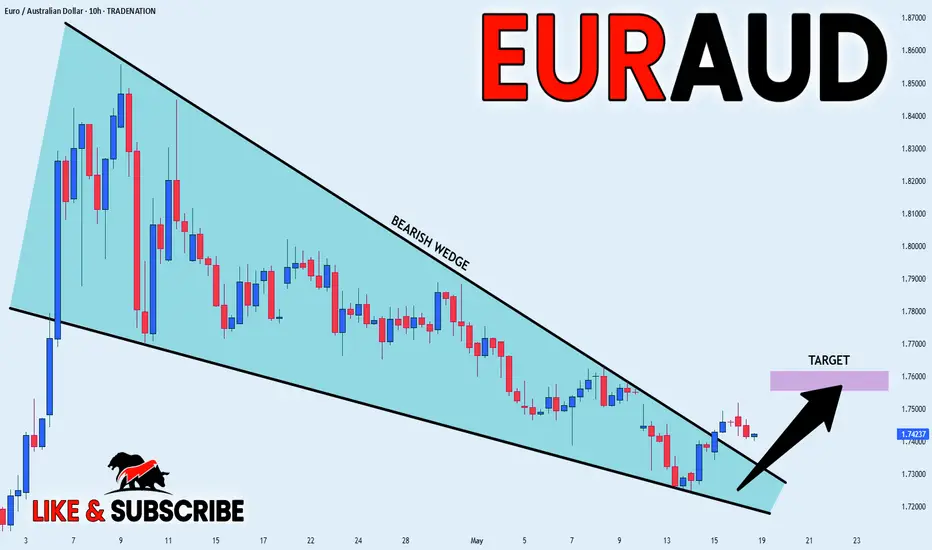
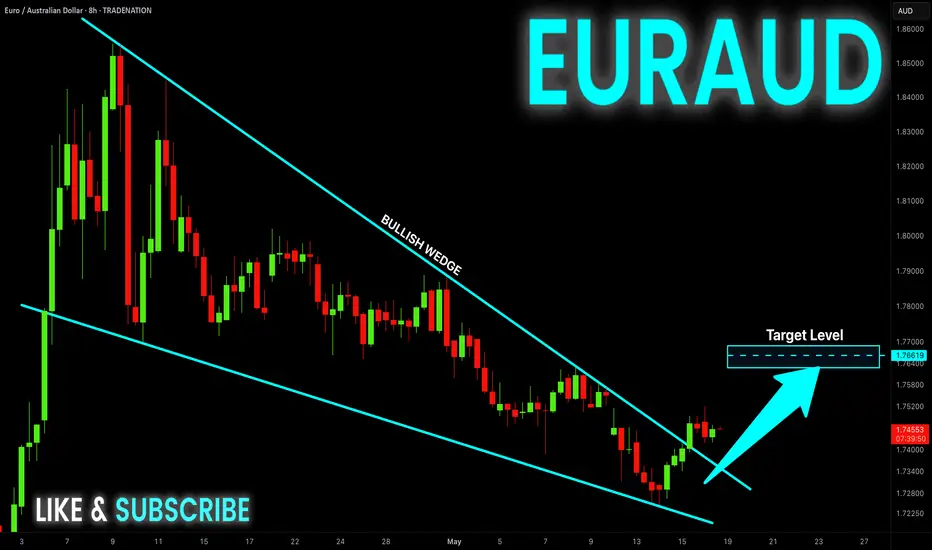
EUR_AUD BULLISH WEDGE|LONG|
✅EUR_AUD made a bullish
Breakout from the bullish
Wedge pattern and the
Breakout is confirmed so
We are bullish biased and
We will be expecting a
Further bullish move up
On Monday when the
Market reopens
LONG🚀
✅Like and subscribe to never miss a new idea!✅
Disclosure: I am part of Trade Nation's Influencer program and receive a monthly fee for using their TradingView charts in my analysis.
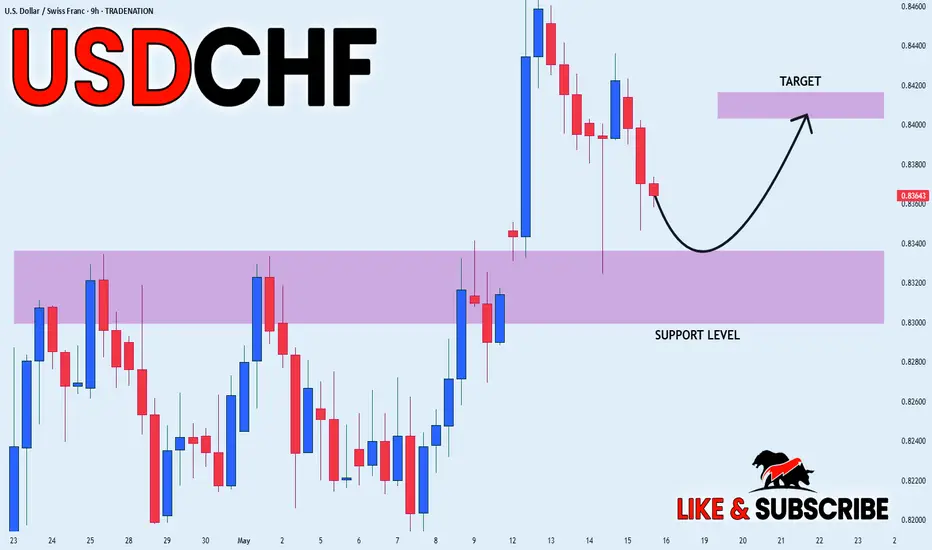
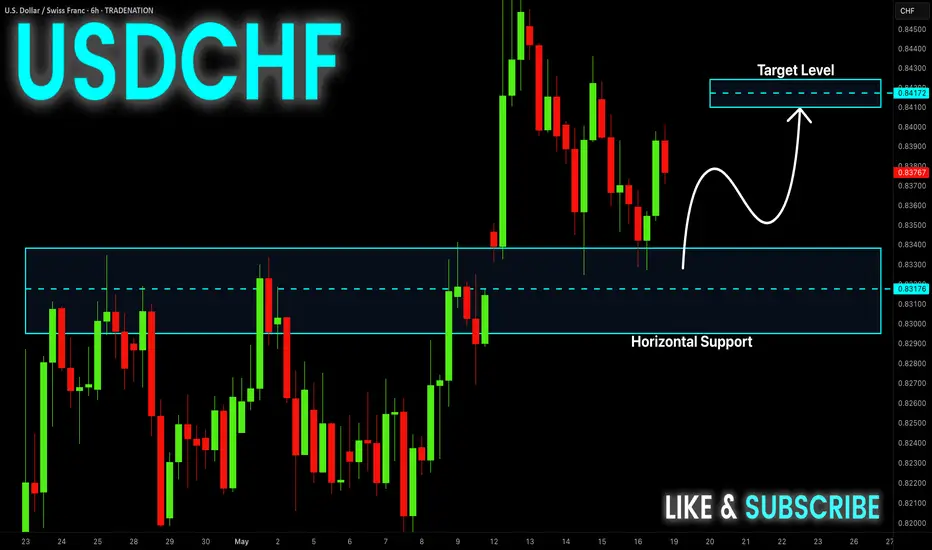
USD-CHF Growth Ahead! Buy!
Hello,Traders!
USD-CHF made a bullish
Rebound from the horizontal
Support level around 0.8318
So we are locally bullish
Biased and we will be
Expecting further growth
On Monday
Buy!
Comment and subscribe to help us grow!
Check out other forecasts below too!
Disclosure: I am part of Trade Nation's Influencer program and receive a monthly fee for using their TradingView charts in my analysis.
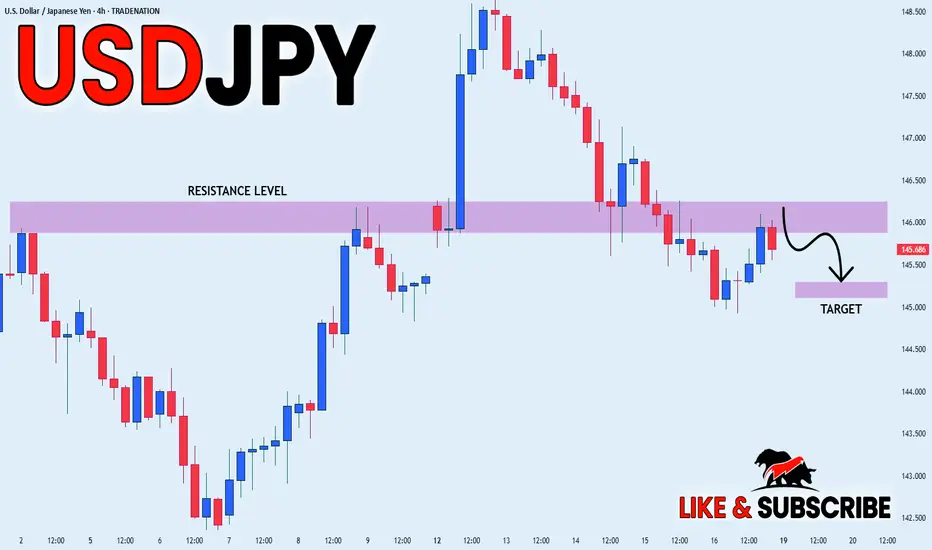
USD_JPY RISKY SHORT|
✅USD_JPY made a bearish
Breakout of the key horizontal
Level of 146.133 which is a
Resistance now and the pair
Is now making a pullback
But as we are bearish biased
We will be expecting a move
Down after the pair retests
The new resistance
SHORT🔥
✅Like and subscribe to never miss a new idea!✅
Disclosure: I am part of Trade Nation's Influencer program and receive a monthly fee for using their TradingView charts in my analysis.
AUD-USD Potential Long! Buy!
Hello,Traders!
AUD-USD is making a local
Bearish correction but the
Pair will soon hit a horizontal
Support level of 0.6358 from
Where we will be expecting
A local rebound and a move up
Buy!
Comment and subscribe to help us grow!
Check out other forecasts below too!
Disclosure: I am part of Trade Nation's Influencer program and receive a monthly fee for using their TradingView charts in my analysis.

EUR_CHF LOCAL LONG|
✅EUR_CHF is trading along the rising support
And as the pair will soon retest it
I am expecting the price to go up
To retest the supply levels above of 0.9360
LONG🚀
✅Like and subscribe to never miss a new idea!✅
Disclosure: I am part of Trade Nation's Influencer program and receive a monthly fee for using their TradingView charts in my analysis.

EURUSD – Rebalancing Before Repricing HigherEURUSD is currently trading within a corrective phase after failing to sustain its bullish momentum from the earlier impulsive rally. The market structure on the 1-hour chart shows a clean breakdown from recent highs, with sellers starting to step in more aggressively. This pullback feels more like a calculated retracement than a complete trend reversal, and the market may be seeking out a deeper discount before any continuation higher. With multiple rejections forming at lower highs and downside pressure increasing, it looks like EURUSD wants to drive lower first before making a run for higher levels.
Consolidation Structure
We’ve been consolidating after the last upward push, forming a short-term range with price grinding sideways but gradually bleeding lower. What stands out is the clear cluster of equal lows forming, acting as obvious sell-side liquidity. Just below that area sits a 1-hour fair value gap that remains unmitigated, offering a strong magnet for price. The FVG sits just beneath the golden pocket zone, which adds more confluence for a potential reaction from that area. This range looks designed to draw in early buyers, only to flush them out before price finds real support.
Bearish Scenario – Setup for a Deeper Retracement
Right now, the structure leans bearish in the short term. The market looks like it wants to run the lows and wick into the 1-hour fair value gap sitting below the golden pocket. This area is an unmitigated imbalance that lines up perfectly with the idea of a final liquidity grab. I’m expecting price to reach down into that gap, around the 1.112 region, before any kind of reversal occurs. The goal of this move would be to clear out stops and rebalance the inefficiency from the previous rally, setting the stage for the next leg higher.
Bullish Scenario – Reversal from Discount
Once price trades into the 1.112 zone and sweeps the current lows, the setup for a bullish reversal becomes much cleaner. That area offers a combination of liquidity, inefficiency, and fib confluence, making it a high-probability level for buyers to step back in. If we get a solid rejection or displacement out of that level, the upside potential opens up quickly. The idea is that after this corrective move and stop hunt, the market reclaims momentum and starts driving toward the next key structure zone.
Price Target and Expectations
If price delivers the expected sweep and mitigation into 1.112, I’ll be looking for confirmation of bullish intent and signs of strength to enter long. The target sits much higher, all the way at the 0.28 fib level, which is around 1.20. That level offers a logical take-profit zone based on fib projection and structure alignment. The potential reward-to-risk on this move is excellent if the entry holds and the displacement confirms. This would essentially be a play on manipulation and continuation, classic liquidity run before expansion.
Conclusion
EURUSD is setting up nicely for a textbook sweep-and-reverse play. The market is currently moving lower, and I’m expecting that move to extend into the 1-hour FVG just below the golden pocket, targeting an entry near 1.112. From there, if price reacts cleanly, the next leg should aim for the 0.28 fib level at 1.20. All the ingredients are there: a clean imbalance, obvious liquidity to take, and a higher-timeframe fib target to anchor the move. Just need to wait for price to do its job and follow the plan.
___________________________________
Thanks for your support!
If you found this idea helpful or learned something new, drop a like 👍 and leave a comment, I’d love to hear your thoughts! 🚀
Make sure to follow me for more price action insights, free indicators, and trading strategies. Let’s grow and trade smarter together! 📈

“XAU/USD Buy Setup | Breakout Retest with 3-Target Bullish StrucThe hope of this idea presents a bullish setup on Gold (XAU/USD) based on a breakout–retest structure with multi-session volatility for price action.
Strong recovery above the intraday consolidation zone near 3180-3183 breaks the sharp liquidity sweep beneath 3171. This aggressive recovery may suggest a fakeout and reversal whipsaw: a smart money signature.
🔹 Technical Rationale:
Entry Zone (3181-3183): Aligned with supply candles' base as well as minor demand zone order.
SL (3180): Structural support and bullish engulfing low just beneath.
TP1 (3187): Prior minor high.
TP2 (3190): Consolidation rejection zone around psychological approximate value.
TP3 (3192): High-value liquidity cluster and potential sweep zone above high.
The market has printed higher lows after the fakeout suggesting bullish continuation bias resulting the structure holding until 3180. With favorable R:R ratio and flexible structure, everything stays intact.
⚠️ Risk Note:
Confirmation based trend continuation idea. Strong volume sustaining move below 3180 invalidates the idea.
📈 The structure and set levels provide clean bounds to wait for market dynamics.

EUR-JPY Risky Long! Buy!
Hello,Traders!
EUR-JPY is trading along the
Rising support line and the
Pair will soon retest the
Support from where we will
Be expecting a bullish rebound
And a local move up
Buy!
Comment and subscribe to help us grow!
Check out other forecasts below too!
Disclosure: I am part of Trade Nation's Influencer program and receive a monthly fee for using their TradingView charts in my analysis.
EUR-AUD Bullish Breakout! Buy!
Hello,Traders!
EUR-AUD has formed a bullish
Wedge pattern and now we are
Seeing a bullish breakout which
Is confirmed so we are bullish
Biased and we will be expecting
A further bullish move up
Buy!
Comment and subscribe to help us grow!
Check out other forecasts below too!
Disclosure: I am part of Trade Nation's Influencer program and receive a monthly fee for using their TradingView charts in my analysis.
USDCAD (BOS 4H + Demand + OTE)Hello Traders!
We have BOS on 4H, in OTE zone - unmitigated Demand and OB. After closing IMB we can expect reversal. Demand can be also liquidity, because it is a reason to mitigate our OB.
Set alarms and wait for confirmation on LTF!
PS. Price must build liquidity to our POI, not impulse.
TP - new HH.
Have a profitable day and don't forget to subscribe for updates!

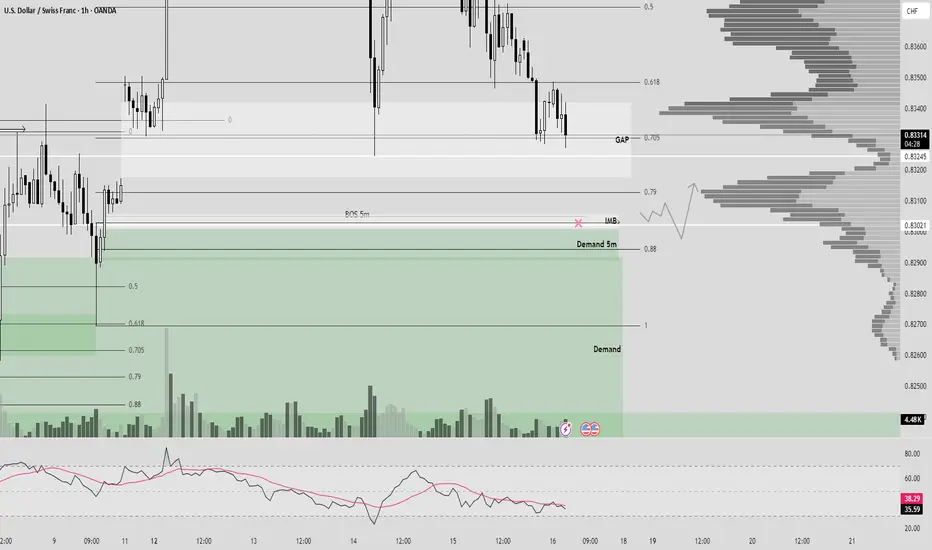
USDCHF 1H (BOS 5m + Demand 5m + IMB + OTE)Hello traders!
As you see price wants to close fully GAP. Near our POI(BOS 5m + Demand) - I expecting reversal from demand zone.
TP - MINIMUM to global GAP 1W.
Have a profitable day and don't forget to subscribe for updates!
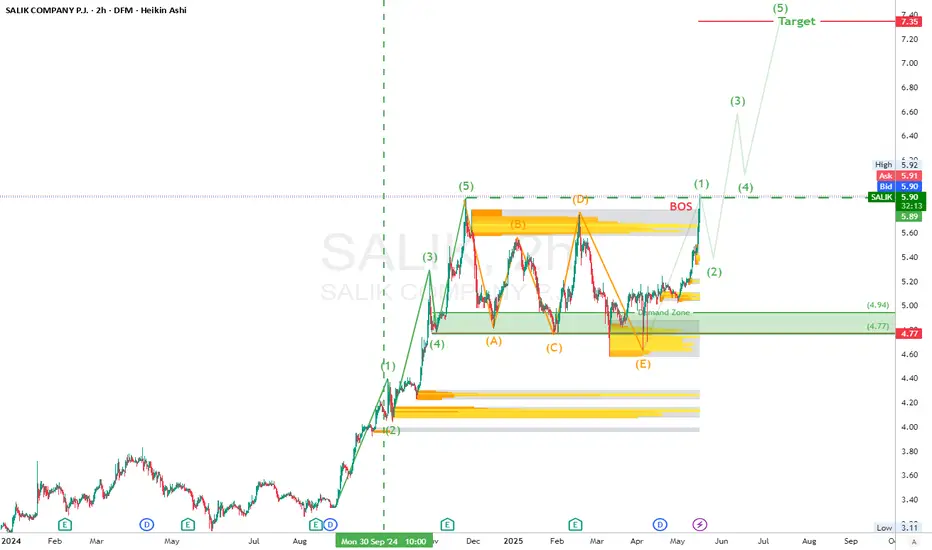
SALIK (DFM) BOS confirmed the bulls are back in charge### 🌀 **Elliott Wave Structure**
* The stock completed a textbook 5-wave impulse (1 → 5).
* Followed by a complex **ABCDE correction**, ending with a liquidity sweep on Wave (E).
* Current price action is a **bullish breakout** — likely the start of a **new impulsive cycle**.
### 📐 **Fibonacci Extension Target**
* **7.35 = 100% Fib extension** of previous impulse (Wave 1–5), projected from Wave (E).
## 🎯 **Trading Setup**
| **Entry** | Market @ 5.90 |
| **Stop Loss** | Below 4.75 (beneath main OB) |
| **Take Profit** | 7.35 (100% Fib extension ) |
| **R/R Ratio** | \~1:3.6 |
---
> “SALIK finally ripped through resistance like butter. BOS confirmed the bulls are back in charge. That 7.35 target? It’s not just a guess — it’s fib math.”
> *“Fibonacci is the map. Price is the vehicle. Volume is the fuel.”*
---
### ⚠️ **Disclaimer**
> This is not financial advice. For educational purposes only. Always manage risk and use stop losses. Past performance doesn’t guarantee future results.
USD_CHF LOCAL BULLISH BIAS|LONG|
✅USD_CHF is making a local
Bearish correction and will
Soon retest a horizontal
Support of 0.8320 from where
We will be expecting a
Local bullish rebound
And a move up
LONG🚀
✅Like and subscribe to never miss a new idea!✅
Disclosure: I am part of Trade Nation's Influencer program and receive a monthly fee for using their TradingView charts in my analysis.