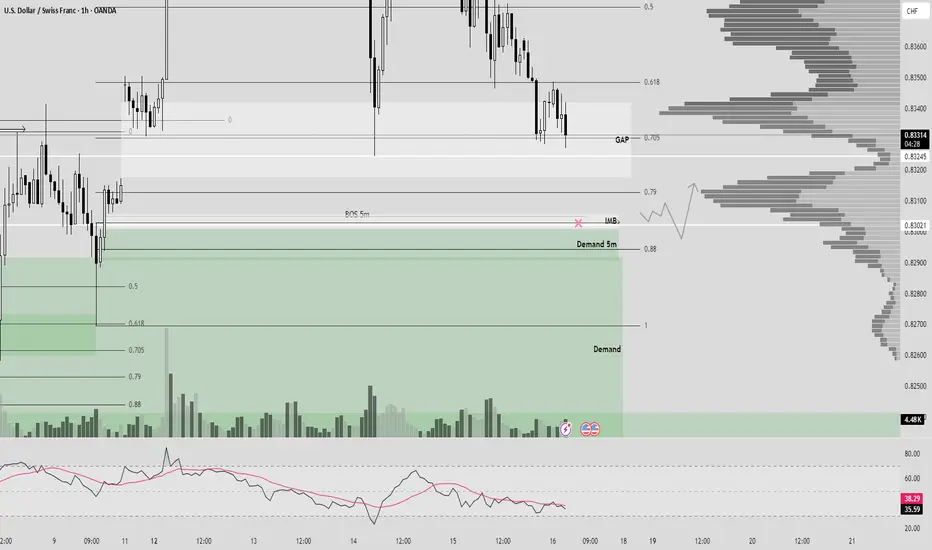
USDCHF 1H (BOS 5m + Demand 5m + IMB + OTE)Hello traders!
As you see price wants to close fully GAP. Near our POI(BOS 5m + Demand) - I expecting reversal from demand zone.
TP - MINIMUM to global GAP 1W.
Have a profitable day and don't forget to subscribe for updates!
Smartmoneyconcept
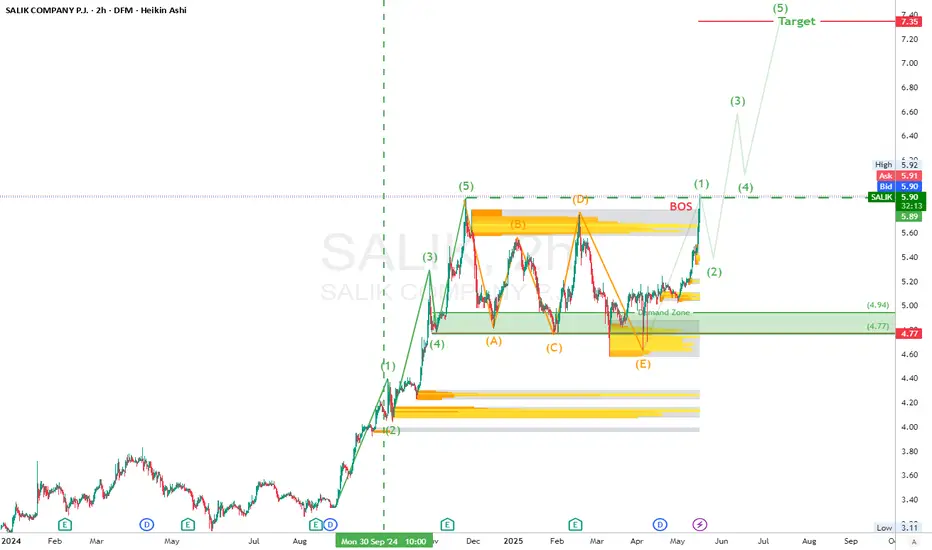
SALIK (DFM) BOS confirmed the bulls are back in charge### 🌀 **Elliott Wave Structure**
* The stock completed a textbook 5-wave impulse (1 → 5).
* Followed by a complex **ABCDE correction**, ending with a liquidity sweep on Wave (E).
* Current price action is a **bullish breakout** — likely the start of a **new impulsive cycle**.
### 📐 **Fibonacci Extension Target**
* **7.35 = 100% Fib extension** of previous impulse (Wave 1–5), projected from Wave (E).
## 🎯 **Trading Setup**
| **Entry** | Market @ 5.90 |
| **Stop Loss** | Below 4.75 (beneath main OB) |
| **Take Profit** | 7.35 (100% Fib extension ) |
| **R/R Ratio** | \~1:3.6 |
---
> “SALIK finally ripped through resistance like butter. BOS confirmed the bulls are back in charge. That 7.35 target? It’s not just a guess — it’s fib math.”
> *“Fibonacci is the map. Price is the vehicle. Volume is the fuel.”*
---
### ⚠️ **Disclaimer**
> This is not financial advice. For educational purposes only. Always manage risk and use stop losses. Past performance doesn’t guarantee future results.
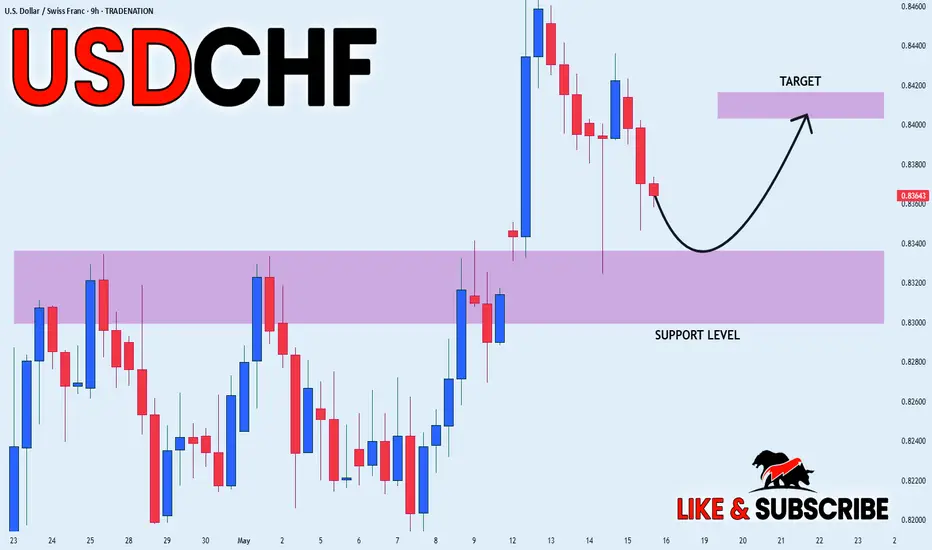
USD_CHF LOCAL BULLISH BIAS|LONG|
✅USD_CHF is making a local
Bearish correction and will
Soon retest a horizontal
Support of 0.8320 from where
We will be expecting a
Local bullish rebound
And a move up
LONG🚀
✅Like and subscribe to never miss a new idea!✅
Disclosure: I am part of Trade Nation's Influencer program and receive a monthly fee for using their TradingView charts in my analysis.
Bitcoin – Respecting $103k FVG, Approaching ATH.Bitcoin failed to fully fill the large 4h and 1h FVG around the $100,000 zone, front-running the level before bouncing sharply. This type of price behavior suggests strong demand, with buyers stepping in aggressively before the inefficiency could be completely mitigated. The market is now shifting back to a more bullish tone after establishing a short-term bottom near the key higher-timeframe FVG.
Consolidation Structure
The price action has been messy and range-bound over the past few days, stuck between the major 1h/4h demand zone around $102,000 and the $105,000 resistance level. Within that broader range, Bitcoin created a new 1h FVG on the push off the lows, which has already been respected intraday around the $103,000 area. That newly formed FVG now acts as short-term support as price grinds upward again toward the prior resistance.
Bullish/Bearish Scenarios
On the bullish side, if Bitcoin flips the $104,500 to $105,000 resistance area cleanly into support with a convincing displacement and consolidation above it, there’s a good chance it will break out and target higher inefficiencies above $106,000. That would confirm buyers are in full control and using each FVG as a stepping stone higher.
However, if price gets rejected again inside the resistance zone without showing signs of strength or accumulation just below it, we could see another rotation lower back to the $100,000 FVG or potentially even a deeper retest of the broader $97,500 area. A rejection at the highs could align with a sweep of local buy-side liquidity and serve as a trigger for a short-term reversal.
Price Target and Expectations
Upside breakout targets sit around $106,200 and higher, based on the previous price inefficiencies and trend structure. On the downside, if we see rejection, price may revisit $100,000 and possibly test the deeper 4h imbalance zone closer to $97,500 again.
Current Stance
For now, price is trading inside the upper portion of the range and grinding into a known resistance area. There’s no clear confirmation yet of either a breakout or rejection, so the next move depends heavily on how price reacts within the $104,500 to $105,000 zone. Watching for either bullish continuation (with a clean flip and hold above) or a strong rejection setup for a possible fade back into the midrange.
Conclusion
Bitcoin continues to respect FVGs both to the downside and upside. The bounce from the 1h/4h demand confirms higher timeframe interest, and the respect of the new 1h FVG around $103,000 shows short-term strength. The next major decision point is the $105,000 resistance. A clean break and flip could signal continuation, while rejection there may trap longs and send price back toward demand.

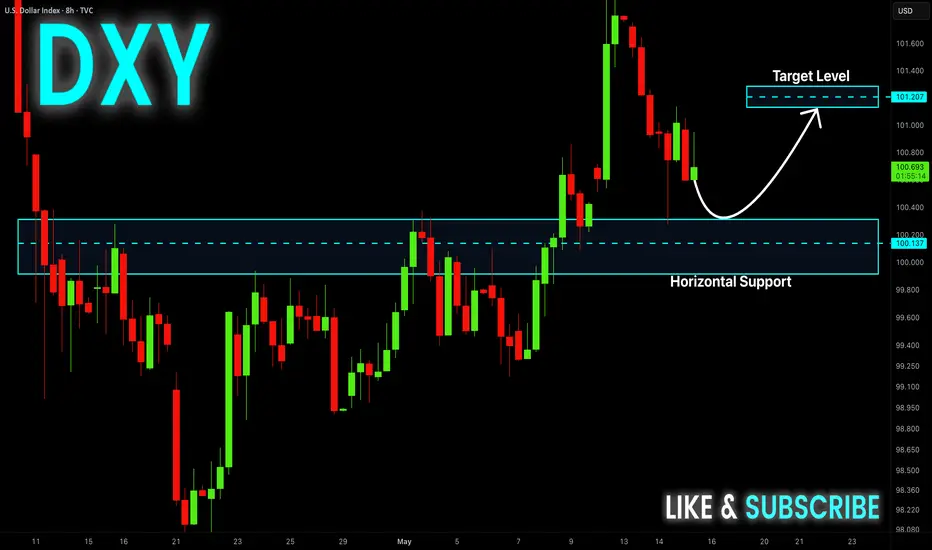
DXY Bullish Rebound Expected! Buy!
Hello,Traders!
DXY is making a local
Bearish correction towards
The horizontal support level
Around 100.200 but we are
Locally bullish biased so
After the retest we will be
Expecting a local bullish rebound
Buy!
Comment and subscribe to help us grow!
Check out other forecasts below too!
Disclosure: I am part of Trade Nation's Influencer program and receive a monthly fee for using their TradingView charts in my analysis.
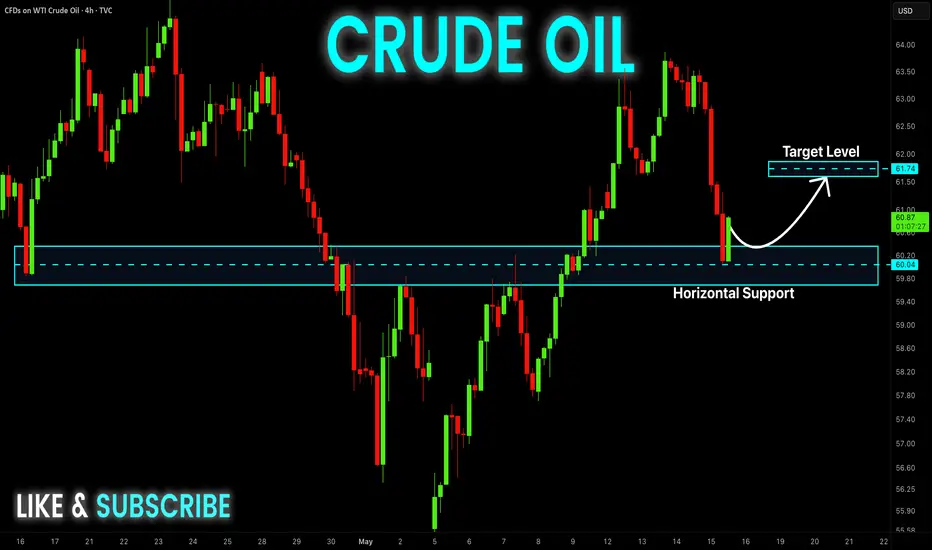
CRUDE OIL Local Long! Buy!
Hello,Traders!
USOIL has retested a
Nice round horizontal
Support level of 60$
And we are predictably
Seeing a bullish reaction
From the level which we
Believe will take the price
A bit higher still
Buy!
Comment and subscribe to help us grow!
Check out other forecasts below too!
Disclosure: I am part of Trade Nation's Influencer program and receive a monthly fee for using their TradingView charts in my analysis.
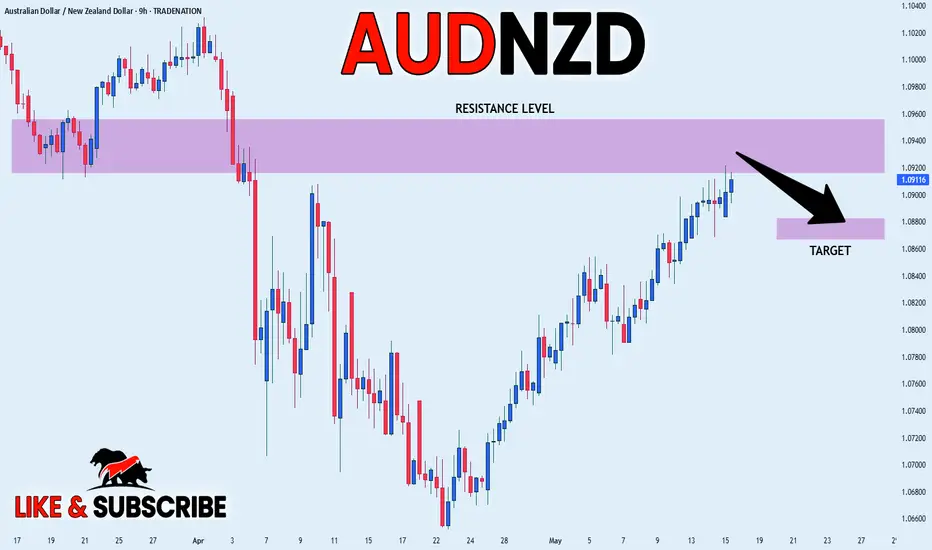
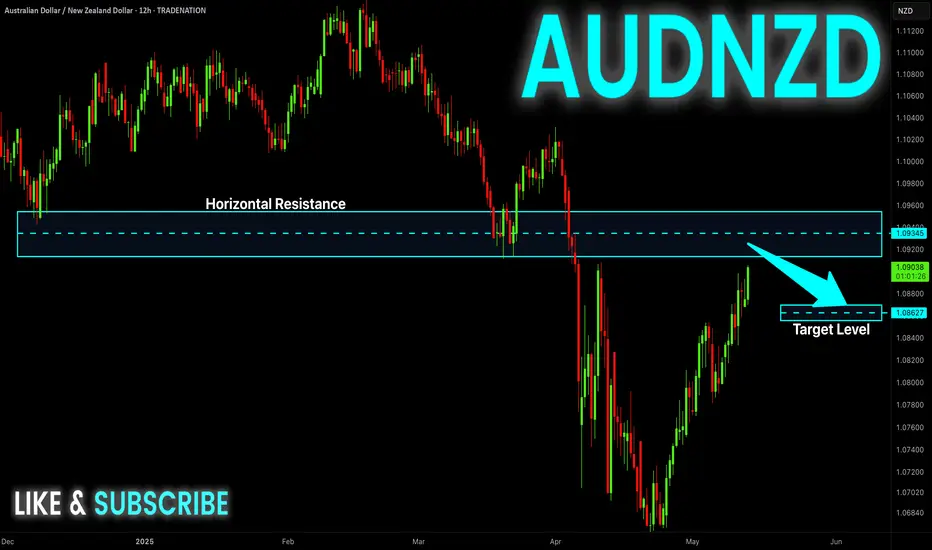
AUD_NZD STRONG RESISTANCE AEHAD|SHORT|
✅AUD_NZD is going up now
But a strong resistance level is ahead around 1.0940
Thus I am expecting a pullback
And a move down towards the target of 1.0880
SHORT🔥
✅Like and subscribe to never miss a new idea!✅
Disclosure: I am part of Trade Nation's Influencer program and receive a monthly fee for using their TradingView charts in my analysis.
GOLD → Failed to Break Ressistance and Prepare to FallingYesterday, GOLD attempted to break through the resistance area at 3,246.00 but faced a rejection.
Today, a new resistance zone appears to be forming, indicating a potential shift in momentum toward a bearish trend.
The nearest target is identified at 3,127.00.
Safe trade, best regard
Prafi

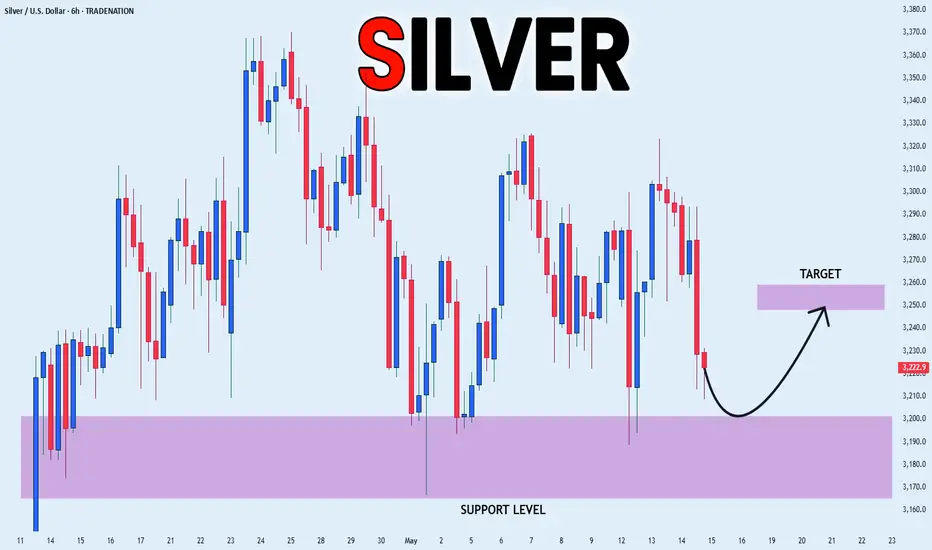
SILVER SUPPORT AHEAD|LONG|
✅SILVER will soon retest a key support level of 3170$
So I think that the pair will make a rebound
And go up to retest the supply level above at 3250$
LONG🚀
✅Like and subscribe to never miss a new idea!✅
Disclosure: I am part of Trade Nation's Influencer program and receive a monthly fee for using their TradingView charts in my analysis.
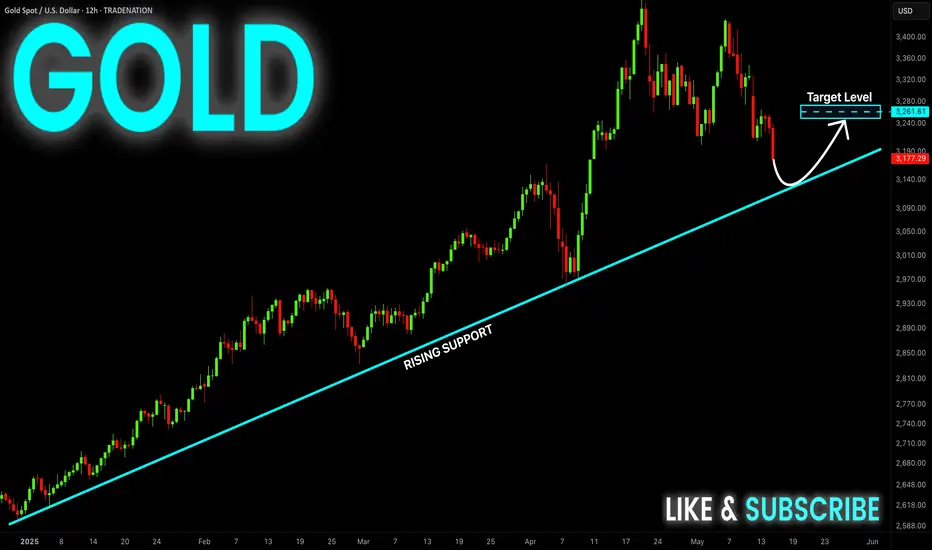
GOLD Rising Support Ahead! Buy!
Hello,Traders!
GOLD is making a nice bearish
Correction and will soon hit
A rising support line at which point
Gold will be trading at a 10% discount
Giving us a great entry point
To ride the coming bullish wave
Buy!
Comment and subscribe to help us grow!
Check out other forecasts below too!
Disclosure: I am part of Trade Nation's Influencer program and receive a monthly fee for using their TradingView charts in my analysis.
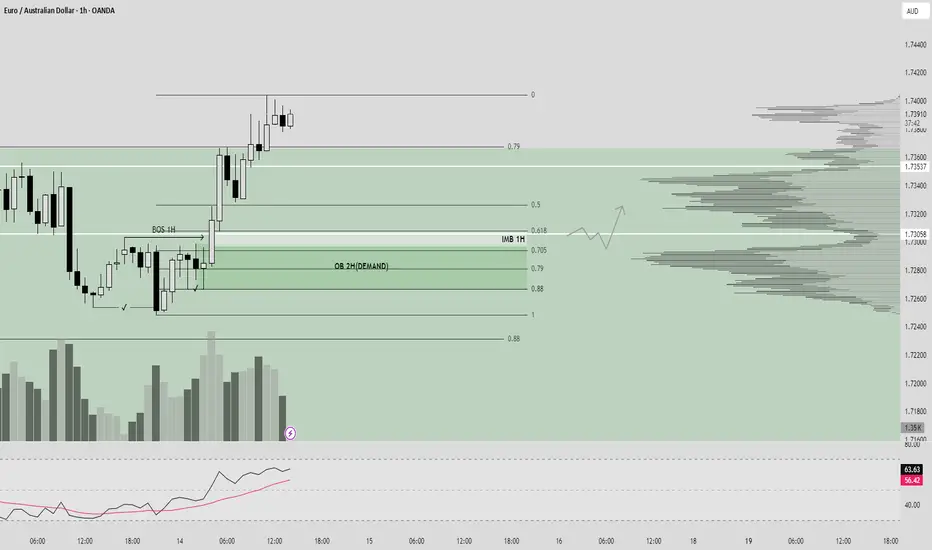
EURAUD 1H (BOS 1H + Demand + OTE)Hello traders!
As you can see we mitigated our global demand(POI) and now we have confirmation on 1H TF, I expecting reversal from demand(OB) It is 705 Fib level, after closing imbalance.
Don't forget to subscribe for more Smart Money Setups! Have a great day!
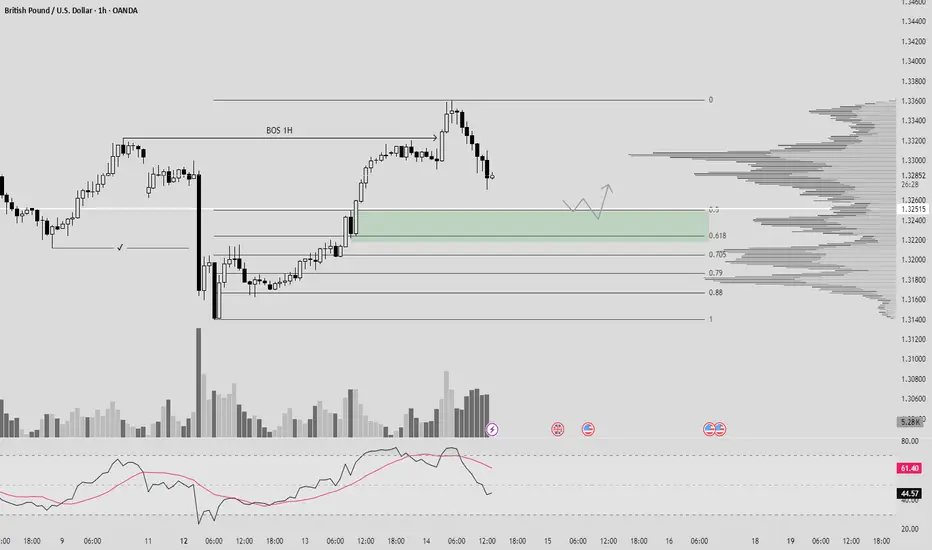
GBPUSD 1H (BOS 1H + OB + 0.5 FIB level + volume)Hello traders!
As you can see we have BOS on 1H after LG. I expecting reversal and mitigation our OB + 0.5 Fib level + horizontal level
Have a profitable day and don't forget to subscribe for updates!
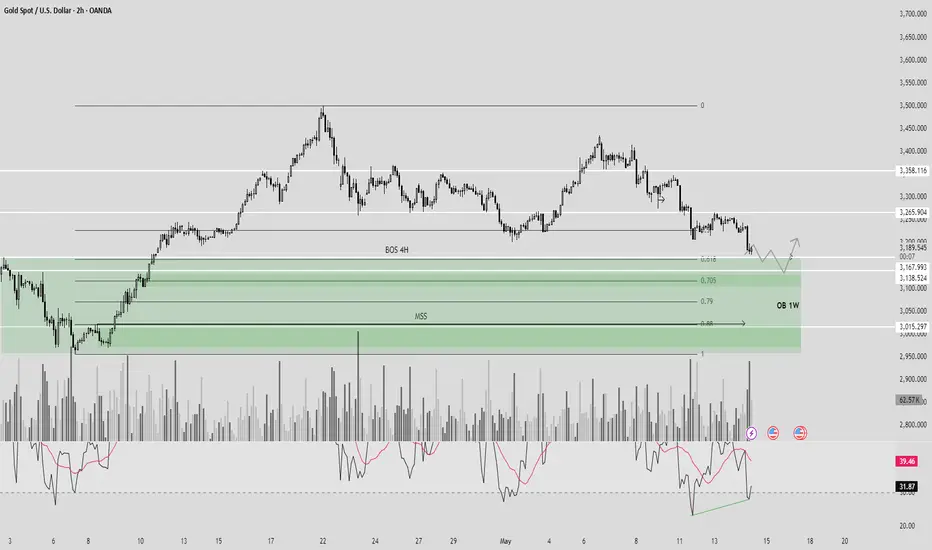
XAUUSDHello traders!
Now we have already convergence on 1-2h timeframe, and price wants to mitigate 1W OB + 618/705 fib level. Only we need confirmation on LTF 3-5min.
Have a profitable day!
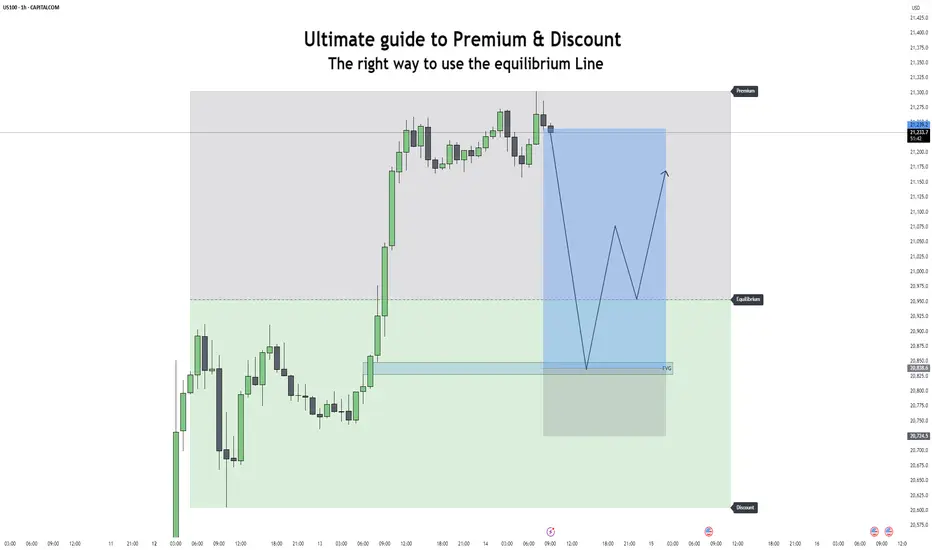
How to Master Premium & Discount For Better EntriesA lot of traders talk about premium and discount, but very few actually know how to use it properly. Most just draw Fibonacci tools on random legs and try to catch reactions at the 61.8% level. That kind of trading lacks structure and context. If you're serious about using Smart Money Concepts the right way, then you need to understand where value exists in the market and how to position yourself accordingly.
This guide is all about mastering the premium vs discount model using a 4H bias, entries on the 1H or 15M, and refinements based solely on Fair Value Gaps. No order blocks. No guessing. Just clean structure, displacement, and a focus on institutional logic.
Establishing a Valid 4H Dealing Range
Your entire analysis starts with the 4H chart. That’s where you define the dealing range, the leg of price that caused a significant shift in market structure, usually confirmed by displacement and a break of a previous swing.
To do this correctly:
Identify a 4H swing high to swing low (or low to high) that broke structure and created an imbalance.
Anchor your range from that swing point to the extreme, this becomes your dealing range.
Mark the 50% of this range — this is your equilibrium line.
Everything above this midpoint is premium, everything below is discount.
You’re not drawing fibs for retracement levels. You’re using them to separate cheap price from expensive price.
Premium vs Discount: Why It Matters
The logic is simple: institutions buy at discount and sell at premium. They don’t place large positions in the middle of the range, they accumulate when price is cheap and distribute when price is expensive.
Once you’ve marked out your 4H range, you now have a framework:
Price in discount (below the 50%) = potential buy setups.
Price in premium (above the 50%) = potential sell setups.
The key is to only look for trades in the right part of the range. If price is in premium and you're trying to long, you're working against smart money. If it's in discount and you're trying to short, you're fading accumulation.
Refining the Setup on 1H or 15M
Once price enters the zone you’re interested in, premium or discount. Drop to the 1H or 15M charts to look for entries.
But we’re not trading any structure or supply/demand zone. We’re only interested in Fair Value Gaps. Why? Because FVGs are the cleanest way to spot imbalance — they show where price moved too aggressively and left inefficiency behind.
Here's what to do:
Watch for displacement on 1H or 15M once price taps into the 4H premium or discount zone.
The move should break short-term structure and leave a clear FVG.
Wait for price to retrace into that FVG.
Entry is placed inside the gap, preferably in the upper or lower third depending on direction.
Your invalidation is the low or high of the displacement move.
The FVG gives you a clean risk-to-reward setup that is backed by structure, context, and smart money intent.
Example: Long from Discount
Let’s say price is trading inside the discount zone of a 4H bullish dealing range. You now drop to 15M and see a sharp move higher that breaks structure and creates a clean 15M FVG.
Now you wait.
If price retraces into that gap and shows some form of reaction (volume, reaction wick, or small lower timeframe shift), you have a valid long. The trade is high probability because:
It’s inside 4H discount
The 15M displacement confirms smart money is stepping in
The FVG is your refined entry zone
Target is always the next liquidity pool inside premium.
Example: Short from Premium
Opposite logic applies.
If price trades into the premium zone of a 4H bearish range, you drop to 1H or 15M and wait for displacement to the downside. When you get a strong bearish move that leaves behind a Fair Value Gap and breaks intraday structure, you mark the FVG.
When price retraces into it, you execute your short. Stop is above the displacement high. Target is the first liquidity level inside discount, such as an old low or a clean equal low.
Rules for FVG Entries (1H/15M)
To keep your execution sharp, stick to these:
Only enter FVGs that form from displacement moves.
The FVG must break intraday structure.
It must form inside the 4H premium or discount zone, no exceptions.
Avoid FVGs that form in the middle of the range or during chop.
Make sure higher timeframe context supports the direction.
This filters out 90% of weak setups and forces you to trade in sync with value.
Targets and Exits
Where you enter is based on imbalance and structure, but where you exit is based on liquidity and the premium/discount model in reverse.
If you long from discount, you should be targeting premium levels.
If you short from premium, you should be targeting discount levels.
More specifically:
Look for old highs/lows
Clean equal highs/lows
Unfilled FVGs in the opposite zone
This way, you’re always exiting into areas where the market is likely to reverse or stall, and not overstaying your trade.
Conclusion
Trading from premium or discount zones isn’t just a concept, it’s a framework that puts you in line with institutional activity. When you combine it with FVGs, you have a clean, mechanical way to structure your trades.
Keep your bias on the 4H. Mark your ranges clearly. Drop to 1H or 15M only when price is in a valid zone, and only take entries on FVGs that form from strong displacement. If you stay disciplined with this model, you’ll avoid chasing price and start trading from areas of true value.
___________________________________
Thanks for your support!
If you found this guide helpful or learned something new, drop a like 👍 and leave a comment, I’d love to hear your thoughts! 🚀
Make sure to follow me for more price action insights, free indicators, and trading strategies. Let’s grow and trade smarter together! 📈
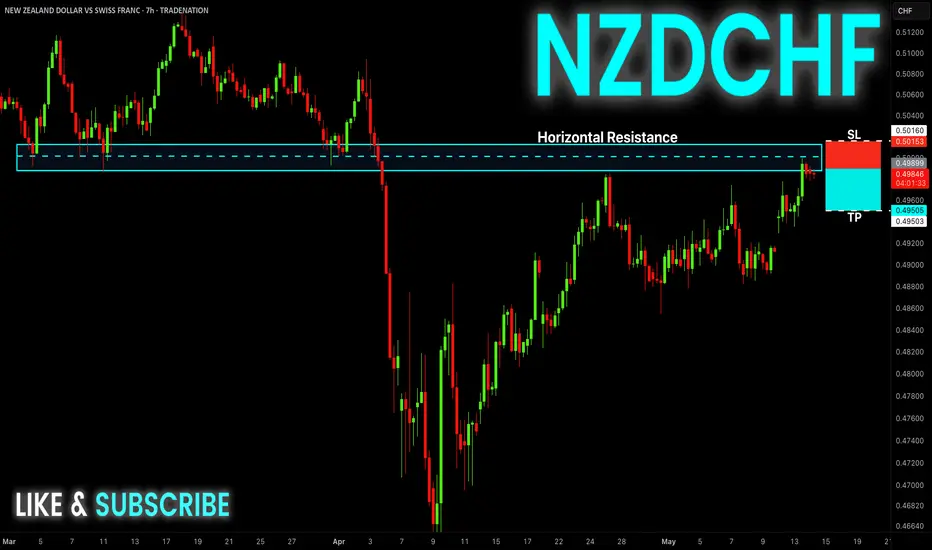
NZD-CHF Free Signal! Sell!
Hello,Traders!
NZD-CHF hit a horizontal
Resistance of 0.5002 and
Its a strong supply area so
We will be expecting a local
Pullback, which means we
Can enter a short trade
With the Take Profit of 0.4950
And the Stop Loss of 0.5016
Sell!
Comment and subscribe to help us grow!
Check out other forecasts below too!
Disclosure: I am part of Trade Nation's Influencer program and receive a monthly fee for using their TradingView charts in my analysis.
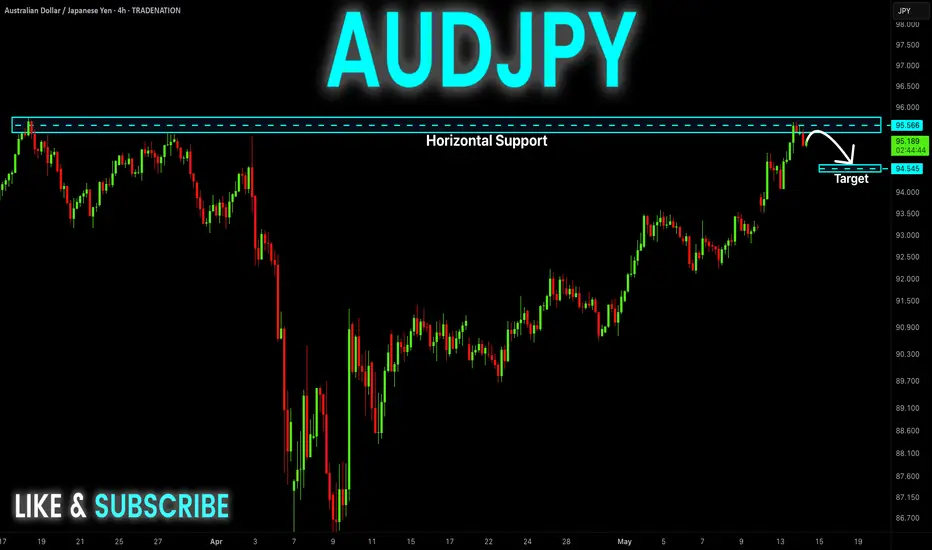
AUD-JPY Risky Short! Sell!
Hello,Traders!
AUD-JPY grew up fast
But then hit a horizontal
Resistance level of 95.750
From where we are already
Seeing a nice pullback
And we will be expecting
A further local move down
Sell!
Comment and subscribe to help us grow!
Check out other forecasts below too!
Disclosure: I am part of Trade Nation's Influencer program and receive a monthly fee for using their TradingView charts in my analysis.
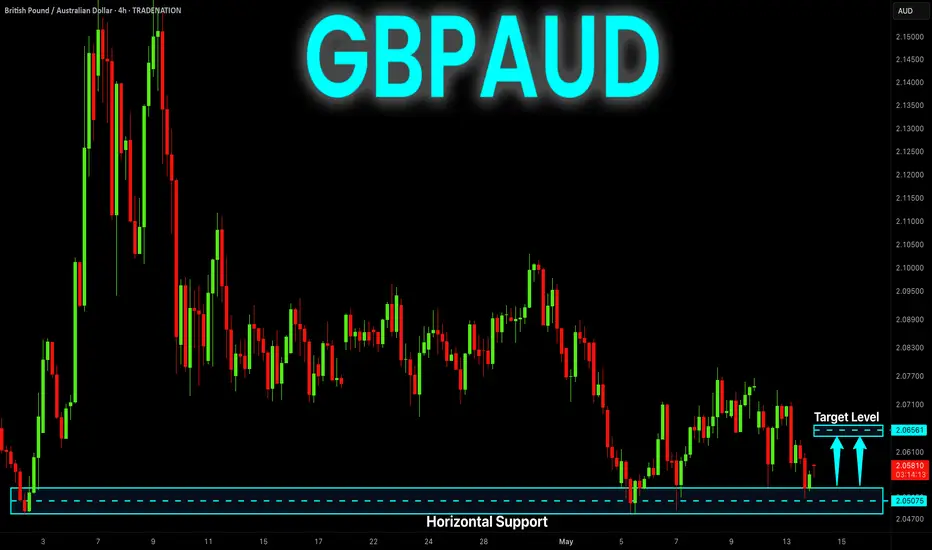
GBP-AUD Will Grow! Buy!
Hello,Traders!
GBP-AUD made a retest
Of the horizontal support
Level of 2.0480 and we are
Already seeing a local bullish
Rebound so we are locally
Bullish biased and we will be
Expecting a further move up
Buy!
Comment and subscribe to help us grow!
Check out other forecasts below too!
Disclosure: I am part of Trade Nation's Influencer program and receive a monthly fee for using their TradingView charts in my analysis.
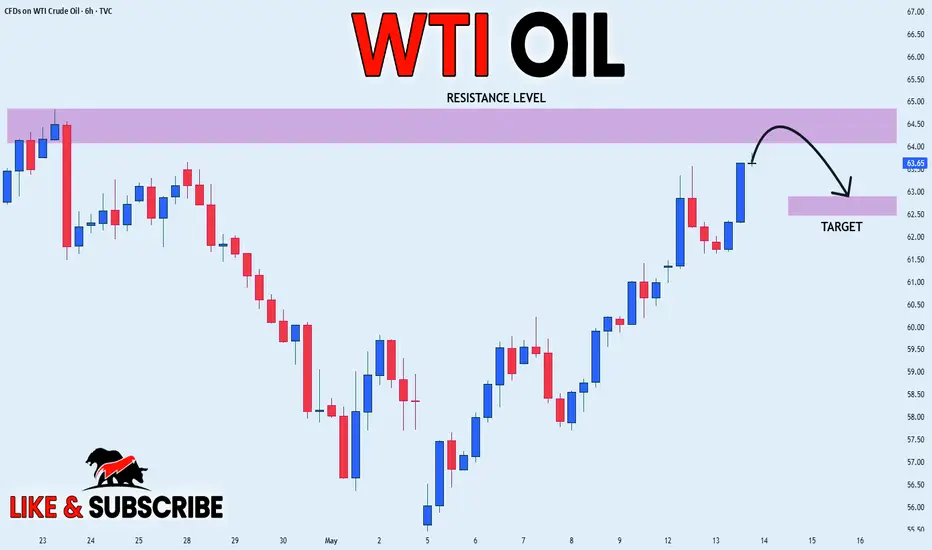
USOIL POTENTIAL SHORT|
✅CRUDE OIL has been growing recently
And Oil seems locally overbought
So as the pair is approaching a horizontal resistance of 64.82$
Price decline is to be expected
SHORT🔥
✅Like and subscribe to never miss a new idea!✅
Disclosure: I am part of Trade Nation's Influencer program and receive a monthly fee for using their TradingView charts in my analysis.
AUD-NZD Correction Ahead! Sell!
Hello,Traders!
AUD-NZD is growing strongly
And the pair looks locally
Overbought so after it
Hits the horizontal resistance
Area around 1.0934 we will
Be expecting a local bearish
Correction and a move down
Sell!
Comment and subscribe to help us grow!
Check out other forecasts below too!
Disclosure: I am part of Trade Nation's Influencer program and receive a monthly fee for using their TradingView charts in my analysis.
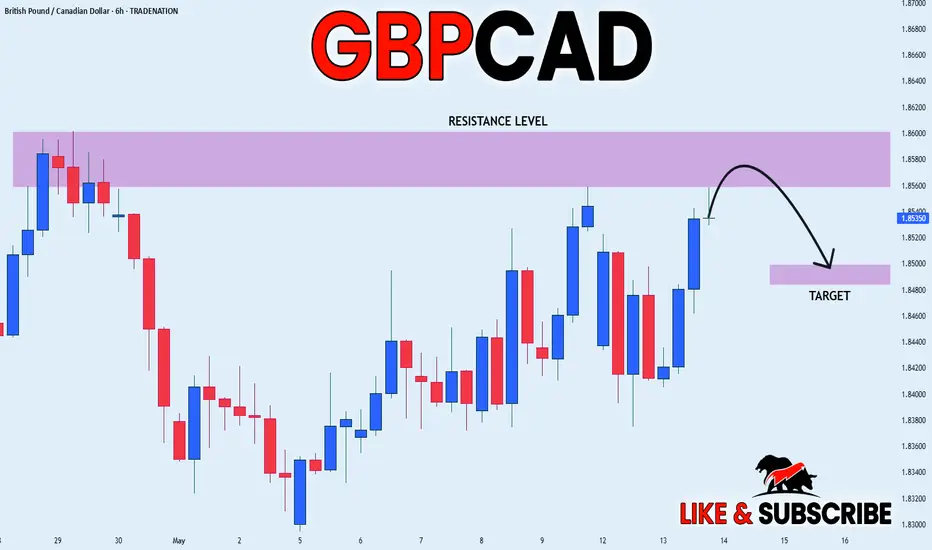
GBP_CAD RESISTANCE AHEAD|SHORT|
✅GBP_CAD is going up now
But a strong resistance level is ahead at 1.8600
Thus I am expecting a pullback
And a move down towards the target of 1.8500
SHORT🔥
✅Like and subscribe to never miss a new idea!✅
Disclosure: I am part of Trade Nation's Influencer program and receive a monthly fee for using their TradingView charts in my analysis.
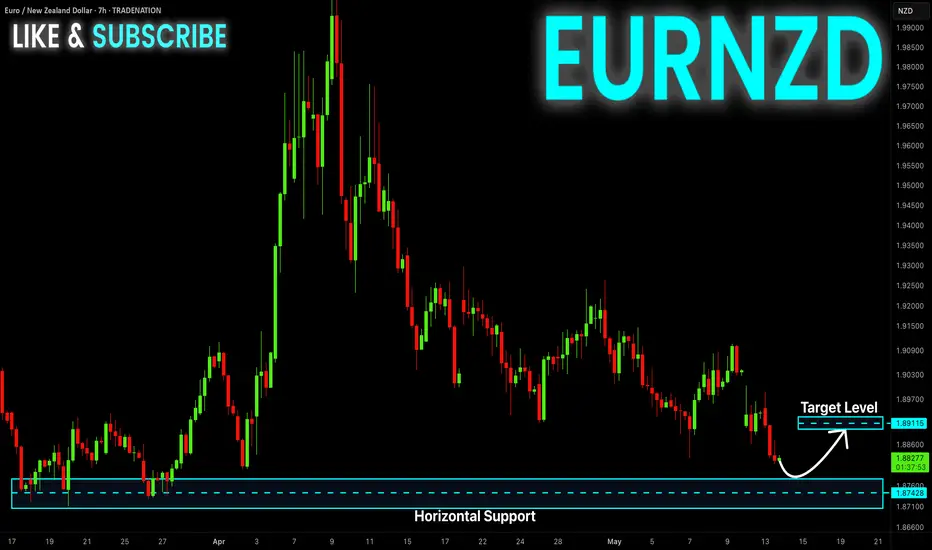
EUR-NZD Support Ahead! Buy!
Hello,Traders!
EUR-NZD keeps falling
But the pair will soon
Retest a horizontal support
Level of 1.8732 so after
The pair makes the retest
We will be expecting a
Local bullish rebound
Buy!
Comment and subscribe to help us grow!
Check out other forecasts below too!
Disclosure: I am part of Trade Nation's Influencer program and receive a monthly fee for using their TradingView charts in my analysis.
Bitcoin - $100k retest before new ATH?Bitcoin has broken out of its 1-hour ascending channel with a sharp bearish displacement, ending the slow grind higher that had been in place since the 9th of May. That channel served as a controlled environment for accumulation and small trend continuation, but the move we just saw confirms that the phase of balance has shifted into a clear retracement. The displacement candle was strong, clean, and aggressive, closing well outside the lower boundary of the channel and taking out multiple internal lows in the process. This wasn’t a weak break, it showed intent.
From a market structure standpoint, this confirms that short-term control has shifted to the downside. That move also left behind a visible Fair Value Gap just above current price, which is likely to act as a draw in the coming sessions. Unless that FVG gets reclaimed impulsively, this looks like the beginning of a deeper retracement.
Consolidation Structure
Prior to the break, BTC was building liquidity inside a clean ascending channel. The highs kept getting swept by small wicks, which hints at repeated inducement and short-term stop hunts. The final push into the top of the channel marked the last bullish attempt, and price immediately reversed after that sweep. The moment it broke structure with a high-volume bearish candle, the entire channel was invalidated and turned into supply.
We now have a clean CISD framework in play, price consolidated inside a channel, created inducement near the highs, triggered a stop hunt into the upper end of the range, and then dropped with strong displacement. That displacement not only broke structure but also left behind an imbalance that has yet to be filled.
Bullish/Bearish Scenarios
Right now, the short-term bias is bearish. The break of structure is confirmed, the Fair Value Gap is still open, and there is a clear inefficiency left behind. I expect price to revisit that gap and then reject to the downside again. That would complete the FVG retest leg and open the door for a move into deeper zones.
The next key area of interest is around the $100,000 mark, slightly below the current trading range. That level holds both technical and psychological weight. It lines up with a previous breakout zone, an unfilled imbalance, and likely a large pool of resting liquidity from retail long stops and institutional bids. If we reach that zone, I’ll be watching for signs of strength to suggest that this pullback was a liquidity grab before the next leg up.
If we do get that tap into $100K and price responds with bullish displacement from there, the bullish narrative would be back in play. That could easily form the base for a new impulse toward all-time highs. However, if $100K fails to hold and price pushes through without a significant reaction, then we’re dealing with a larger correction, and I’d expect continuation toward lower inefficiencies.
Price Target and Expectations
First, I expect a small leg up to fill the Fair Value Gap inside the broken channel structure. That area will act as the first test, and if price shows rejection there, I’m looking for continuation toward the $100,000 to $99,500 region. That zone aligns with a clean 1H imbalance and marks the origin of the last strong bullish expansion.
If BTC taps into that deeper imbalance and confirms a reversal with clear bullish intent, the stage will be set for a potential breakout into new all-time highs. That’s where I would expect stronger hands to step in and take control. The longer price holds above that $99k zone, the higher the odds we break past the previous high.
But if there’s no reaction and price bleeds through $99K, the bullish structure on the higher timeframes would be compromised, and the move could extend toward the mid-$90K range.
Current Stance
Short-term bearish, waiting for price to retest the FVG inside the previous channel. That will be the first key area where I expect a reaction. If the rejection confirms, I’ll be watching for signs of continuation into $100K.
Not interested in chasing price between levels. I’ll either look to short the FVG retest with confirmation or wait for the deeper tap into the $100K zone to look for a long setup. No trades in the middle, only acting at the extremes where the risk-reward makes sense.
Conclusion
This setup fits cleanly into a classic displacement narrative. Bitcoin broke out of structure with a high-volume move, left behind an FVG, and is now likely preparing for a short retrace before continuing lower. The $100K zone is the main area to watch — that’s where the next high-probability trade opportunity is likely to develop. If bulls defend that zone and we get bullish confirmation, the path to new highs is still intact. But if $99K fails, I’ll be sidelined and looking for the next major level.
The structure is clear, the inefficiencies are visible, and the plan is defined. Now it’s just about waiting for price to do its job.
___________________________________
Thanks for your support!
If you found this idea helpful or learned something new, drop a like 👍 and leave a comment, I’d love to hear your thoughts! 🚀
Make sure to follow me for more price action insights, free indicators, and trading strategies. Let’s grow and trade smarter together! 📈

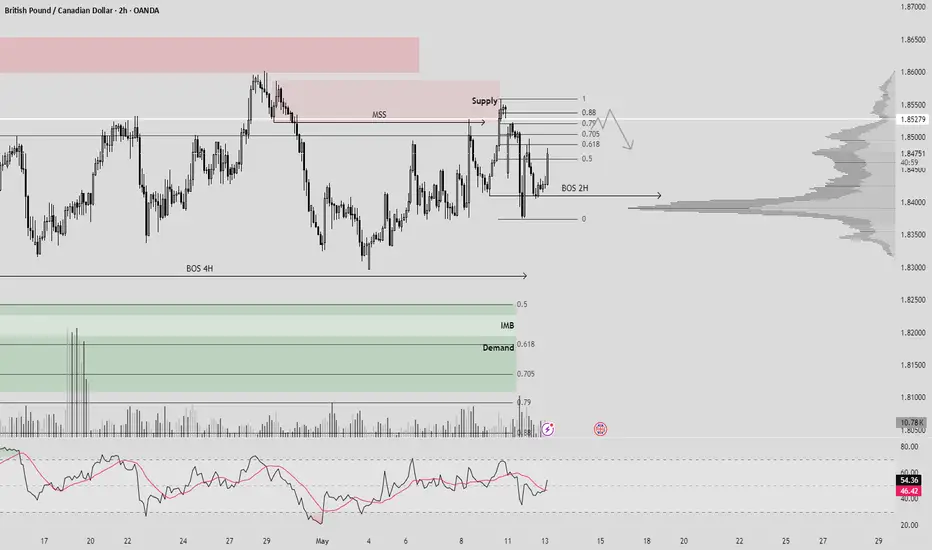
GBPCAD 2H (BOS 2H + Supply + Fib 88 level + GAP)Hello traders! We have good reaction from supply zone + BOS 2H(confirmation). Now i expecting that price will close fully gap and after it we need another confirmation from 1-3min BOS.
TP till Demand+0.5 Fib level.
Don't forget to subscribe and have a great profit!