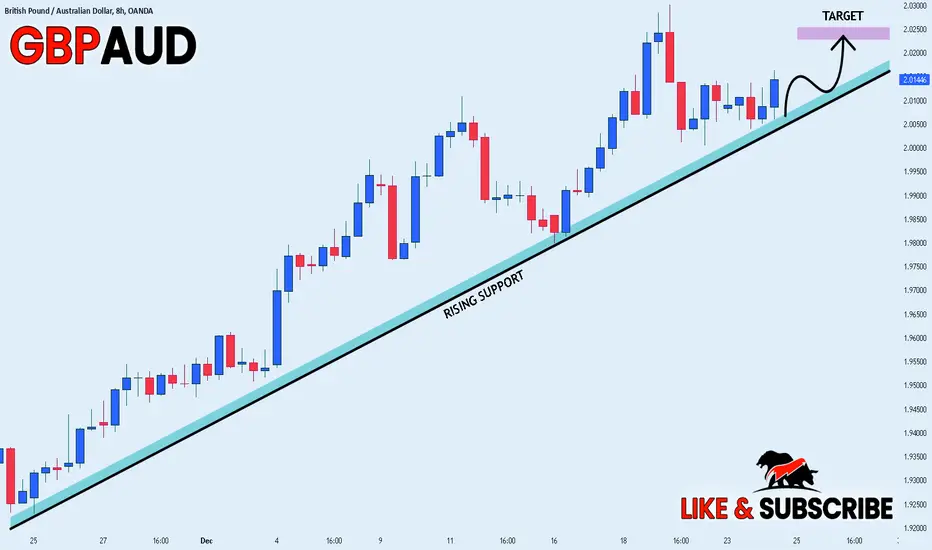
GBP_AUD BULLISH BIAS|LONG|
✅GBP_AUD is trading along the rising support line
And as the pair is going up now
After the retest of the line
I am expecting the price to keep growing
To retest the supply levels above at 2.0250
LONG🚀
✅Like and subscribe to never miss a new idea!✅
Smartmoneyconcepts
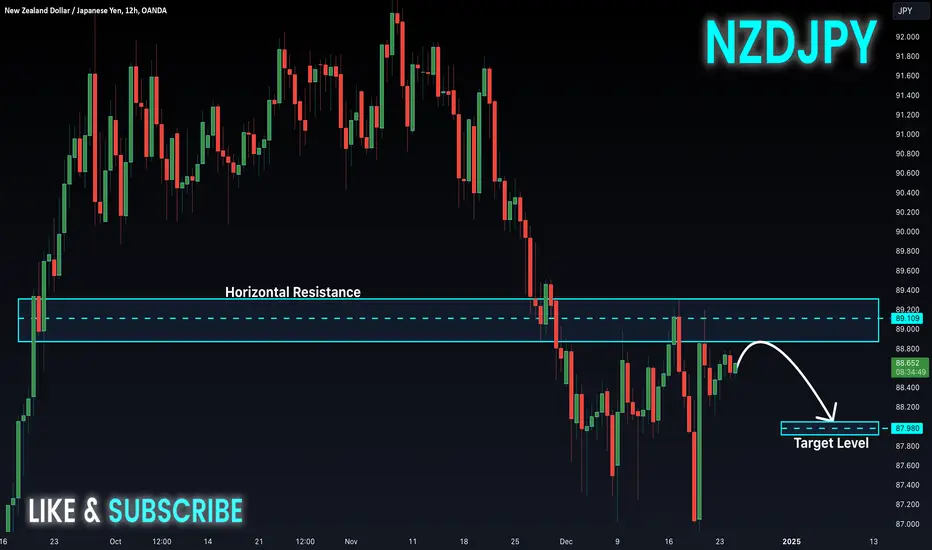
NZD-JPY Local Short! Sell!
Hello,Traders!
NZD-JPY retested a horizontal
Resistance of 89.2400 from
Where we are already seeing
A local pullback so a further
Bearish move down
Is to be expected
Sell!
Comment and subscribe to help us grow!
Check out other forecasts below too!
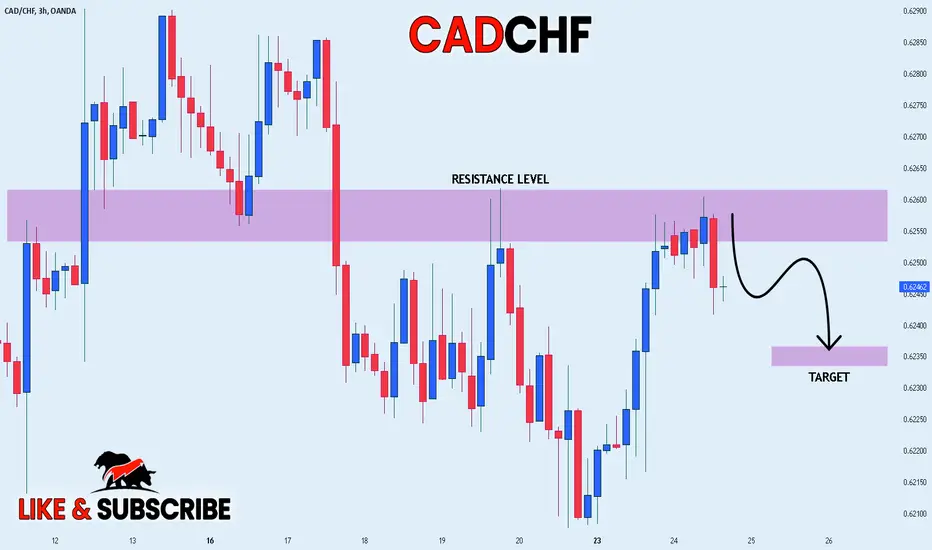
CAD_CHF WILL FALL|SHORT|
✅CAD_CHF has retested a
Resistance level of 0.6260
And we are already seeing a
Bearish reaction so we will
Be expecting a further
Bearish move down
SHORT🔥
✅Like and subscribe to never miss a new idea!✅
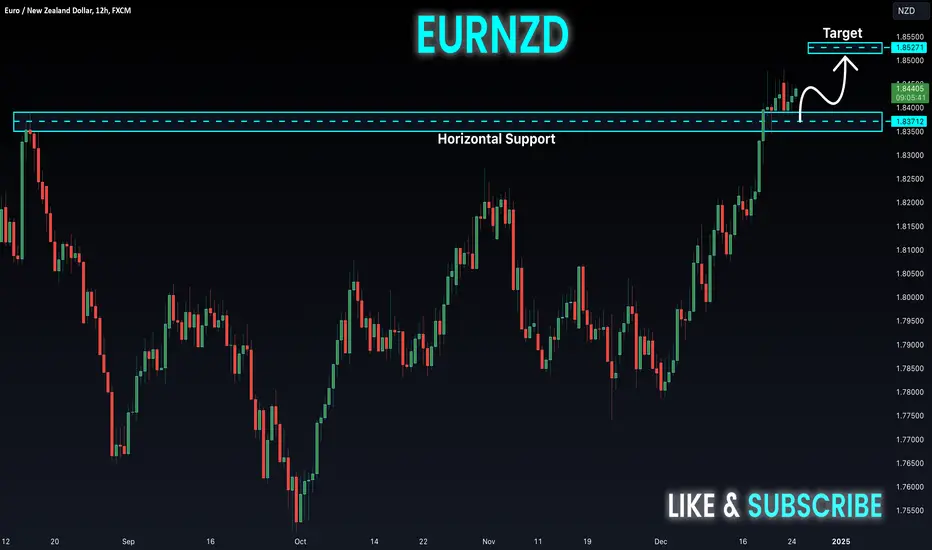
EUR-NZD Will Keep Growing! Buy!
Hello,Traders!
EUR-NZD is trading in an
Uptrend and the pair is
Making a bullish rebound
From the horizontal support
Of 1.8371 so we are bullish
Biased and we will be
Expecting a further
Bullish move up
Buy!
Comment and subscribe to help us grow!
Check out other forecasts below too!
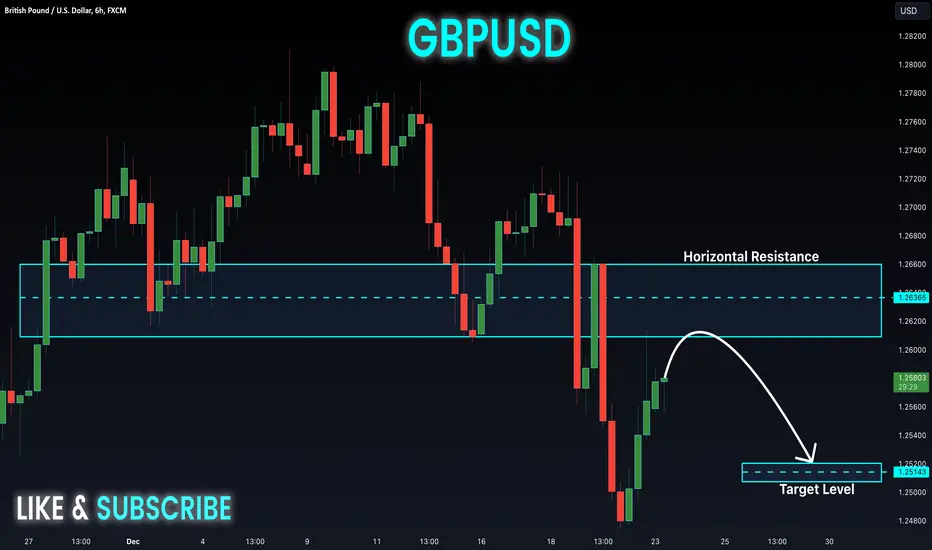
GBP-USD Resistance Ahead! Sell!
Hello,Traders!
GBP-USD is making a local
Rebound but a horizontal
Resistance is ahead at 1.2639
So after the retest we will be
Expecting a local bearish pullback
And a move down
Sell!
Comment and subscribe to help us grow!
Check out other forecasts below too!
DAX POTENTIAL LONG|
✅EUR_USD is going down now
But a strong support level is ahead at 19,600
Thus I am expecting a rebound
And a move up towards the target at 20,000
LONG🚀
✅Like and subscribe to never miss a new idea!✅

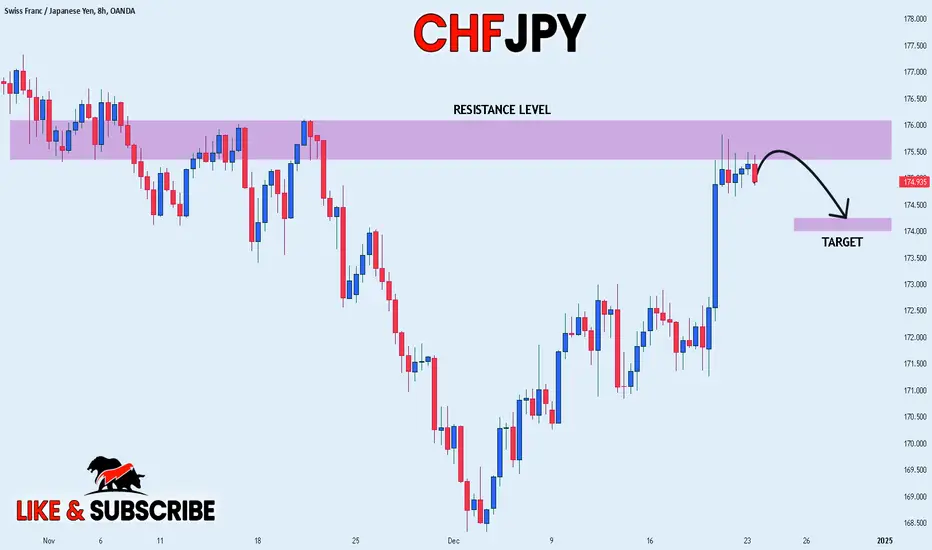
CHF_JPY WILL GO DOWN|SHORT|
✅CHF_JPY has retested a key resistance level of 176.093
And as the pair is already making a bearish pullback
A move down to retest the demand level below at 174.204 is likely
SHORT🔥
✅Like and subscribe to never miss a new idea!✅
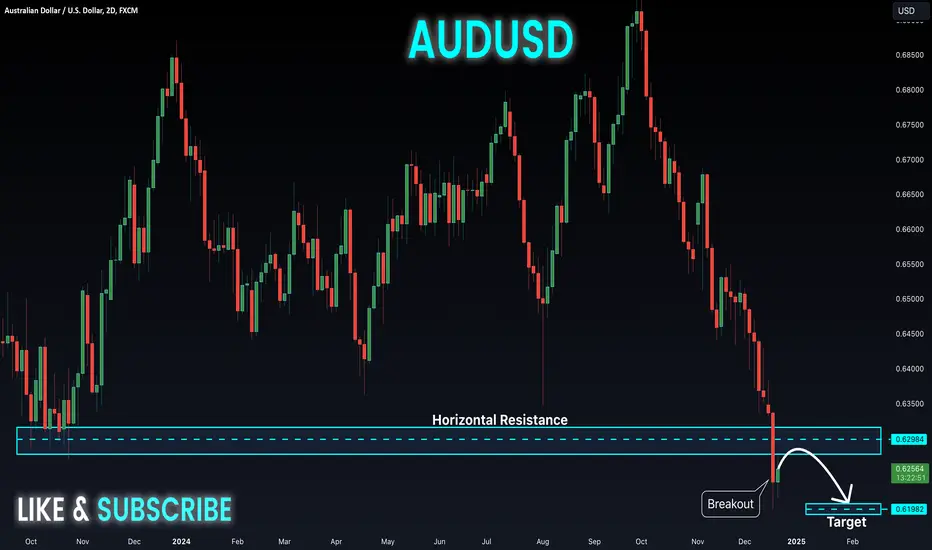
AUD-USD Swing Short! Sell!
Hello,Traders!
AUD-USD is trading in a
Downtrend and the pair
Made a bearish breakout
Of the key level of 0.6298
Which is now a resistance
So we are bearish biased and
As the pair is going up now
In a local correction we
Will be expecting a further
Move down after the
Retest of the new resistance
Sell!
Comment and subscribe to help us grow!
Check out other forecasts below too!
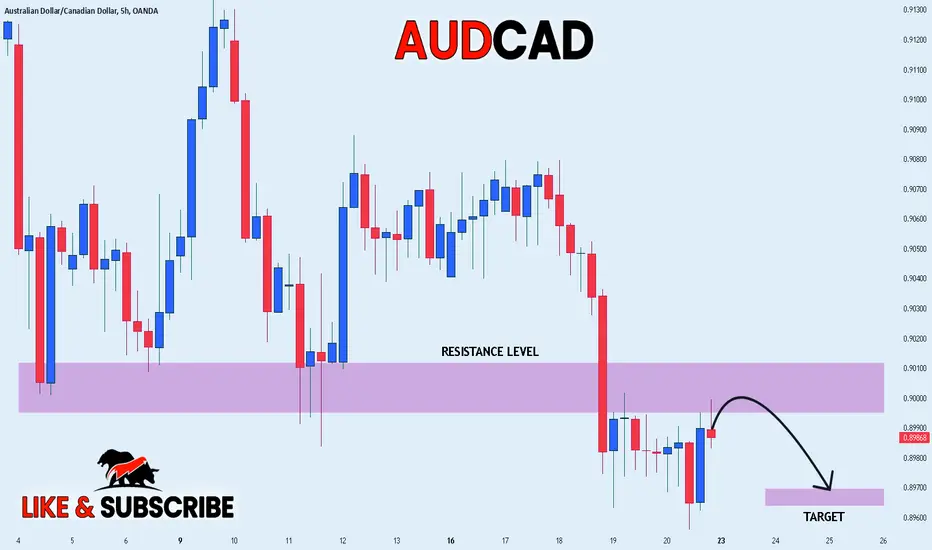
AUD_CAD RISKY SHORT|
✅AUD_CA D is trading in a
Downtrend and the pair is
Already pulling back from
The horizontal resistance
Level of 0.9010 so we are
Bearish biased and we will
Be expecting a further
Bearish move down
SHORT🔥
✅Like and subscribe to never miss a new idea!✅
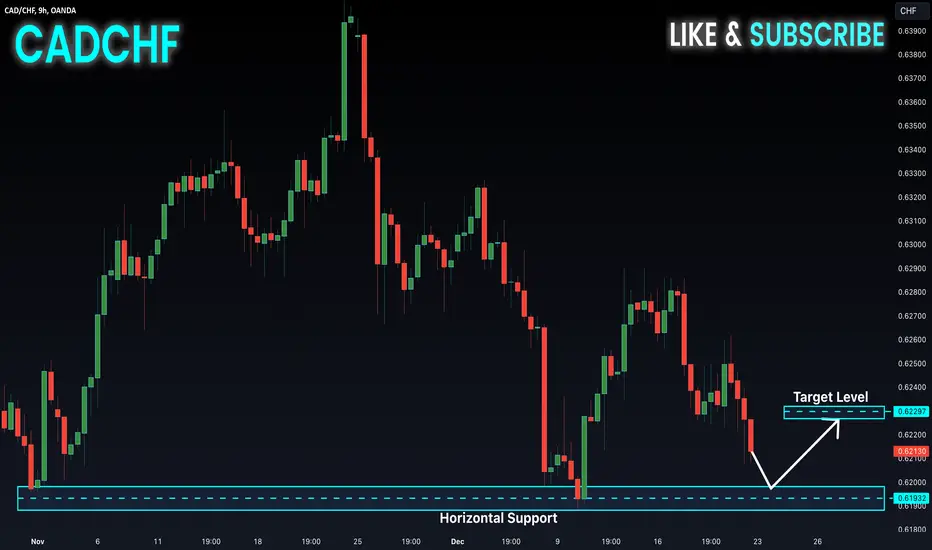
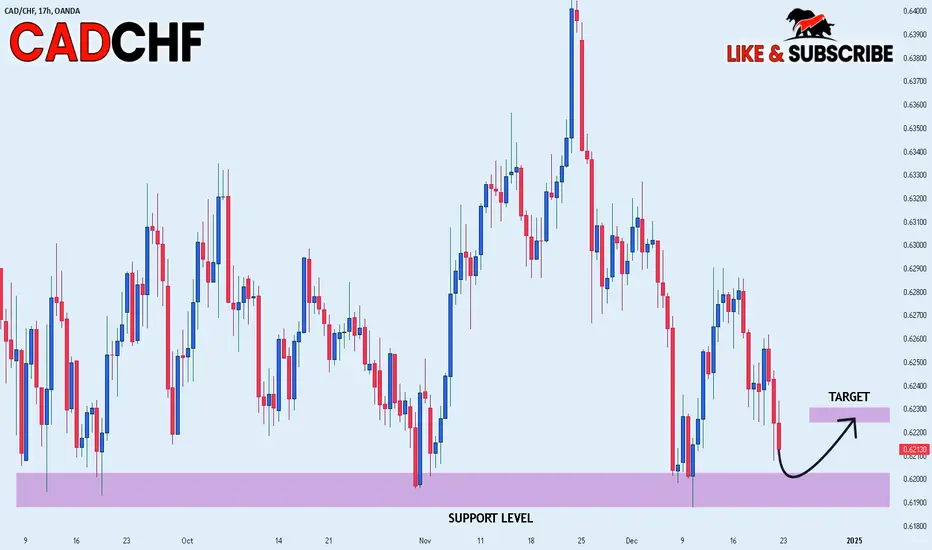
CAD-CHF Local Bullish Bias! Buy!
Hello,Traders!
CAD-CHF will soon hit a
Horizontal support of 0.6190
And as it is a strong key
Level we will be expecting
A local bullish rebound
Buy!
Comment and subscribe to help us grow!
Check out other forecasts below too!
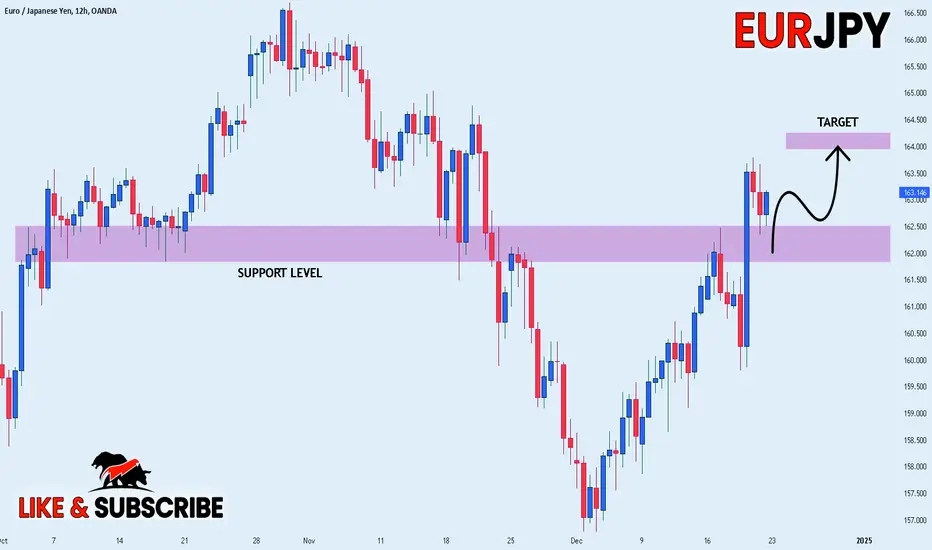
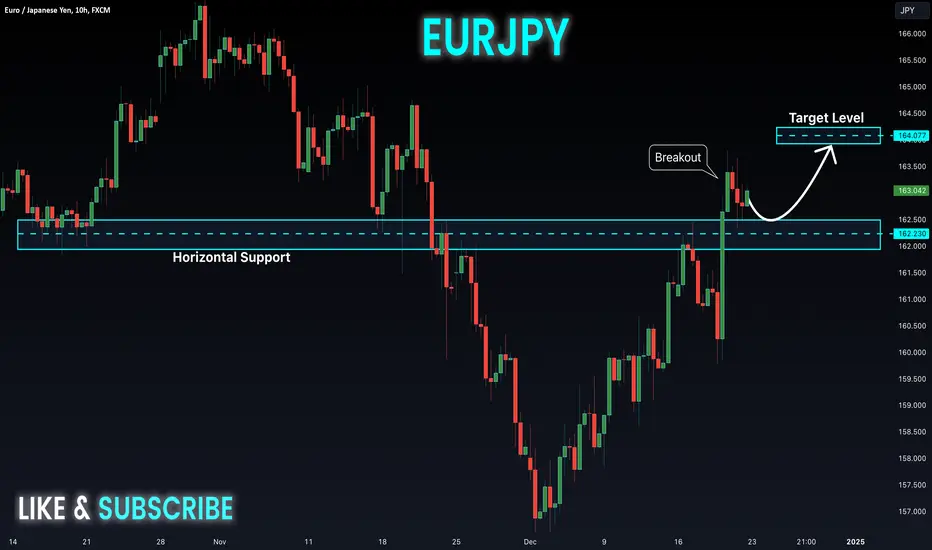
EUR_JPY WILL GROW|LONG|
✅EUR_JPY is already making
A bullish rebound from the
Horizontal support level
Of 162.500 while trading
In an uptrend so we are
Bullish biased and we will
Be expecting a further
Bullish move up
LONG🚀
✅Like and subscribe to never miss a new idea!✅
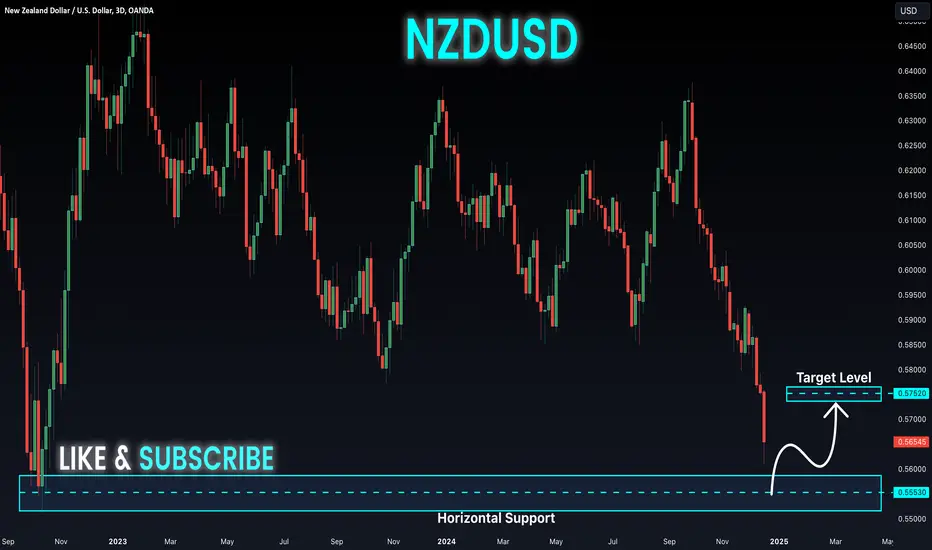
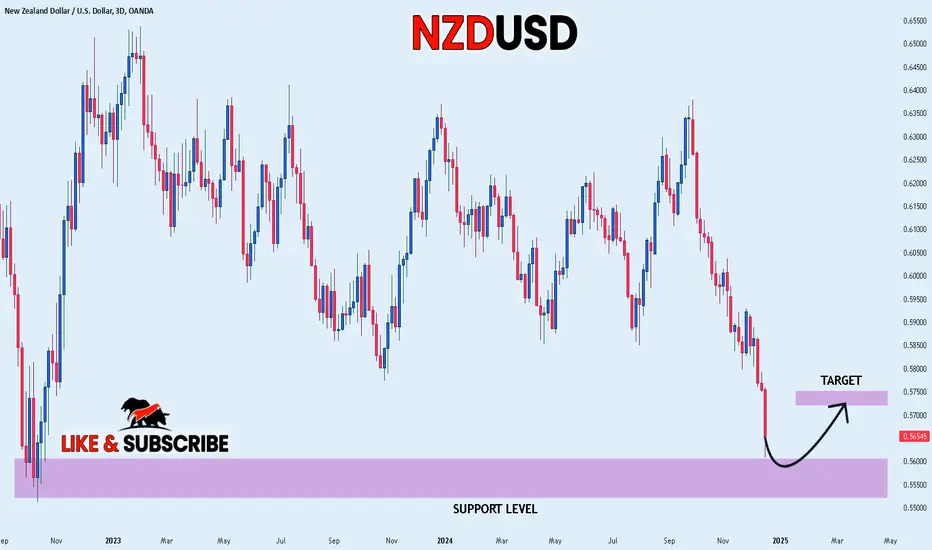
NZD-USD Growth Ahead! Buy!
Hello,Traders!
NZD-USD is falling down
But the pair is locally
Oversold and as we are
About to see a horizontal
Support retest soon
Around 0.5500 level we
Will be expecting a
Swing bullish correction
Buy!
Comment and subscribe to help us grow!
Check out other forecasts below too!
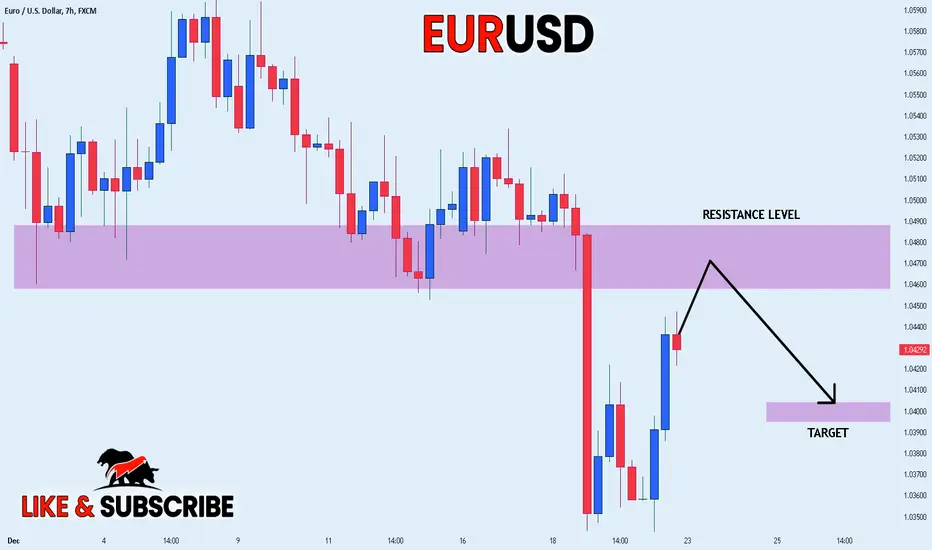
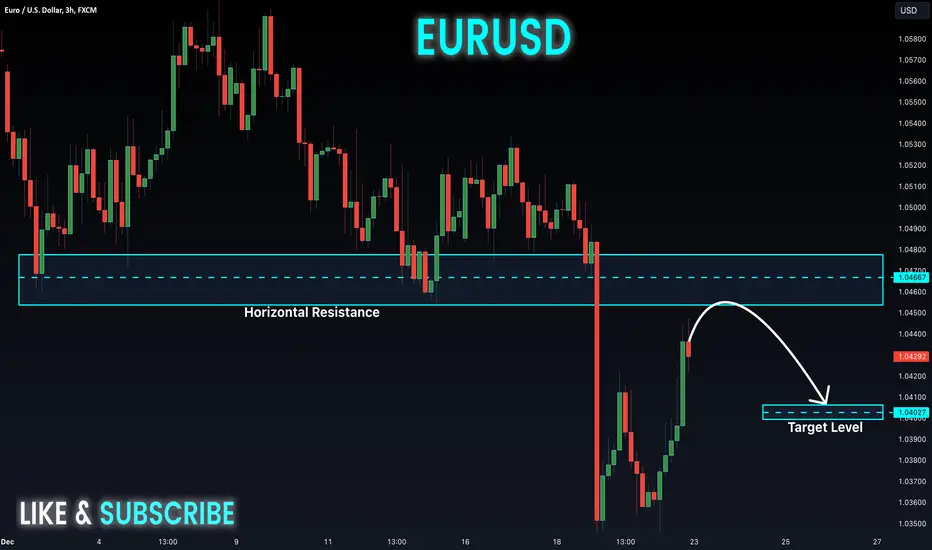
EUR_USD PULLBACK AHEAD|SHORT|
✅EUR_USD surged again to retest the resistance of 1.0480
But it is a strong key level
So I think that there is a high chance
That we will see a bearish pullback and a move down
SHORT🔥
✅Like and subscribe to never miss a new idea!✅
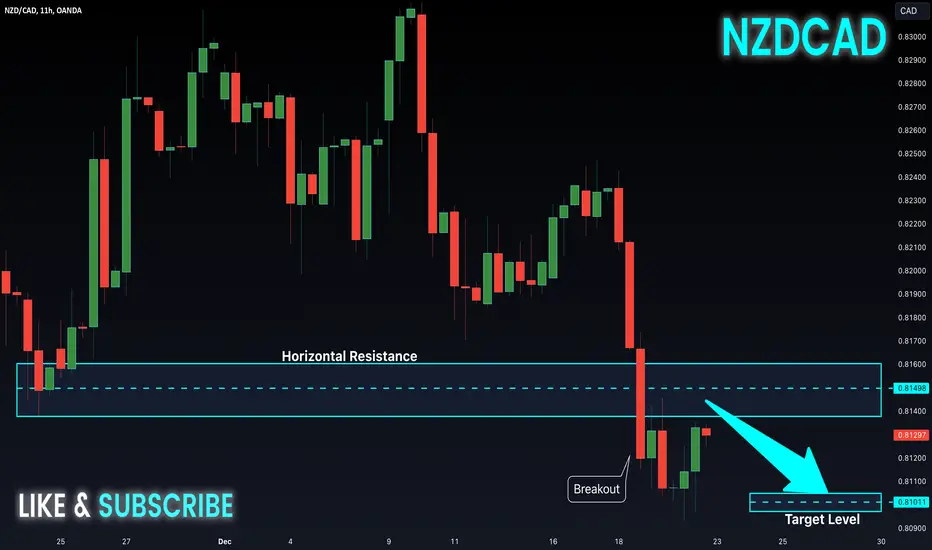
NZD-CAD Bearish Breakout! Sell!
Hello,Traders!
NZD-CAD is trading in a
Downtrend and the pair
Made a breakout of the
Key horizontal level
Of 0.8149 which is now
A resistance and the pair
Is now making a retest
Of the level so as we are
Bearish biased we will
Be expecting a pullback
And a further bearish
Move down
Sell!
Comment and subscribe to help us grow!
Check out other forecasts below too!
CAD_CHF LONG FROM SUPPORT|
✅CAD_CHF fell again to retest the support of 0.6190
But it is a strong key level
So I think that there is a high chance
We will see a bullish rebound and a move up
LONG🚀
✅Like and subscribe to never miss a new idea!✅
AUD-CAD Will Fall! Sell!
Hello,Traders!
AUD-CAD made a retest
Of the key horizontal
Resistance level of 0.9000
From where we are
Already seeing a bearish
Reaction and we will
Be expecting a
Further bearish move down
Sell!
Comment and subscribe to help us grow!
Check out other forecasts below too!

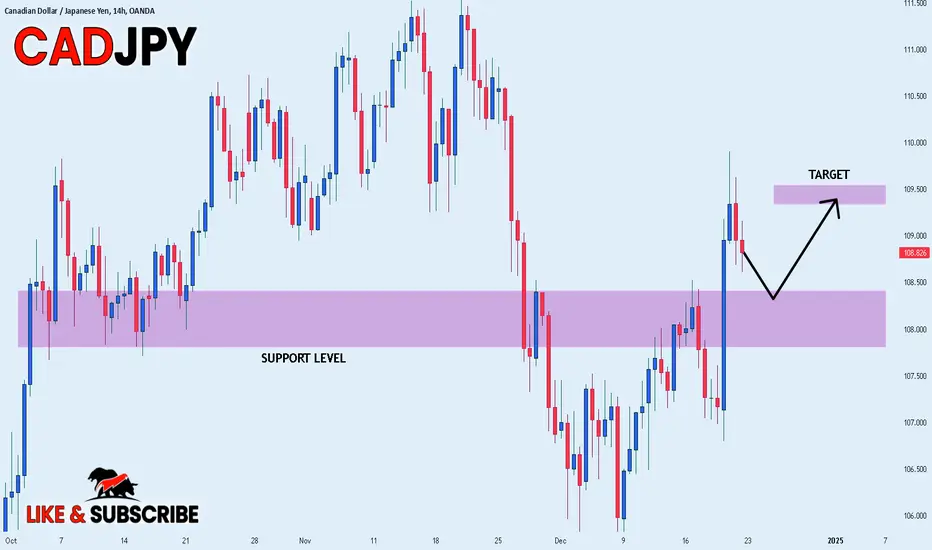
CAD_JPY POTENTIAL LONG|
✅CAD_JPY will soon retest a key support level of 108.225
So I think that the pair will make a rebound
And go up to retest the supply level above at 109.500
LONG🚀
✅Like and subscribe to never miss a new idea!✅
GBP-AUD Potential Long! Buy!
Hello,Traders!
GBP-AUD is trading in an
Uptrend along the rising
Support so after the retest
We will be expecting a
A bullish rebound
And a move up
Buy!
Comment and subscribe to help us grow!
Check out other forecasts below too!

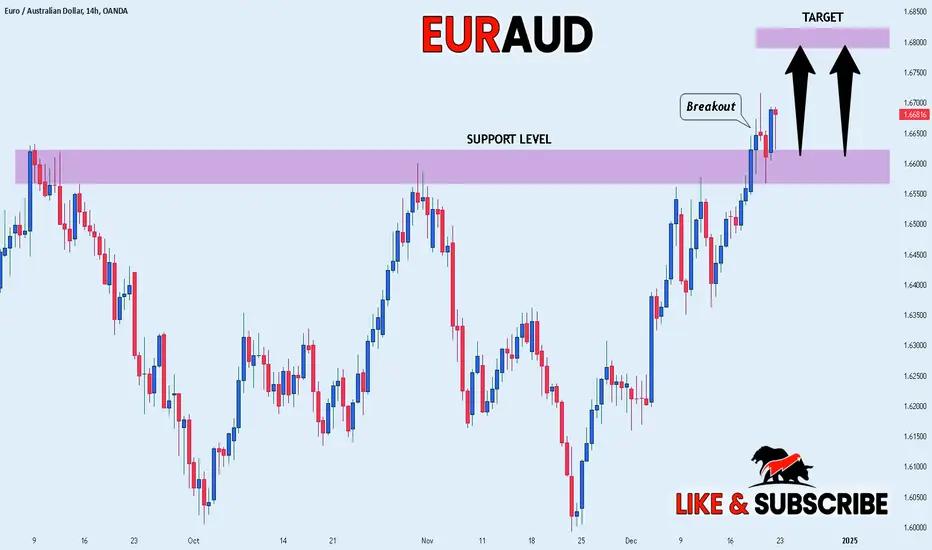
EUR_AUD WILL GROW|LONG|
✅EUR_AUD made a bullish
Breakout, retest and a nice
Rebound off of the key horizontal
Level of 1.6600 which is now
A support which reinforces our
Bullish bias thus making us
Expect some further growth
LONG🚀
✅Like and subscribe to never miss a new idea!✅
EUR-JPY Will Go UP! Buy!
Hello,Traders!
EUR-JPY is trading in an
Uptrend and the pair made
A breakout of the key
Horizontal level of 162.230
Then made a pullback and
A retest and is going up again
Now so we are bullish biased
And we will be expecting a
Further bullish move up
Buy!
Comment and subscribe to help us grow!
Check out other forecasts below too!
NZD_USD SWING LONG|
✅NZD_USD is set to retest a
Strong support level below at 0.5550
After trading in a local downtrend from some time
Which makes a bullish rebound a likely scenario
With the target being a local resistance above at 0.5729
LONG🚀
✅Like and subscribe to never miss a new idea!✅
EUR-USD Resistance Ahead! Sell!
Hello,Traders!
EUR-USD is making a
Nice bullish correction
After a sharp local flash-crash
But a local horizontal resistance
Level is ahead at 1.0470
So after the retest we will
Be expecting a local
Bearish correction
Sell!
Comment and subscribe to help us grow!
Check out other forecasts below too!
AUD_NZD LOCAL SHORT|
✅AUD_NZD price went up sharply
But a strong resistance level was hit at 1.1090
Thus, as a pullback is already happening
And a move down towards the target at 1.1047 shall follow
SHORT🔥
✅Like and subscribe to never miss a new idea!✅
