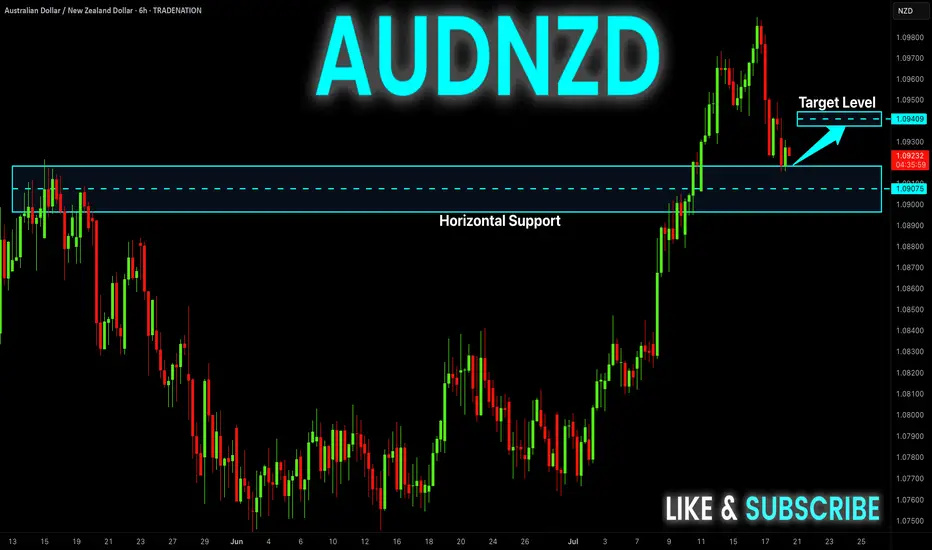
AUD-NZD Rebound Expected! Buy!
Hello,Traders!
AUD-NZD is making a retest
Of the horizontal support
Level of 1.0909 and as the
Pair is trading in an uptrend
We will be expecting a
Local bullish rebound
Buy!
Comment and subscribe to help us grow!
Check out other forecasts below too!
Disclosure: I am part of Trade Nation's Influencer program and receive a monthly fee for using their TradingView charts in my analysis.
SMC
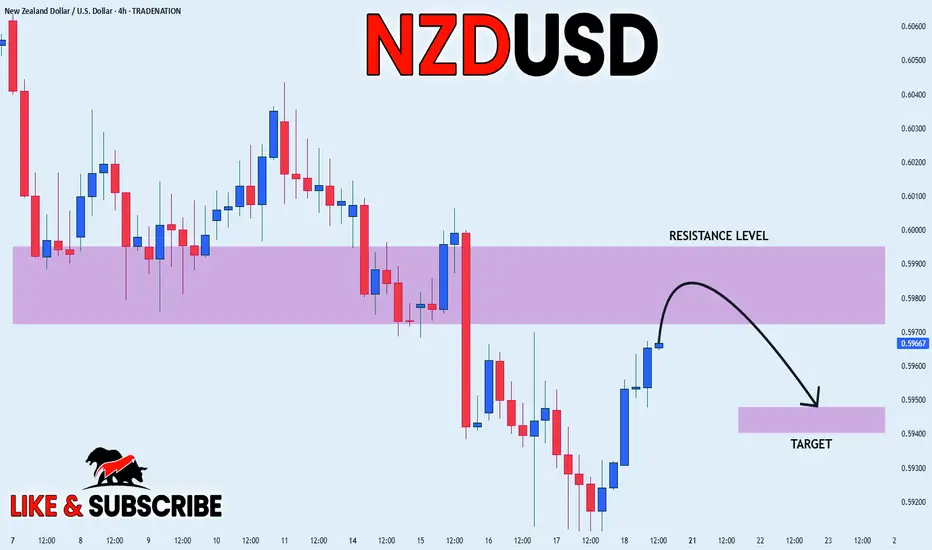
NZD_USD POTENTIAL SHORT|
✅NZD_USD is going up to retest
A horizontal resistance of 0.5990
Which makes me locally bearish biased
And I think that we will see a pullback
And a move down from the level
Towards the target below at 0.5947
SHORT🔥
✅Like and subscribe to never miss a new idea!✅
Disclosure: I am part of Trade Nation's Influencer program and receive a monthly fee for using their TradingView charts in my analysis.
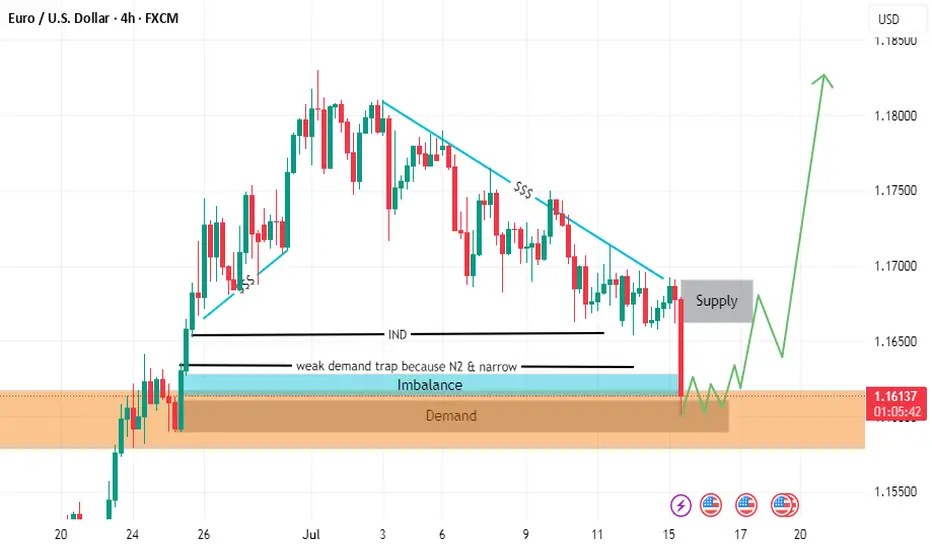
EURUSD long Lion SETUPhello everyone
the price is in a strong demand area
as liquidity has been withdrawn
and the fair value gap has been filled
but we are waiting for formation pattern on a smaller frame in order to enter an upward wave.
we also have resistance area
so in short. I expect an upside go upppp
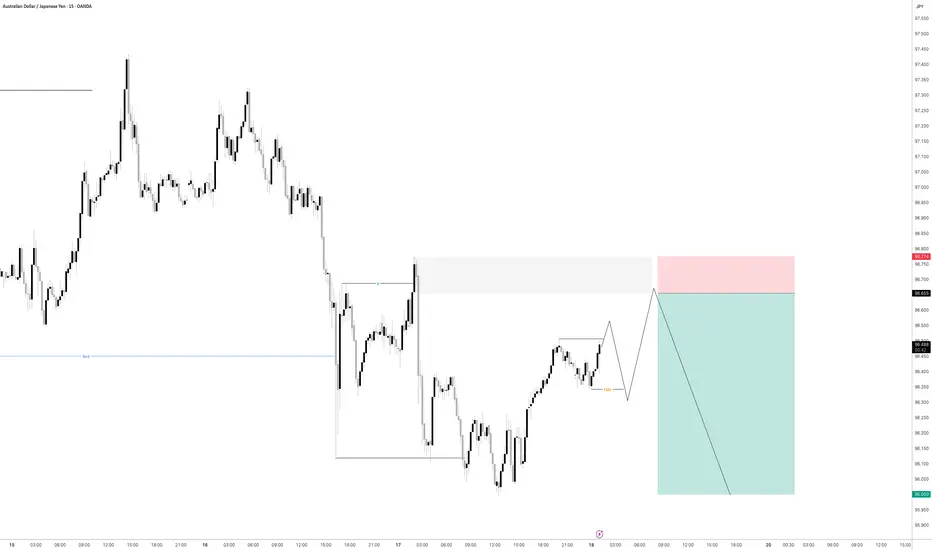
AUDJPY - POTENTIAL?USDJPY is getting super interesting.
If we can get some bearish intent to try and induce the early sellers to the downside creating some buyside liquidity then i will be all over this for a trade.
Lets see how price has moved by the morning as it does need a bit more development before we can consider entering for a short position
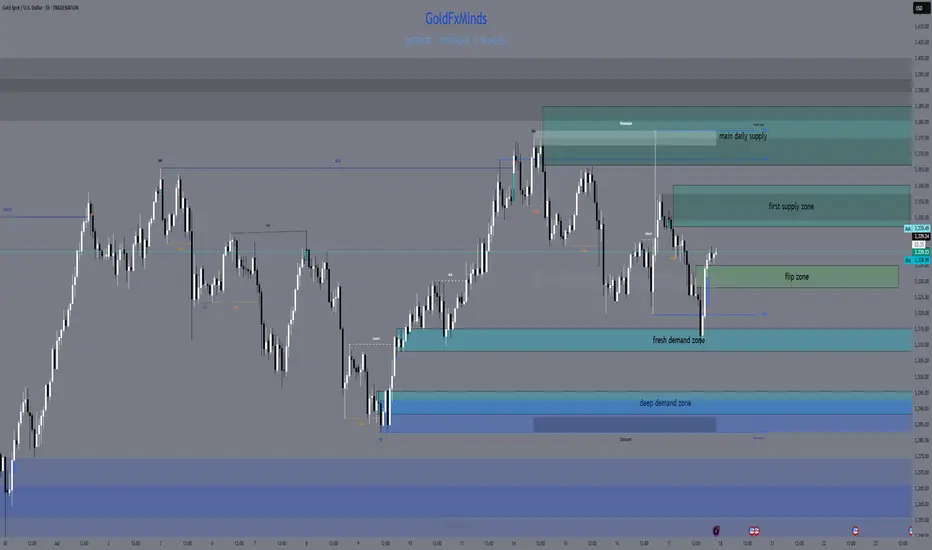
XAUUSD Daily Sniper Plan – July 17-18, 2025Hello traders!
After yesterday’s high-volatility trap and NY session recovery, we now stand at a major structural junction. Buyers reclaimed 3310–3314 with precision, but price is pressing into multi-timeframe supply. Let’s break it down clearly
🔸 HTF Bias
Daily Bias: Bullish correction inside a larger range. Demand at 3310–3305 was swept and respected, but supply at 3347–3360 caps upside.
H4 Bias: Bullish flow into supply. Structure printed clean HLs from 3295–3310. However, current zone is full of short-term profit-taking risk.
H1 Bias: Bullish short-term trend. Price built higher lows from 3310, but now sits at 3340–3347 — reactive zone where momentum could fade if no breakout.
🔸 Key Structural Zones (with role)
🔺 Supply Zones (Above Price):
3347–3360 (D1/H4/H1 Supply)
🔹 Multi-timeframe confluence
🔹 Previous reaction + NY trap zone
🔹 Expect heavy rejection or false breakout wicks
3366–3385 (D1 Supply)
🔹 Final liquidity shelf for buyers
🔹 Only valid if 3347 breaks clean
🔹 Longs must wait for confirmation after breakout
⚔️ Decision Zones (Middle):
3335–3328 (Intraday Flip Zone)
🔹 M15-M30 structure control
🔹 Buyers can reload here on clean bounce
🔹 If price closes below, opens door for bearish momentum
🔻 Demand Zones (Below Price):
3314–3310 (H1/H4 Demand – Key Buy Area)
🔹 Institutional demand origin
🔹 Price tapped, swept, and reclaimed
🔹 Ideal sniper buys only on retest with bullish M15 BOS
3305–3295 (Deep Reversal Demand)
🔹 Extreme discount
🔹 Valid only if 3310 fails
🔹 High RR buys if liquidity sweep appears
🔸 Sniper Battle Plan 🎯
Scenario 1 – Fade from 3347–3360:
🔹 If rejection signs (M15 FVG + RSI divergence), short toward 3335, 3314
🔹 Only enter if NY open confirms exhaustion
Scenario 2 – Pullback to 3335–3328:
🔹 Ideal quick buys on bounce with confirmation
🔹 Watch for BOS on LTF for sniper entry
Today’s zones require real discipline: no rush, no panic — just clear steps, sharp entries, and clean rejections or retests. You already saw what 3310–3305 reacted. The next move? You plan it. You take it. You own it.
✨ Which zone are you watching for your next move?
Drop a comment, leave a 🚀🚀🚀and follow for more sniper-level clarity — every single day.
Let’s keep mastering this market. Together.
Disclosure: All plans are built on Trade Nation live feed. Educational only.
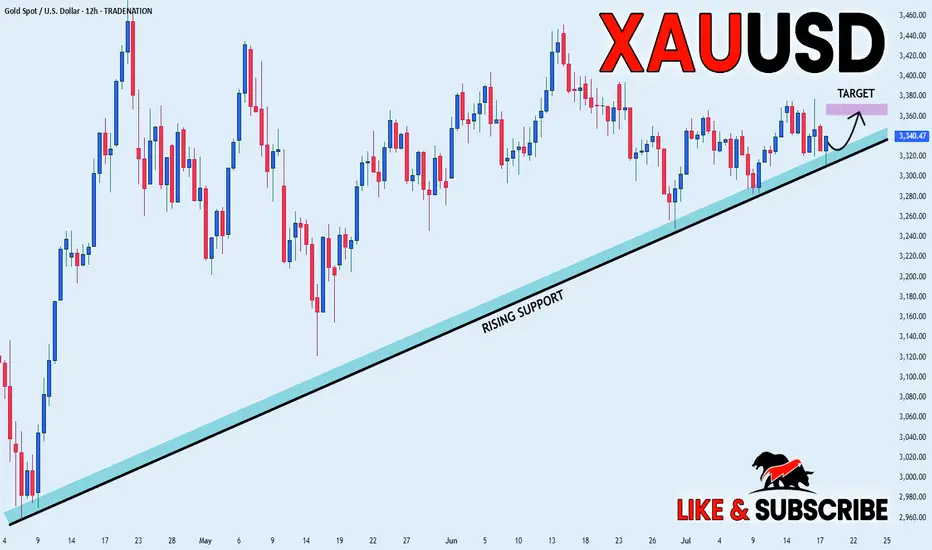
GOLD LONG FROM RISING SUPPORT|
✅GOLD is trading in an uptrend
And the bullish bias is confirmed
By the rebound we are seeing
After the price retested the support
So I think the growth will continue
LONG🚀
✅Like and subscribe to never miss a new idea!✅
Disclosure: I am part of Trade Nation's Influencer program and receive a monthly fee for using their TradingView charts in my analysis.
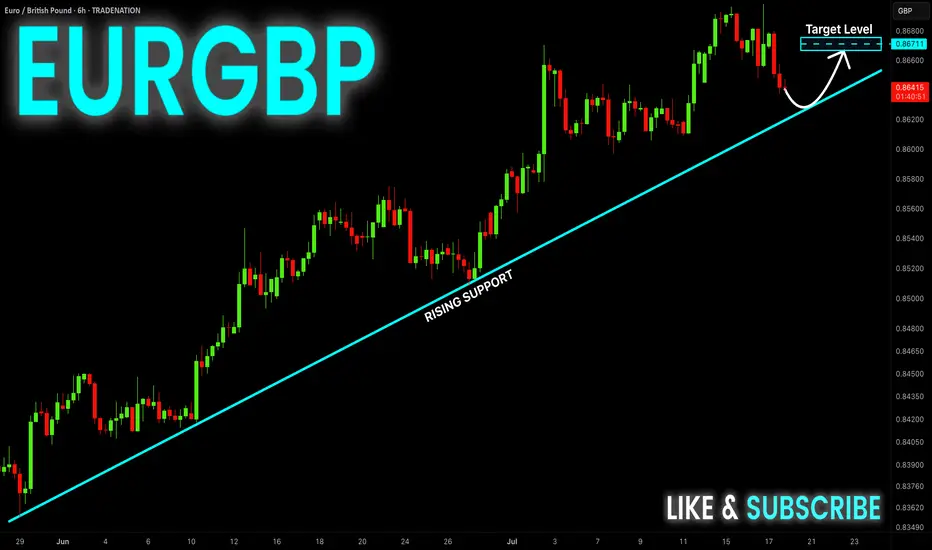
EUR-GBP Long From Rising Support! Buy!
Hello,Traders!
EUR-GBP is trading in an
Uptrend along the rising
Support line and the pair
Is going down now so after
The retest we will be
Expecting a bullish rebound
And a move up
Buy!
Comment and subscribe to help us grow!
Check out other forecasts below too!
Disclosure: I am part of Trade Nation's Influencer program and receive a monthly fee for using their TradingView charts in my analysis.

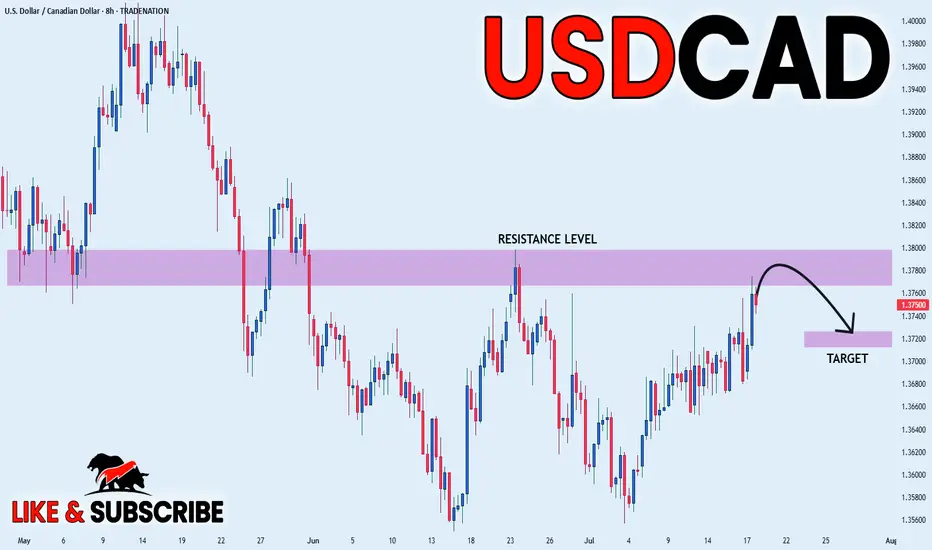
USD_CAD LOCAL SHORT|
✅USD_CAD is going up now
But a strong resistance level is ahead at 1.3800
Thus I am expecting a pullback
And a move down towards the target of 1.3720
SHORT🔥
✅Like and subscribe to never miss a new idea!✅
Disclosure: I am part of Trade Nation's Influencer program and receive a monthly fee for using their TradingView charts in my analysis.
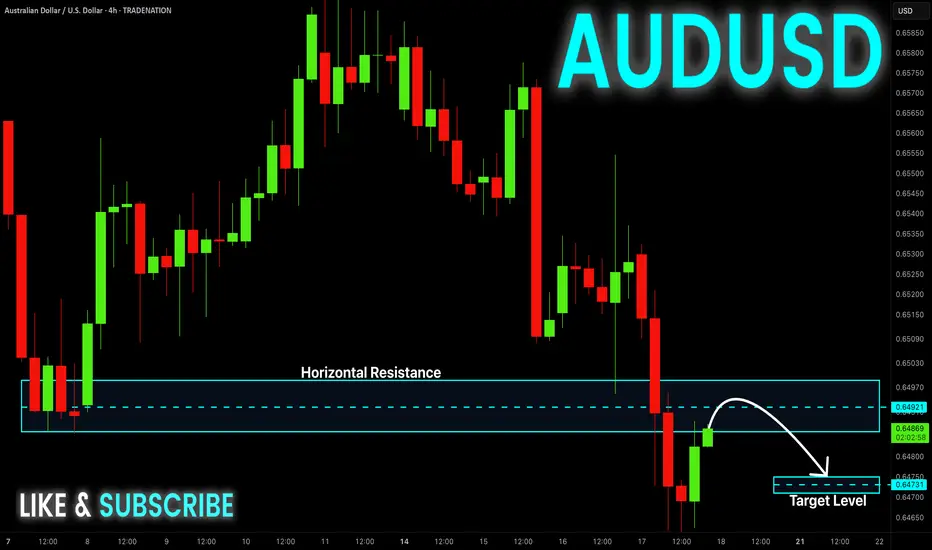
AUD-USD Local Short! Sell!
Hello,Traders!
AUD-JPY is making a bullish
Rebound and the pair is
Making a retest of the key
Horizontal resistance of 0.6497
From where we will be
Expecting a local bearish correction
Sell!
Comment and subscribe to help us grow!
Check out other forecasts below too!
Disclosure: I am part of Trade Nation's Influencer program and receive a monthly fee for using their TradingView charts in my analysis.
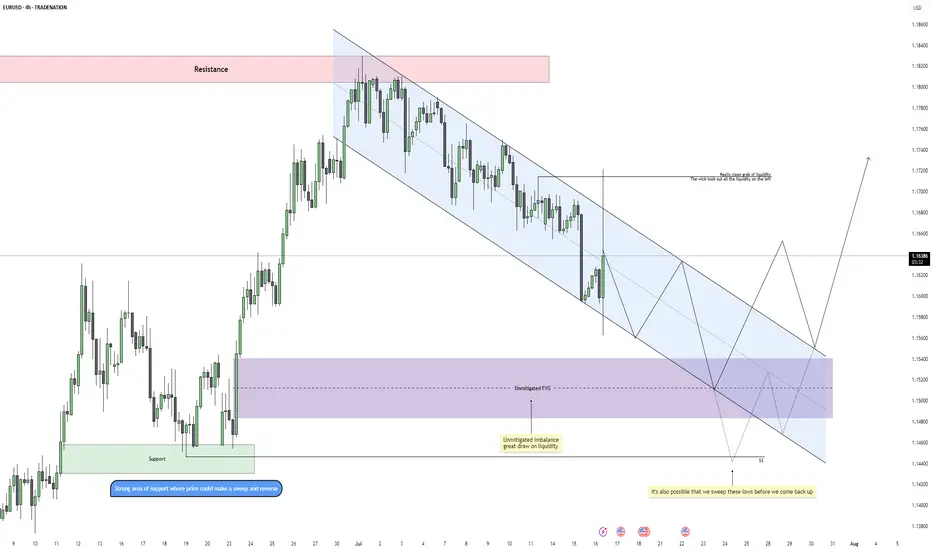
EURUSD – Bearish Rhythm ContinuesEURUSD is currently moving within a well-defined descending channel on the 4H timeframe, maintaining a consistent pattern of lower highs and lower lows. This confirms that bearish order flow remains intact, especially after the recent rejection from the upper boundary of the channel. The previous move up was largely a liquidity grab, taking out short-term highs before swiftly reversing, which adds confluence to a continuation lower.
Liquidity and Imbalance Zones
After sweeping some upside liquidity near 1.1670, price left behind a clean set of equal lows and an unmitigated fair value gap (FVG) sitting below, acting as a magnet. The purple zone marks this FVG, which is likely to be the next area of interest for price as it aligns with the midpoint of the channel and previous demand. Below that, there’s also a clear support region with resting liquidity, giving price a solid reason to reach deeper before reversing.
Projected Path and Channel Dynamics
As long as we remain inside the current bearish channel, we should expect price to respect the internal structure and continue pushing lower. The expectation is for price to trickle down through lower highs and lower lows, tapping into the FVG and potentially sweeping the lows beneath it. The projected internal path mimics this staircase-style movement down before any potential reversal can happen.
Reversal Zone and Bullish Scenario
If price does sweep the lows around 1.1450 and fills the imbalance cleanly, this would create ideal conditions for a bullish reversal. A reaction from this zone could lead to a break of the channel structure, initiating a shift in market sentiment. The upside target, in that case, would be the clean area around 1.1700 where previous liquidity was removed but not yet retested.
Short-Term Expectation
In the short term, the path of least resistance remains bearish. The most probable scenario is a continuation down into the FVG and potential liquidity sweep before we see any meaningful upside. Any premature breakout from the channel without first collecting this liquidity would be viewed as a weak move lacking proper fuel.
Conclusion
EURUSD remains technically bearish while inside the descending channel. Liquidity has been taken on the upside, and the path is now open to target unmitigated imbalances and resting lows. A full sweep into the FVG area could provide the setup for a clean reversal, but until then, trend continuation is favored.
Disclosure: I am part of Trade Nation's Influencer program and receive a monthly fee for using their TradingView charts in my analysis.
___________________________________
Thanks for your support!
If you found this idea helpful or learned something new, drop a like 👍 and leave a comment, I’d love to hear your thoughts! 🚀
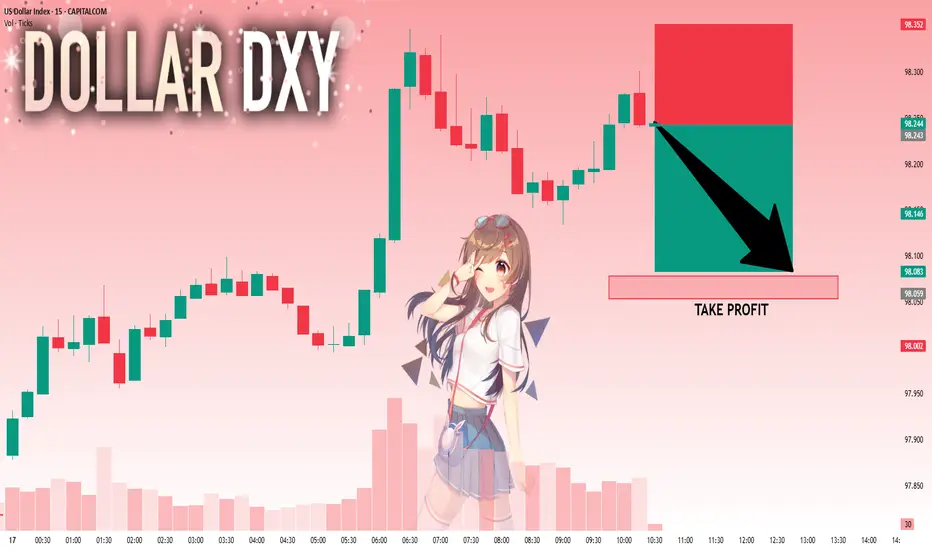
DXY: Next Move Is Down! Short!
My dear friends,
Today we will analyse DXY together☺️
The price is near a wide key level
and the pair is approaching a significant decision level of 98.243 Therefore, a strong bearish reaction here could determine the next move down.We will watch for a confirmation candle, and then target the next key level of 98.078..Recommend Stop-loss is beyond the current level.
❤️Sending you lots of Love and Hugs❤️
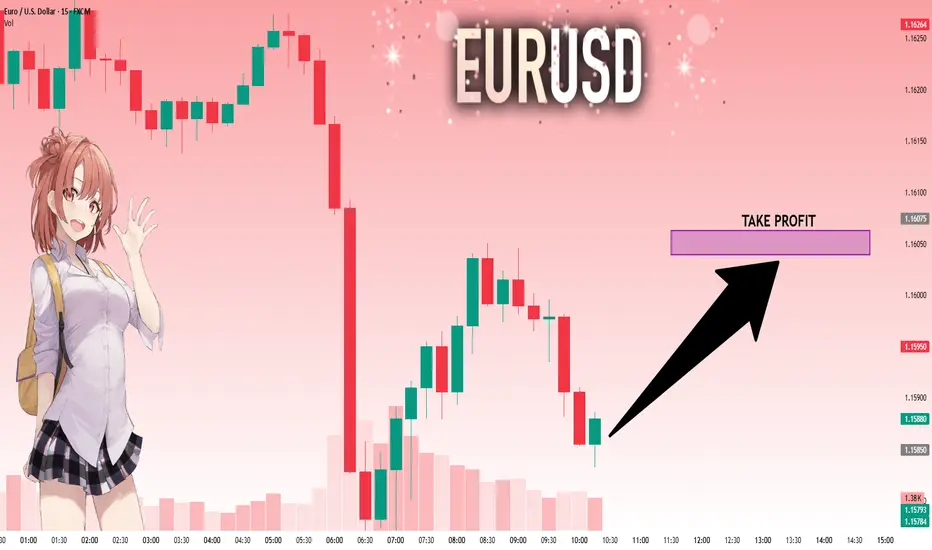
EURUSD: Target Is Up! Long!
My dear friends,
Today we will analyse EURUSD together☺️
The recent price action suggests a shift in mid-term momentum. A break above the current local range around 1.15850 will confirm the new direction upwards with the target being the next key level of 1.16039 and a reconvened placement of a stop-loss beyond the range.
❤️Sending you lots of Love and Hugs❤️
GOLD: Move Up Expected! Long!
My dear friends,
Today we will analyse GOLD together☺️
The in-trend continuation seems likely as the current long-term trend appears to be strong, and price is holding above a key level of 3,327.26 So a bullish continuation seems plausible, targeting the next high. We should enter on confirmation, and place a stop-loss beyond the recent swing level.
❤️Sending you lots of Love and Hugs❤️

SILVER: Local Bearish Bias! Short!
My dear friends,
Today we will analyse SILVER together☺️
The market is at an inflection zone and price has now reached an area around 37.832 where previous reversals or breakouts have occurred.And a price reaction that we are seeing on multiple timeframes here could signal the next move down so we can enter on confirmation, and target the next key level of 37.762..Stop-loss is recommended beyond the inflection zone.
❤️Sending you lots of Love and Hugs❤️

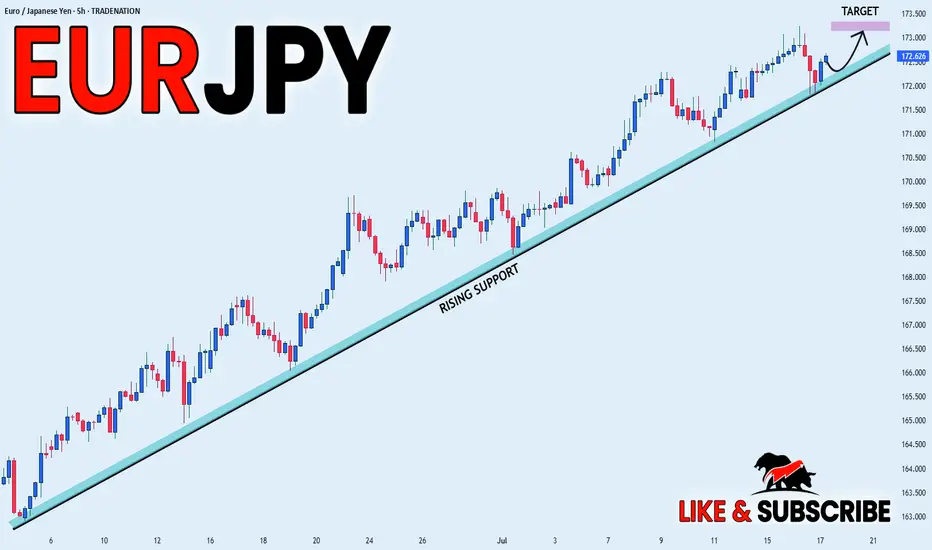
EUR_JPY WILL GO UP|LONG|
✅EUR_JPY is trading along the rising support line
And as the pair is going up now
After the retest of the line
I am expecting the price to keep growing
To retest the supply levels above at 173.166
LONG🚀
✅Like and subscribe to never miss a new idea!✅
Disclosure: I am part of Trade Nation's Influencer program and receive a monthly fee for using their TradingView charts in my analysis.
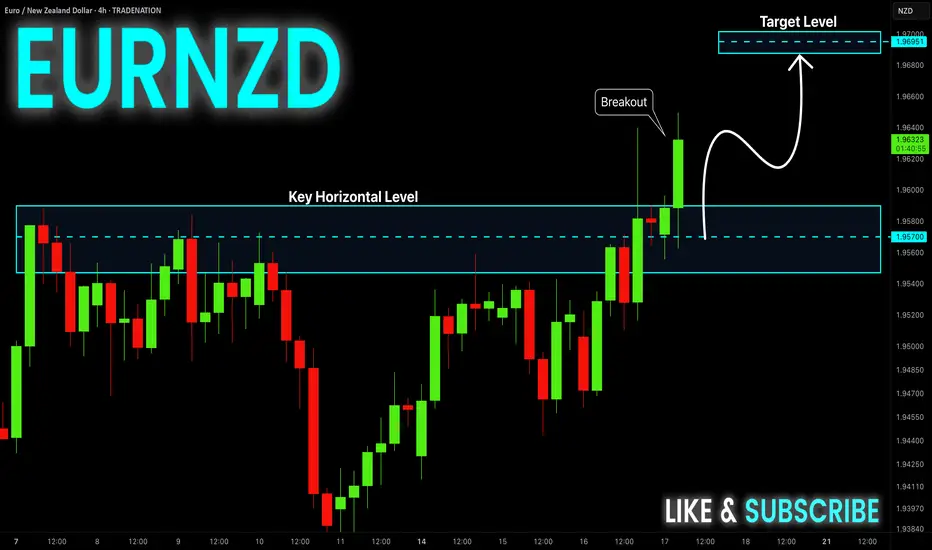
EUR-NZD Will Keep Growing! Buy!
Hello,Traders!
EUR-NZD is trading in a
Strong uptrend and the
Pair made a bullish breakout
Of the key horizontal level
Of 1.9580 so we are bullish
Biased and we will be expecting
A further bullish move up
Buy!
Comment and subscribe to help us grow!
Check out other forecasts below too!
Disclosure: I am part of Trade Nation's Influencer program and receive a monthly fee for using their TradingView charts in my analysis.
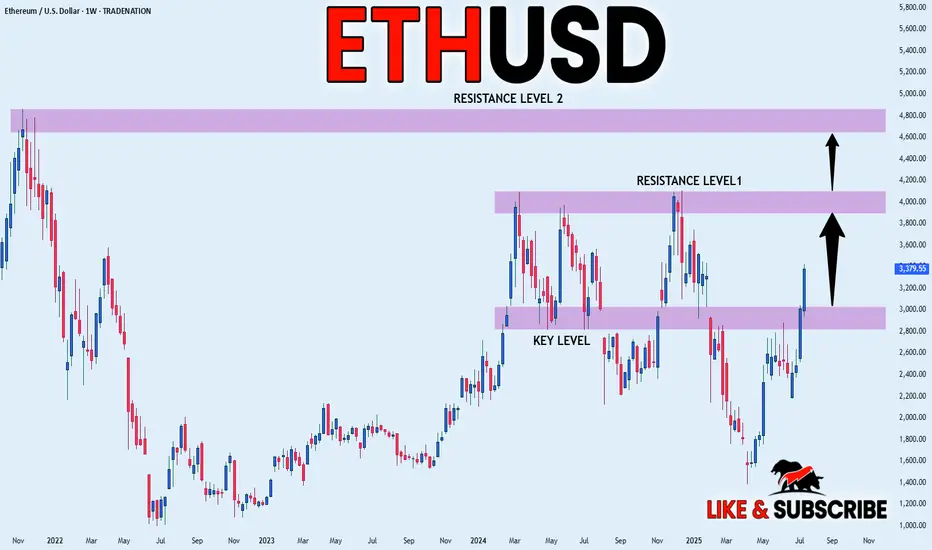
ETHEREUM WILL KEEP GROWING|LONG|
✅ETHEREUM is trading in a
Strong uptrend and the coin
Broke the important horizontal level
Of 3000$ which is now a support
And we are very bullish biased
And we think that ETH will
Reach at least the previous ATH
Of just short of 5000$ but the
First target is to reach and break
A resistance level of 4100$
LONG🚀
✅Like and subscribe to never miss a new idea!✅
Disclosure: I am part of Trade Nation's Influencer program and receive a monthly fee for using their TradingView charts in my analysis.
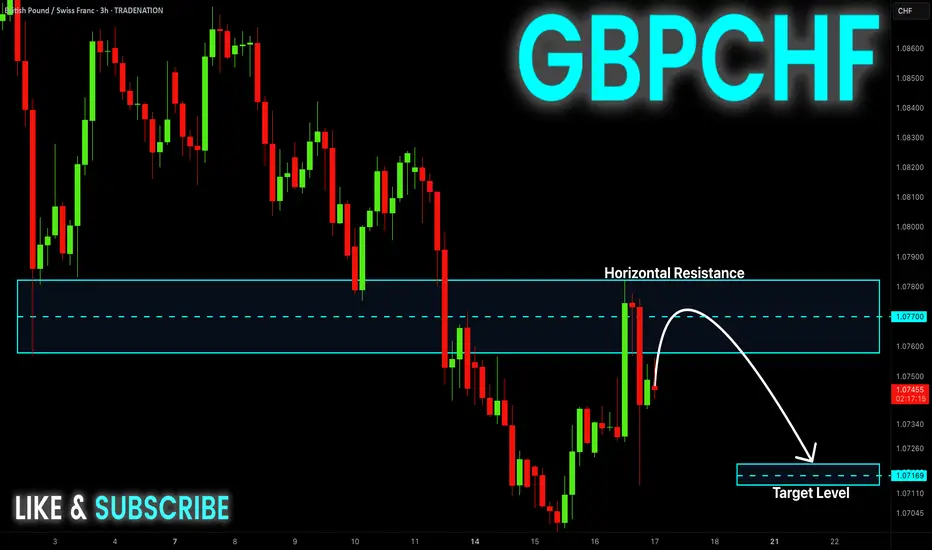
GBP-CHF Local Short! Sell!
Hello,Traders!
GBP-CHF made a retest of
The wide horizontal resistance
Of 1.0780 and we are already
Seeing a bearish pullback
So as the pair is trading in a
Downtrend we will be expecting
A further bearish move down
Sell!
Comment and subscribe to help us grow!
Check out other forecasts below too!
Disclosure: I am part of Trade Nation's Influencer program and receive a monthly fee for using their TradingView charts in my analysis.
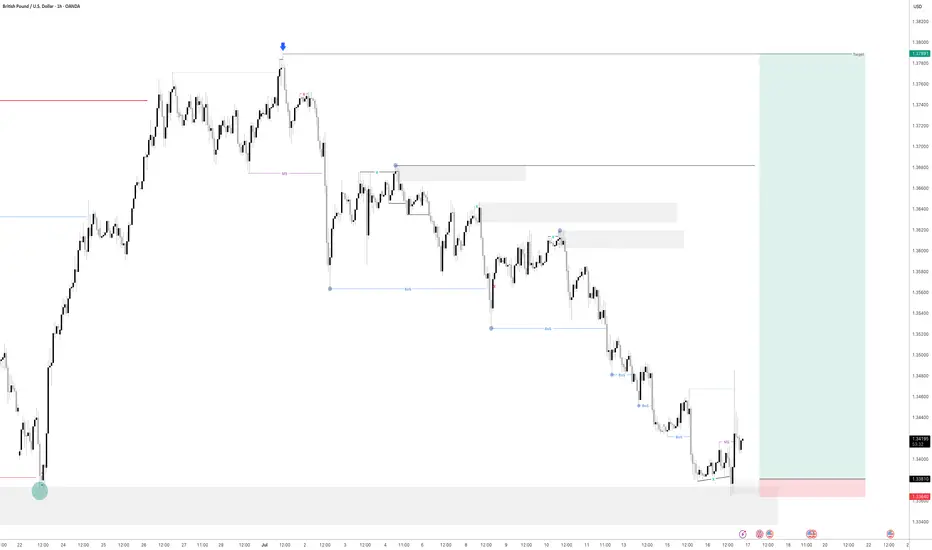
GBPUSD - Is it Ready? Looking at GBPUSD
We have had a Market shift to the upside from a HTF Point of Interest. I am now waiting for price to come back into a 15min demand area and hopefully price will take off to the upside from here.
We have also swept liquidity before a drastic move to the upside.
Lets see how this one plays out
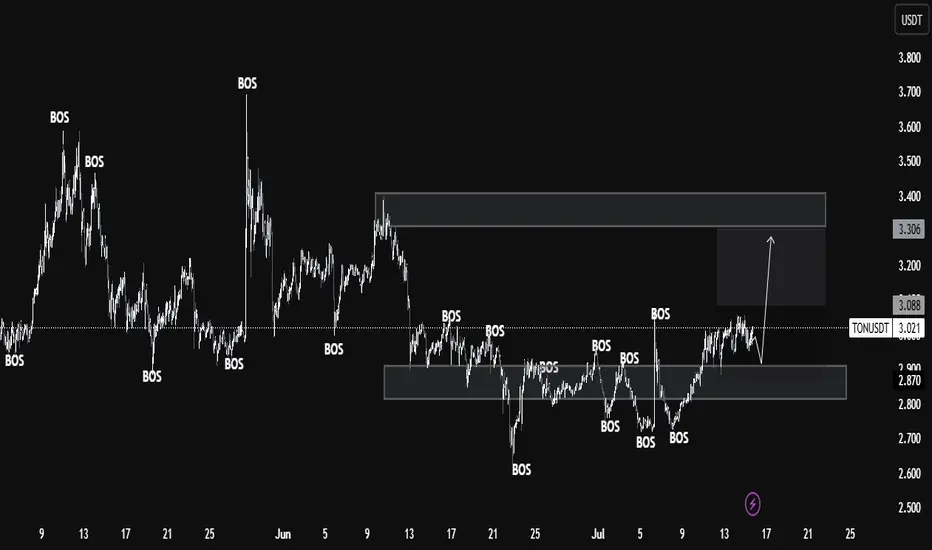
TON/USDT Monthly Structure Flip – Smart Money Targets $3.30+ Aft🔍 Key Observations:
Current Price: 2.974 USDT
Support Zone (Demand Area):
Strong demand zone around 2.870 - 2.800 USDT.
Price previously reacted multiple times from this zone, showing strong buyer interest and BOS confirmations.
Resistance Zone (Supply Area):
The next significant resistance lies in the range of 3.306 - 3.400 USDT.
This zone previously caused a BOS to the downside, making it a critical level to monitor for potential profit-taking or reversals.
Market Structure:
Price is currently consolidating just above the demand zone after a bullish BOS.
Recent BOS confirms a shift in structure from bearish to bullish bias.
Potential Price Path:
If price sustains above the 2.870 support, a bullish move targeting the 3.306 level is likely.
Expect short-term retracements within the structure but with a medium-term bullish bias.
Liquidity Mapping:
Liquidity is likely resting above the 3.088 local highs and the 3.306 major resistance.
Smart money may push price to these levels to mitigate orders or engineer exit liquidity.
📈 Educational Perspective:
This chart is a strong representation of Smart Money Concepts (SMC), particularly the use of BOS as confirmation for directional bias. Traders can look to:
Use the demand zone for potential long entries.
Watch for confirmation (like bullish engulfing or internal BOS) within the zone.
Manage trades toward the premium zone near 3.3 for a favorable risk-reward.
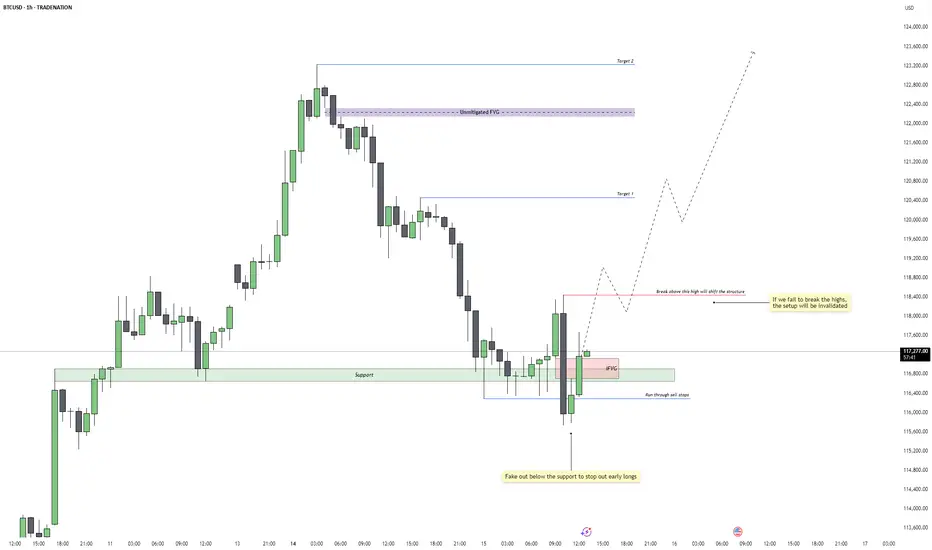
Bitcoin - Reversal Setup or Just a Trap Reset?Price faked below the 1H support zone around 115,800, triggering a clean run through resting sell stops. This classic liquidity sweep flushed out early long positions before immediately reclaiming the range. The move aggressively filled a prior imbalance and flipped sentiment just when it seemed the trend might break lower. The quick rejection and recovery from this level suggests smart money accumulation beneath support.
Formation of a 1H Inversion Fair Value Gap
The rebound from the liquidity grab printed a bullish 1H inversion FVG, now acting as a potential launchpad for continuation. This FVG coincides with the same zone that was previously support, now carrying added confluence. As long as price remains above this gap, the reaction shows bullish intent, with buyers reclaiming initiative after a shakeout.
Trend Shift Trigger and Invalidation Level
The current structure remains technically bearish until we break above the marked 1H high at 118,400. That level is the structure shift trigger. A decisive close above it would confirm a market structure shift and open the door to a broader bullish continuation. However, failure to close above this high would invalidate the setup and suggest that the move from support was just a temporary retracement rather than a full reversal.
Upside Targets and Continuation Outlook
If we get the bullish break above 118,400, I’m looking for price to reach Target 1 near 120,400, followed by Target 2 around the unmitigated FVG at 122,200. These levels align with clean inefficiencies that are likely to get filled if the market gains momentum. With enough volume behind the breakout, BTC could push into ATH territory above 123K as part of a larger macro expansion.
Volume and Higher Timeframe Context
Volume is the final key piece. We need strong follow-through above 118,400 for the setup to remain valid. Weak rejection or consolidation below that red line would signal distribution and potential failure. On the higher timeframes, BTC still looks constructive, but the 1H structure must confirm by breaking higher, or the broader bullish case will need to be re-evaluated.
Conclusion
BTC swept 1H support, ran stops, and printed a bullish inversion FVG. A break and close above 118,400 would confirm trend reversal and initiate a move toward 120,400 and 122,200. If we fail to close above that level, this setup is invalidated and the range could continue or break lower.
Disclosure: I am part of Trade Nation's Influencer program and receive a monthly fee for using their TradingView charts in my analysis.
___________________________________
Thanks for your support!
If you found this idea helpful or learned something new, drop a like 👍 and leave a comment, I’d love to hear your thoughts! 🚀
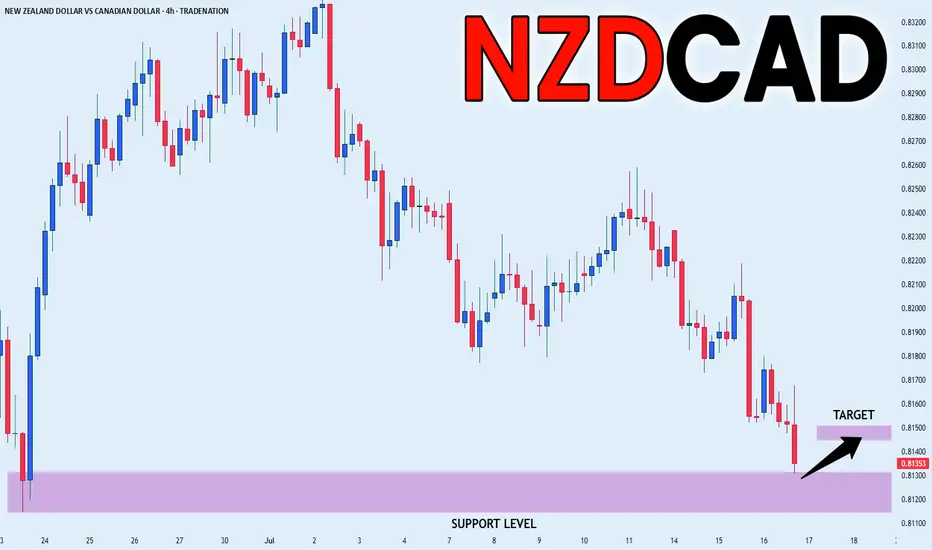
NZD_CAD LOCAL LONG|
✅NZD_CAD is set to retest a
Strong support level below at 0.8114
After trading in a local downtrend for some time
Which makes a bullish rebound a likely scenario
With the target being a local resistance above at 0.8145
LONG🚀
✅Like and subscribe to never miss a new idea!✅
Disclosure: I am part of Trade Nation's Influencer program and receive a monthly fee for using their TradingView charts in my analysis.