GOLD FULL UPDATE – July 15, 2025 | Post-CPI TrapPost-CPI Flip Zone Battle
Hello dear traders 💛
Today has been one of those heavy CPI days — full of volatility, sweeps, and doubt. But if we read it structurally and stop chasing candles, everything makes sense. Let’s break it all down step by step, clearly and human-like.
Current Price: 3330
Bias: Short-term bearish, reactive bounce underway
Focus Zone: 3319–3320 liquidity sweep + key decision structure unfolding
🔹 Macro Context:
CPI came in slightly hot year-over-year (2.7% vs 2.6%) while monthly stayed in-line at 0.3%. That gave the dollar a short-lived boost, and gold reacted exactly how institutions love to play it — sweeping liquidity under 3320, then pausing. Not falling, not flying. Just... thinking.
That reaction matters. Why? Because it shows us indecision. It tells us that gold isn’t ready to break down fully yet, and every aggressive move today was part of a calculated shakeout.
🔹 Daily Structure:
Gold is still stuck below the premium supply zone of 3356–3380. Every attempt to rally there for the past few weeks has failed — including today.
The discount demand area between 3280–3240 is still intact and untouched. So what does this mean?
We are in a macro-range, and price is simply rotating between key structural edges.
🔹 H4 View:
The rejection from CPI at 3355–3365 created a micro CHoCH, signaling the bullish leg is now broken.
After the 3345 fail, price dropped to 3320 — but it hasn’t tapped the full H4 demand at 3310–3300.
H4 EMAs are tilting down, showing pressure. This isn’t a breakout. It’s a correction inside a larger range.
🔸 Key H4 Supply Zones:
3345–3355: liquidity reaction during CPI
3365–3375: untested OB + remaining buy-side liquidity
🔸 Key H4 Demand Zones:
3310–3300: mitigation zone from the CHoCH
3282–3270: deep discount and bullish continuation zone if current fails
Structure-wise: We are in a correction, not a clean uptrend. That’s why every bullish attempt fails unless confirmed.
🔹 H1 Real Structure
This is where things got tricky today.
Price formed a bullish BOS back on July 14, when we first pushed into 3370. That was the start of the bullish leg.
But today, we revisited the origin of that BOS, right near 3320. This is a sensitive zone.
If it holds → it’s still a retracement.
If it breaks → we lose the bullish structure and shift full bearish.
So far, price touched 3320, bounced weakly, but has not printed a bullish BOS again.
🔸 H1 Zones of Interest:
Supply above:
3340–3345: micro reaction zone
3355–3365: CPI origin rejection
3370–3375: final inducement
Demand below:
3310–3300: current flip test
3282–3270: if this breaks, bias flips bearish
Right now, we are between zones. Price is undecided. RSI is oversold, yes — but that alone is never a reason to buy. We need structure. We need BOS.
🔻 So… What’s the Truth Right Now?
✅ If 3310–3300 holds and price builds BOS on M15 → a clean long opportunity develops
❌ If 3310 breaks, and we lose 3300, structure fully shifts and opens downside to 3280–3270
On the upside:
Only look for rejections from 3355–3365 and 3370–3375
Anything inside 3325–3340 is noise. No structure, no clean RR.
Final Thoughts:
Today’s move was not random. It was a classic CPI trap: induce longs early, trap shorts late, and leave everyone confused in the middle.
But we don’t trade confusion — we wait for structure to align with the zone.
If M15 or H1 prints a BOS from demand, that’s your green light.
If price collapses under 3300, flip your bias. The chart already told you it wants lower.
No predictions. Just real reaction.
—
📣 If you like clear and simple plans, please like, comment, and follow.
Stay focused. Structure always wins.
📢 Disclosure: This analysis was created using TradingView charts through my Trade Nation broker integration. As part of Trade Nation’s partner program, I may receive compensation for educational content shared using their tools.
— With clarity,
GoldFxMinds
SMC

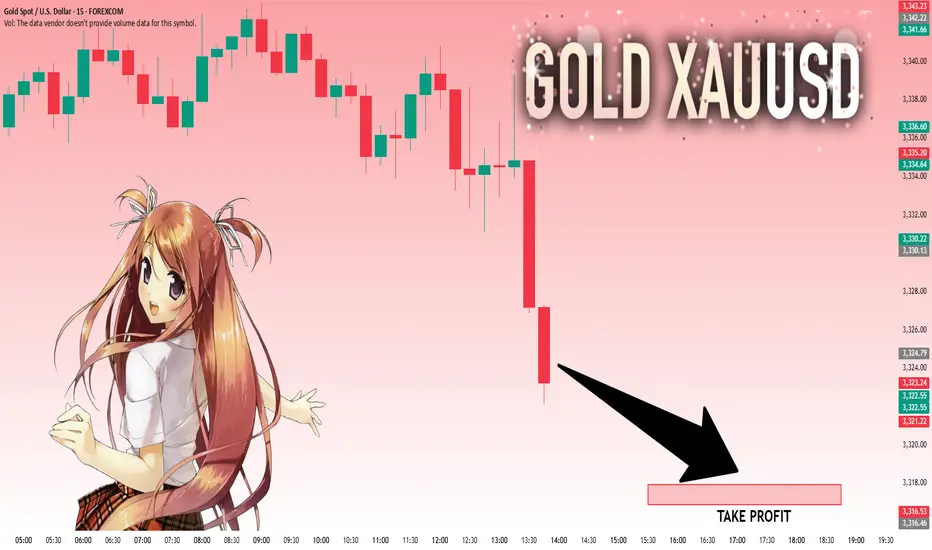
GOLD: Absolute Price Collapse Ahead! Short!
My dear friends,
Today we will analyse GOLD together☺️
The price is near a wide key level
and the pair is approaching a significant decision level of 3.324.79 Therefore, a strong bearish reaction here could determine the next move down.We will watch for a confirmation candle, and then target the next key level of 3,317.96..Recommend Stop-loss is beyond the current level.
❤️Sending you lots of Love and Hugs❤️
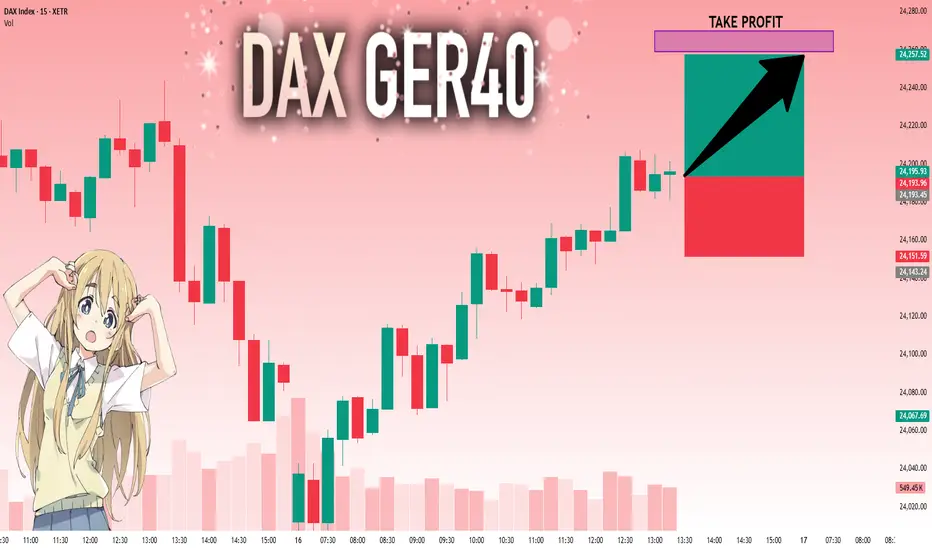
DAX: Will Go Up! Long!
My dear friends,
Today we will analyse DAX together☺️
The recent price action suggests a shift in mid-term momentum. A break above the current local range around 24,193.45 will confirm the new direction upwards with the target being the next key level of 24,258.97 and a reconvened placement of a stop-loss beyond the range.
❤️Sending you lots of Love and Hugs❤️
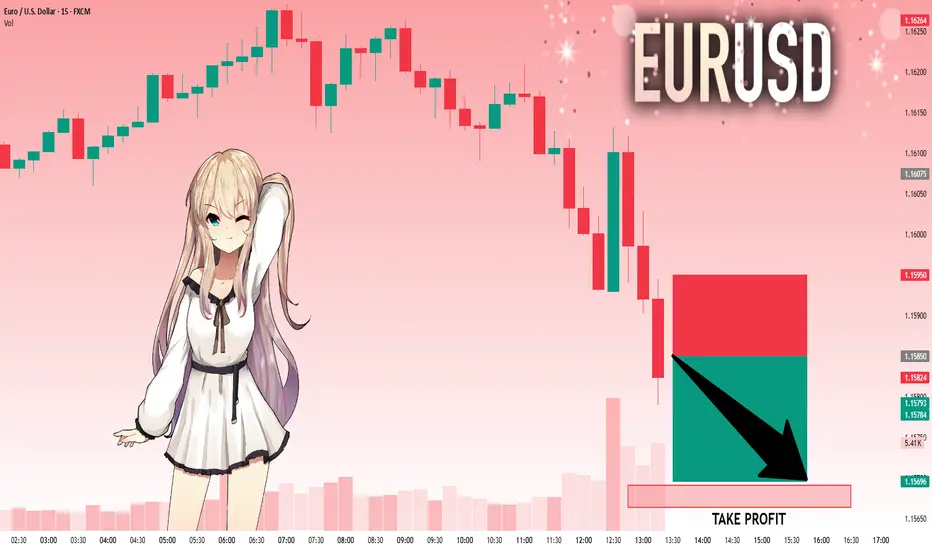
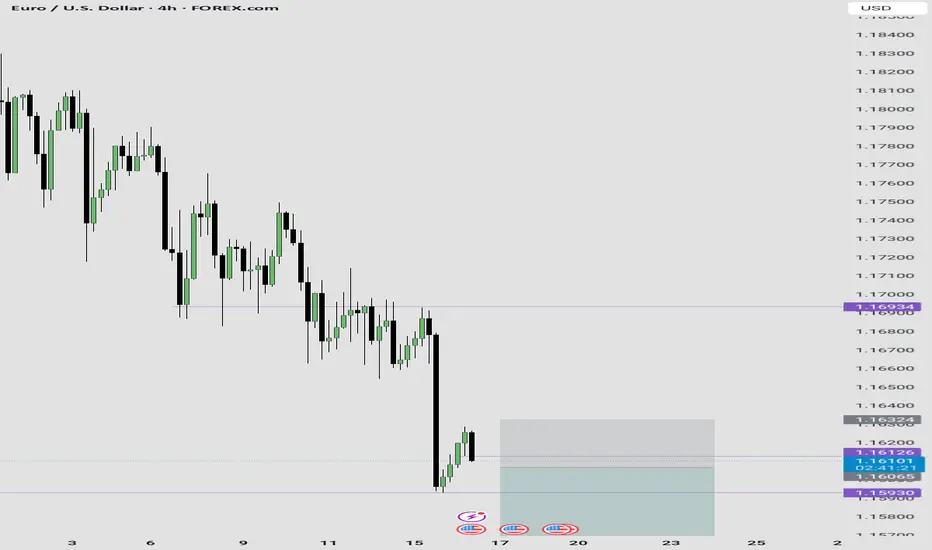
EURUSD: The Market Is Looking Down! Short!
My dear friends,
Today we will analyse EURUSD together☺️
The in-trend continuation seems likely as the current long-term trend appears to be strong, and price is holding below a key level of 1.15850 So a bearish continuation seems plausible, targeting the next low. We should enter on confirmation, and place a stop-loss beyond the recent swing level.
❤️Sending you lots of Love and Hugs❤️
SILVER: Strong Bullish Sentiment! Long!
My dear friends,
Today we will analyse SILVER together☺️
The market is at an inflection zone and price has now reached an area around 37.873 where previous reversals or breakouts have occurred.And a price reaction that we are seeing on multiple timeframes here could signal the next move down so we can enter on confirmation, and target the next key level of 37.962..Stop-loss is recommended beyond the inflection zone.
❤️Sending you lots of Love and Hugs❤️

EURUSD SHORT SETUP4hour structure is extremely bearish creating series of lower lows and lower highs.
Couple with the fact that GBPUSD is also bearish, while DXY is bullish.
So, I expect price to move lower and break the major swing low below price.
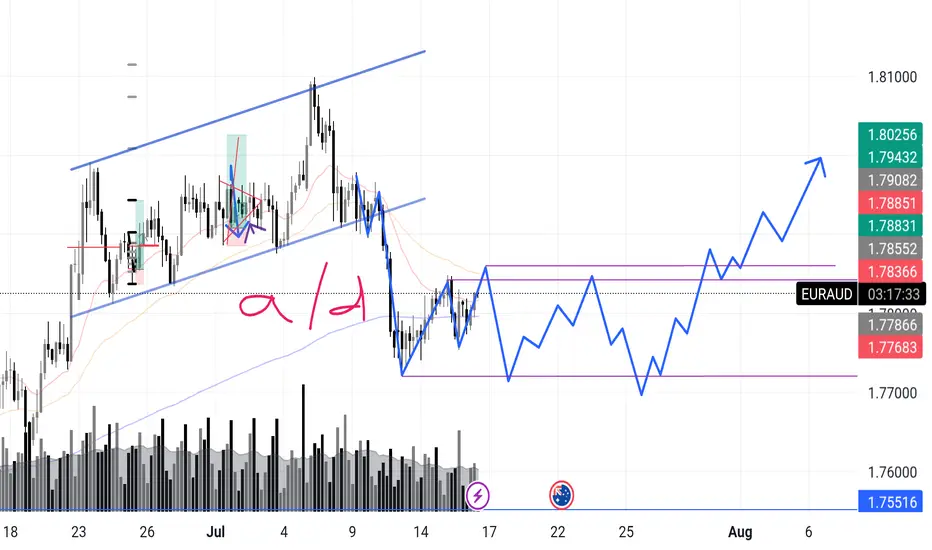
EURAUD – Incoming Upthrust? Accumulation or Distribution? Chart Context:
EURAUD recently completed a sharp markdown after a textbook rising channel break. What’s interesting now is that price has entered what looks like a potential box range between 1.7768 and 1.7885.
I'm anticipating a possible upthrust move into the 1.788x zone — and what follows will reveal the true intent.
Here’s the internal debate:
Are we looking at reaccumulation — smart money trapping shorts before driving higher in line with broader money flow?
Or is this a distribution — where the market builds a false sense of support before deeper downside?
🔍 What tips the scale for now is this:
>The overall money flow direction (via volume patterns + structure) has leaned bullish, so I’m favoring accumulation with a shakeout scenario.
Signs I’m watching:
✅ Absorption volume near the bottom of the range
✅ Higher lows inside the zone
✅ Fake breakout / upthrust into prior structure
❌ Failure to hold above 1.7855 could flip the bias short-term
📉 Expecting one more dip to test demand, followed by range tightening, and if buyers show up strong — the breakout can get explosive.
What’s your take?
Are we prepping for a markup or will this fakeout and roll over?
"I go long or short as close as I can to the danger point, and if the danger becomes real, I close out and take a small loss"
USDJPY - Time to sell short term i believeHave a pending order waiting to be triggered on UJ
Will see how we go if we get tagged in
Bitcoin - V-shape recovery down towards the 4h FVG at $111.000?The move began with a strong rally that peaked near the $123,000 level. After hitting that high, Bitcoin quickly reversed and sold off aggressively, forming a classic V-shaped pattern. This type of formation typically indicates a strong shift in momentum, where bullish control is quickly overtaken by sellers, leading to swift downward movement.
4H bearish FVG
Shortly after the initial drop, Bitcoin made a retest of the bearish 4H FVG (Fair Value Gap) around the $119,000 to $120,500 zone. This fair value gap was created during the sharp move down and represented an area of inefficiency in price. The chart shows that price moved back into this zone and was “perfectly retested,” getting rejected almost immediately. This rejection confirmed that sellers are respecting this imbalance, turning it into a short-term resistance level.
Market structure
As the price failed to reclaim the fair value gap and continued lower, it broke the market structure at around $117,000. This break suggests that the previous higher low was taken out, signaling a bearish shift in the intermediate trend. The market structure break often acts as confirmation that buyers are losing control and lower prices are likely.
CME gap
Adding to the downside pressure is the CME gap, labeled as the "BTC CME GAP" on the chart. This gap spans from roughly $114,000 to $116,300 and was formed over the weekend when the CME (Chicago Mercantile Exchange) was closed. Historically, Bitcoin has shown a tendency to "fill" these gaps by revisiting the price levels within them. The current price action has already started to dip into this region, which could suggest further downside to complete the gap fill.
Bullish 4H FVG with support
Finally, the chart hints at the potential drop to the lowest 4H FVG and previous resistance, located just above $111,000. This fair value gap aligns closely with a prior resistance level from earlier in the month, making it a logical magnet for price if selling pressure persists. It represents a confluence zone where buyers may look to step in again, especially if the CME gap is filled and the market is searching for support.
Conclusion
In summary, Bitcoin is showing bearish technical signs following a V-shape top and a strong rejection from the 4H FVG at $120,000. The break of market structure and ongoing fill of the CME gap suggest that further downside toward the $111,000 level is a strong possibility. Traders should watch closely for price reaction in that lower fair value gap zone, as it could serve as a critical area for a potential bounce.
Disclosure: I am part of Trade Nation's Influencer program and receive a monthly fee for using their TradingView charts in my analysis.
Thanks for your support. If you enjoyed this analysis, make sure to follow me so you don't miss the next one. And if you found it helpful, feel free to drop a like and leave a comment, I’d love to hear your thoughts!

GOLD LONG FROM RISING SUPPORT|
✅GOLD is trading in an uptrend
Which makes me bullish biased
And the price is retesting the rising support
Thus, a rebound and a move up is expected
With the target of retesting the level above at 3,350$
LONG🚀
✅Like and subscribe to never miss a new idea!✅
Disclosure: I am part of Trade Nation's Influencer program and receive a monthly fee for using their TradingView charts in my analysis.
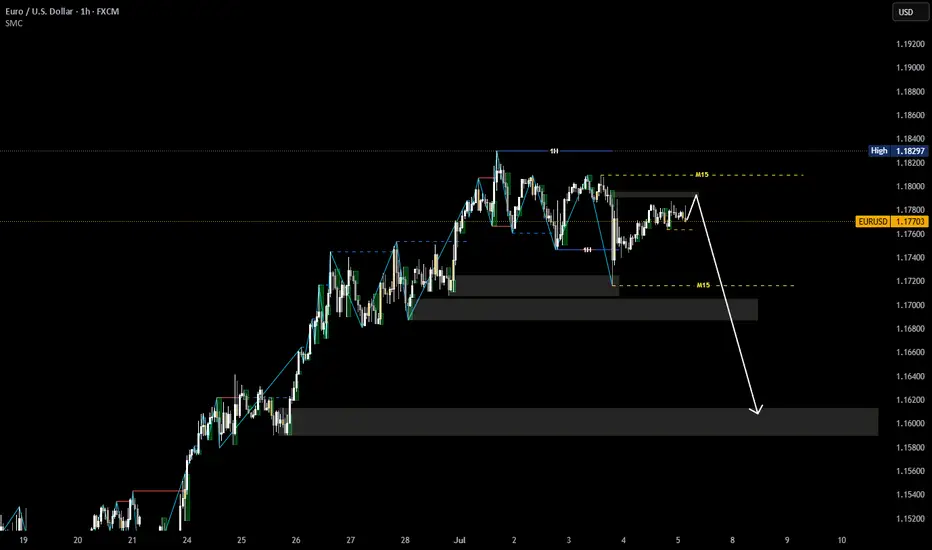
EURUSD structure analysis on M15 and H1- 4H swing is bullish, currently is pullback
- 1H, M15 swing is bearish, current is pullback.
- We can look for selling opportunities according to the wave configuration of H1 and M15 timeframes
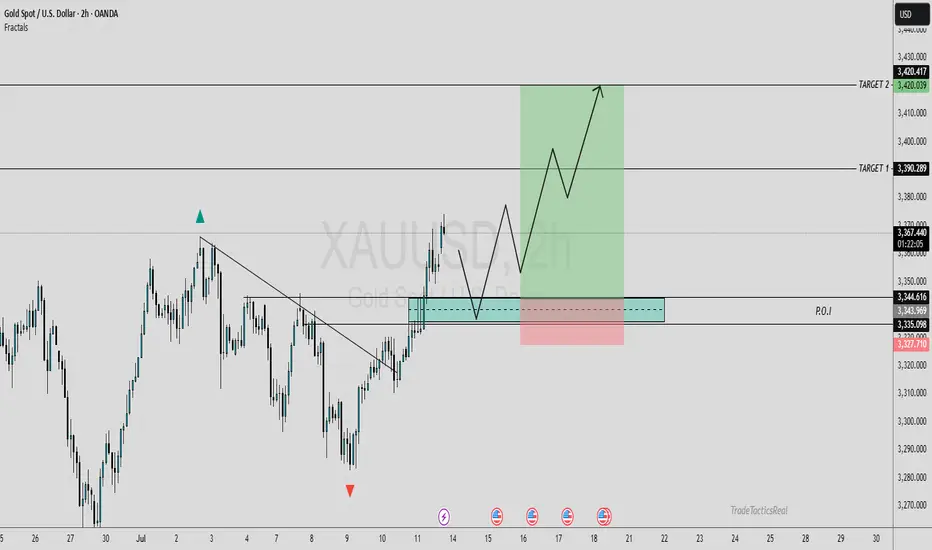
XAUUSD ANALYSISOn gold currently we're analyzing 2H time frame. As we know that current trend was bullish. At this stage, I'm anticipating a retracement towards my Point of Interest (POI), where I’ll be looking for a clear bullish confirmation, ideally through candlestick structure or solid price action. Only upon receiving that confirmation will I consider entering a buy position.
This outlook is based on the higher time frame structure. For now, I'm observing patiently to see how price unfolds. Until the market sweeps the SSL liquidity, I will remain on the sidelines no entries until that key liquidity level has been taken. Confirmation is key.
Always use stoploss for your trade.
Always use proper money management and proper risk to reward ratio.
#XAUUSD 2H Technical Analysis Expected Move.
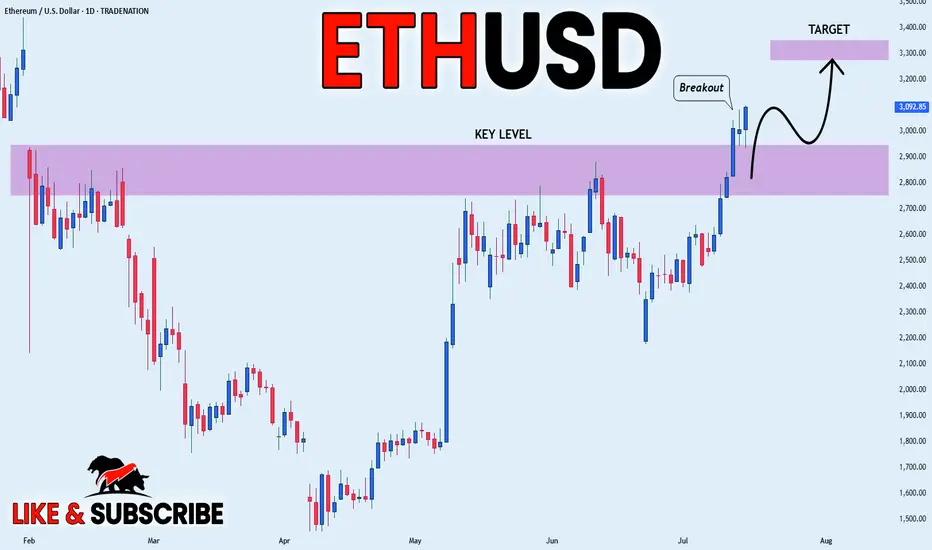
ETHEREUM WILL KEEP GROWING|LONG|
✅ETHEREUM is going up
Now and the coin made a bullish
Breakout of the key horizontal
Level of 3000$ and the breakout
Is confirmed so we are bullish
Biased and we will be expecting
A further bullish move up
LONG🚀
✅Like and subscribe to never miss a new idea!✅
Disclosure: I am part of Trade Nation's Influencer program and receive a monthly fee for using their TradingView charts in my analysis.
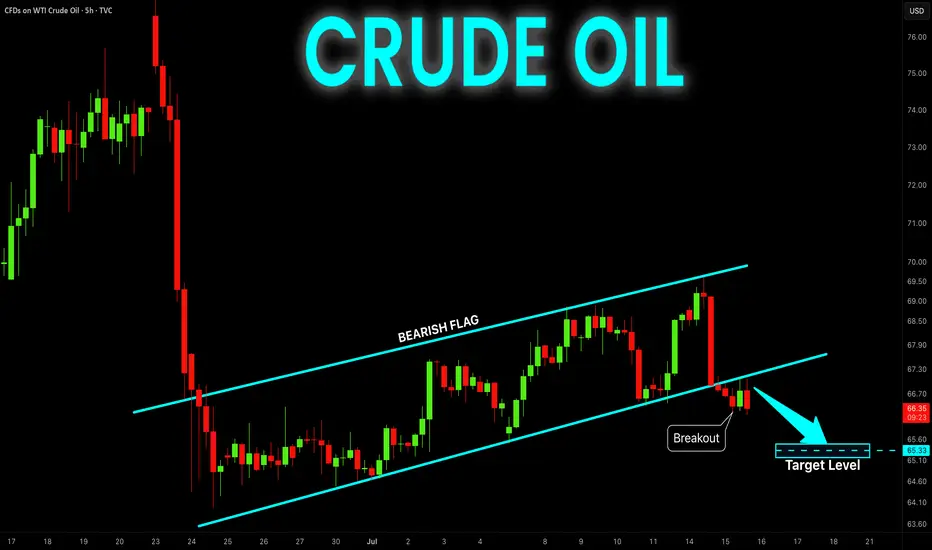
CRUDE OIL Bearish Flag Breakout! Sell!
Hello,Traders!
CRUDE OIL is trading in a local
Downtrend and formed a bearish
Flag pattern and now we are
Seeing a bearish breakout
So we are bearish biased
And we will be expecting
A further bearish move down
Sell!
Comment and subscribe to help us grow!
Check out other forecasts below too!
Disclosure: I am part of Trade Nation's Influencer program and receive a monthly fee for using their TradingView charts in my analysis.
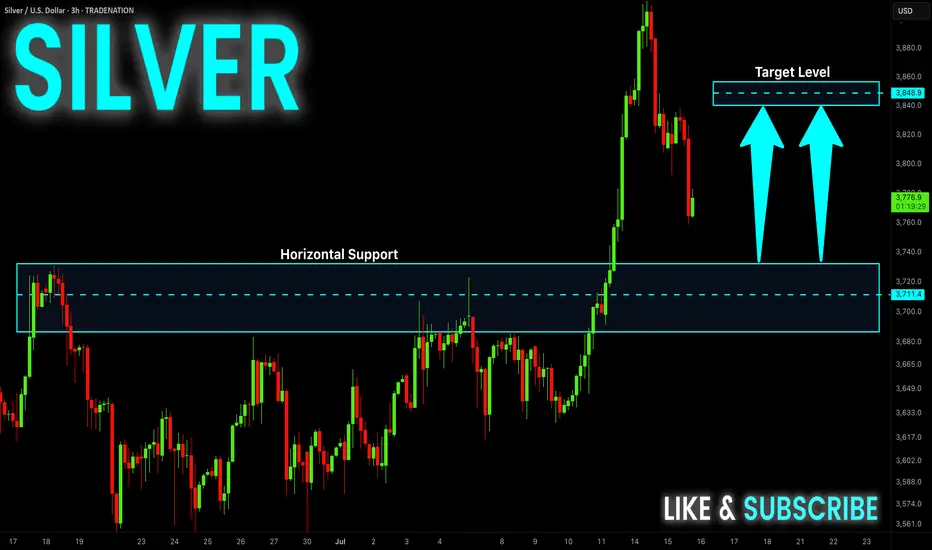
SILVER Support Ahead! Buy!
Hello,Traders!
SILVER is going down now
But the price is trading in a
Long-term uptrend so we are
Bullish biased and after the
Price retests of the horizontal
Support support below
Around 37.20$ we will be
Expecting a bullish rebound
Buy!
Comment and subscribe to help us grow!
Check out other forecasts below too!
Disclosure: I am part of Trade Nation's Influencer program and receive a monthly fee for using their TradingView charts in my analysis.
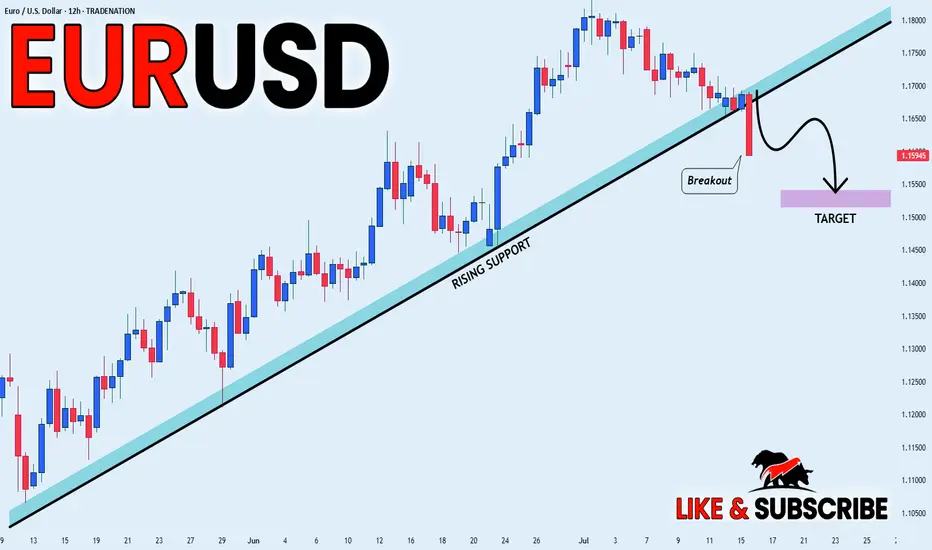
EUR_USD BEARISH BREAKOUT|SHORT|
✅EUR_USD was trading along
The rising support line but
Now we are seeing a strong bearish
Breakout and the breakout is
Confirmed so we are bearish
Biased and we will be expecting
A further bearish move down
After the potential pullback
SHORT🔥
✅Like and subscribe to never miss a new idea!✅
Disclosure: I am part of Trade Nation's Influencer program and receive a monthly fee for using their TradingView charts in my analysis.
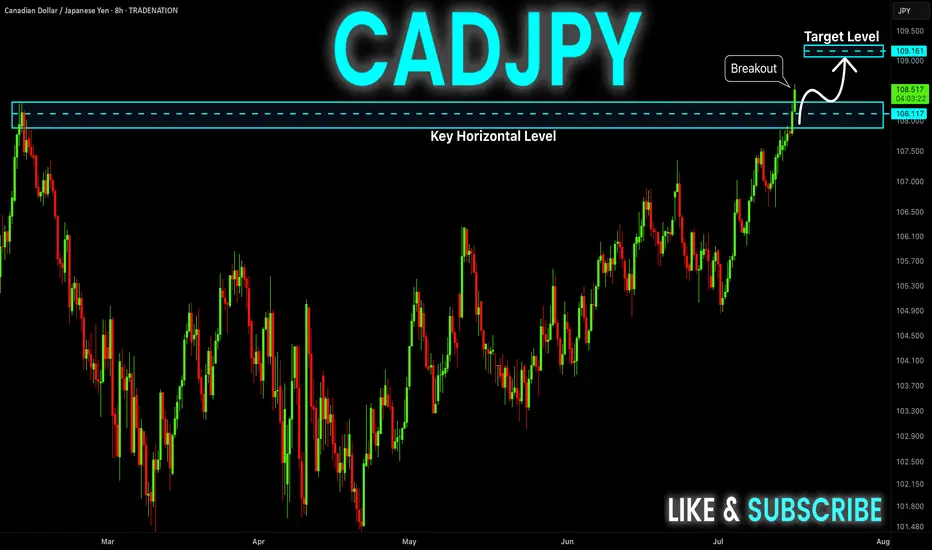
CAD-JPY Strong Bullish Breakout! Buy!
Hello,Traders!
CAD-JPY keeps trading in a
Strong uptrend and the pair
Made a strong bullish breakout
Of the key horizontal level
Of 108.299 so we are bullish
Biased and we will be expecting
A further bullish move up
Buy!
Comment and subscribe to help us grow!
Check out other forecasts below too!
Disclosure: I am part of Trade Nation's Influencer program and receive a monthly fee for using their TradingView charts in my analysis.
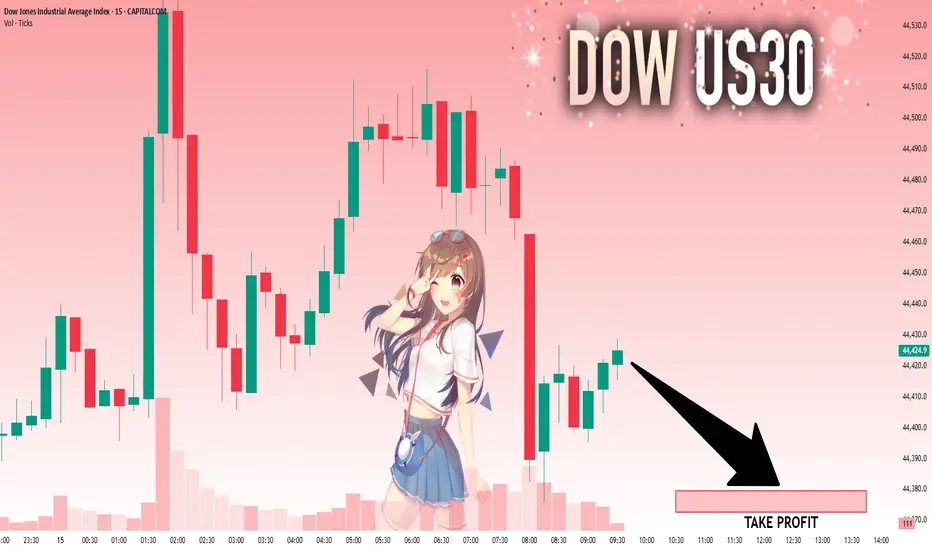
US30: Bears Are Winning! Short!
My dear friends,
Today we will analyse US30 together☺️
The price is near a wide key level
and the pair is approaching a significant decision level of 44,420.7 Therefore, a strong bearish reaction here could determine the next move down.We will watch for a confirmation candle, and then target the next key level of 44,379.6..Recommend Stop-loss is beyond the current level.
❤️Sending you lots of Love and Hugs❤️
SILVER: Next Move Is Down! Short!
My dear friends,
Today we will analyse SILVER together☺️
The recent price action suggests a shift in mid-term momentum. A break above the current local range around 38.253 will confirm the new direction upwards with the target being the next key level of 38.151 and a reconvened placement of a stop-loss beyond the range.
❤️Sending you lots of Love and Hugs❤️

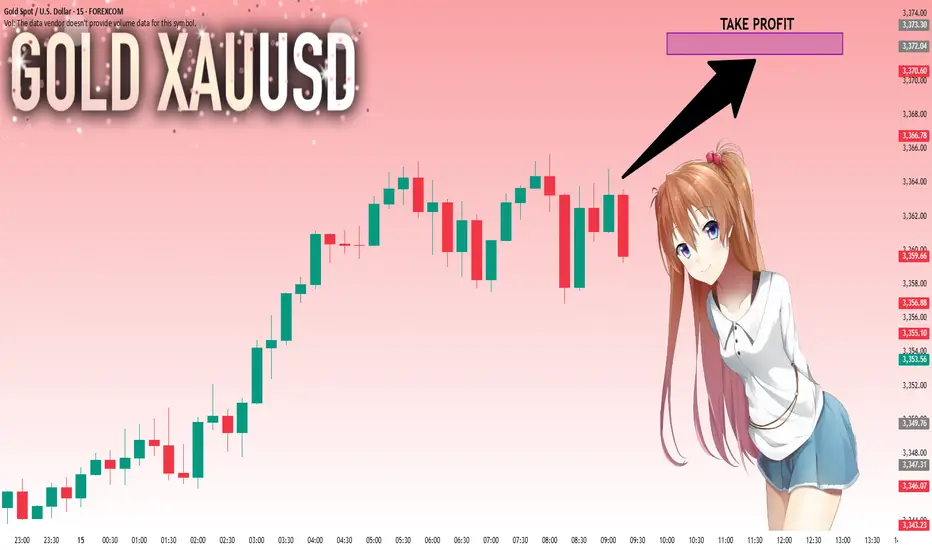
GOLD: Target Is Up! Long!
My dear friends,
Today we will analyse GOLD together☺️
The in-trend continuation seems likely as the current long-term trend appears to be strong, and price is holding above a key level of 3,363.43 So a bullish continuation seems plausible, targeting the next high. We should enter on confirmation, and place a stop-loss beyond the recent swing level.
❤️Sending you lots of Love and Hugs❤️
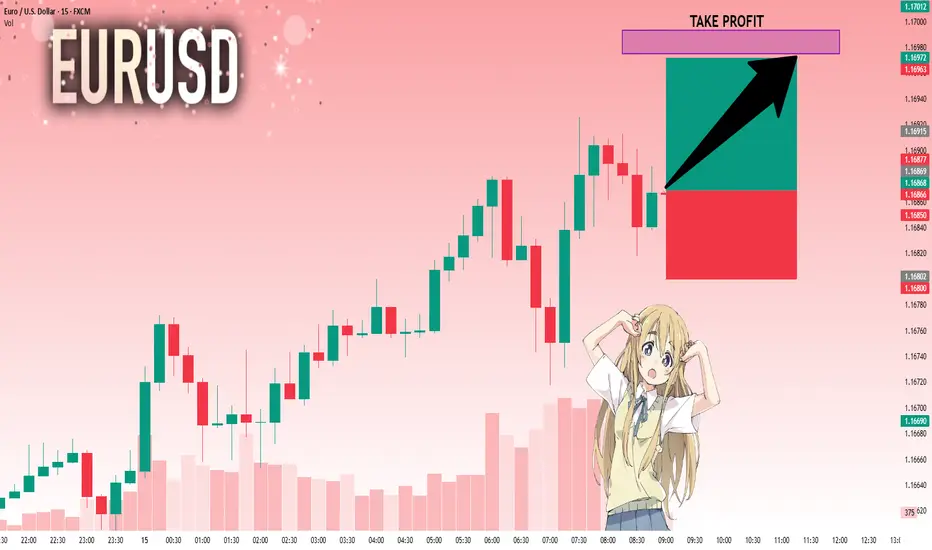
EURUSD: Move Up Expected! Long!
My dear friends,
Today we will analyse EURUSD together☺️
The market is at an inflection zone and price has now reached an area around 1.16869 where previous reversals or breakouts have occurred.And a price reaction that we are seeing on multiple timeframes here could signal the next move up so we can enter on confirmation, and target the next key level of 1.16975.Stop-loss is recommended beyond the inflection zone.
❤️Sending you lots of Love and Hugs❤️
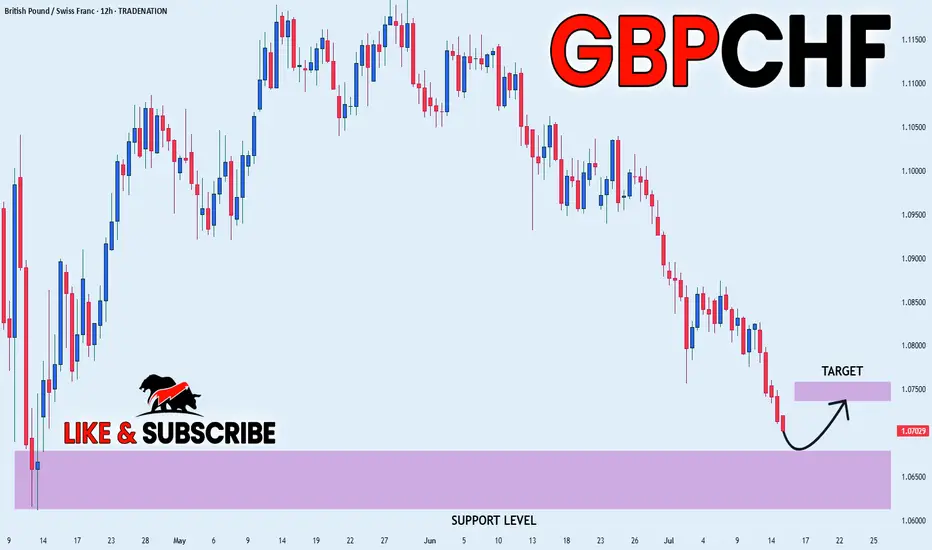
GBP_CHF SWING LONG|
✅GBP_CHF is set to retest a
Strong support level below at 1.0650
After trading in a strong downtrend for some time
Which makes a bullish rebound a likely scenario
With the target being a local resistance above at 1.0750
LONG🚀
✅Like and subscribe to never miss a new idea!✅
Disclosure: I am part of Trade Nation's Influencer program and receive a monthly fee for using their TradingView charts in my analysis.
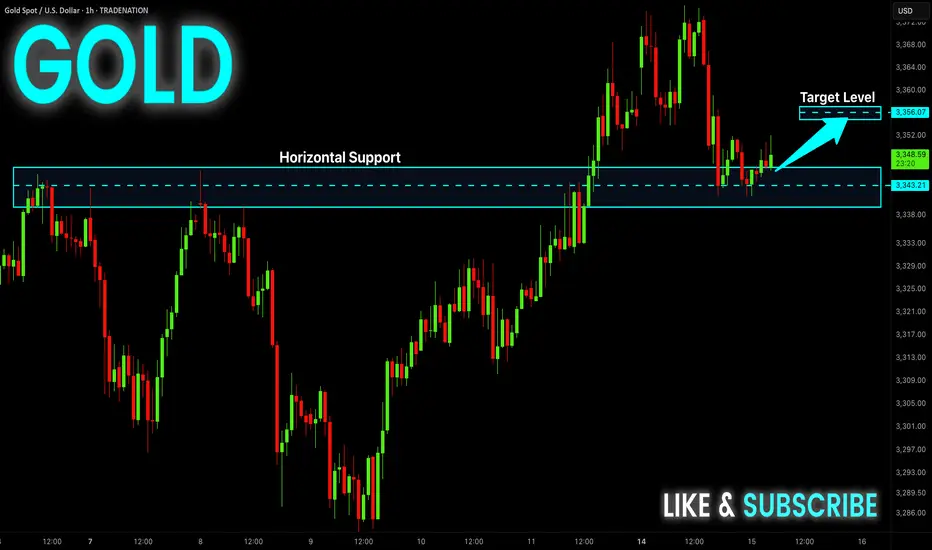
GOLD Local Rebound Ahead! Buy!
Hello,Traders!
GOLD made a retest of
The horizontal support
Level of 3343$ and as
We are locally bullish
Biases we will be expecting
A local bullish rebound
Buy!
Comment and subscribe to help us grow!
Check out other forecasts below too!
Disclosure: I am part of Trade Nation's Influencer program and receive a monthly fee for using their TradingView charts in my analysis.