EURUSD: Next Move Is Down! Short!
My dear friends,
Today we will analyse EURUSD together☺️
The in-trend continuation seems likely as the current long-term trend appears to be strong, and price is holding below a key level of 1.17021 So a bearish continuation seems plausible, targeting the next low. We should enter on confirmation, and place a stop-loss beyond the recent swing level.
❤️Sending you lots of Love and Hugs❤️
SMC

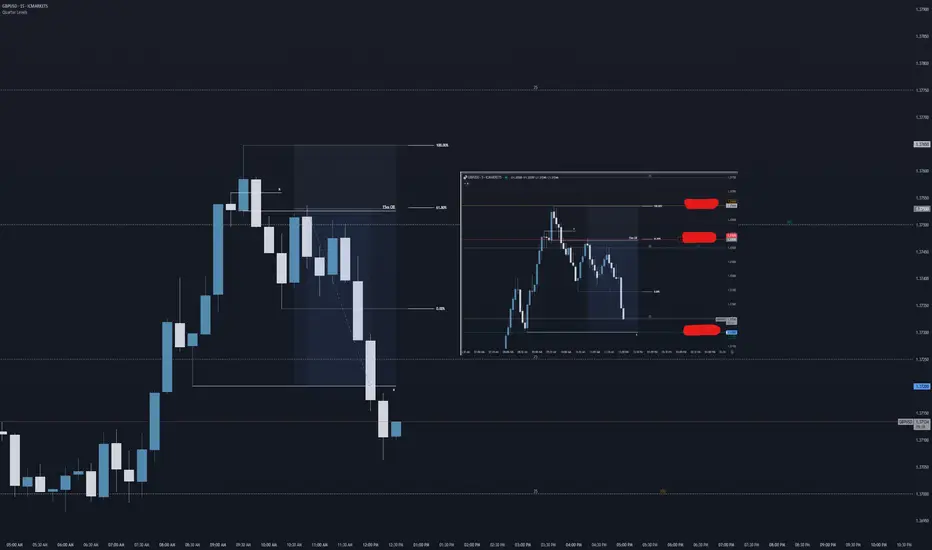
GU Sniper Trade ReviewTook this extremely precise trade this morning on GBP/USD off the 15 minute chart.
We're trading at price highs from 2022, due to all the current fundamentals (which needs to be a topic for another day).
But price showed some really good bearish confluences for a nice session based trade.
Entry was based on the below technical analysis logic:
- 15m order block
- 61.8% FIB retracement (golden ratio)
- 1.375 key price level ( the secret sauce ;) )
I set a conservative TP off a previous 5m structure low and SL was simply set at the current structure high.
This resulted in a 1:3RR trade setup.
Aman | SMC Wolf FX
p.s. i'm currently taking on students who are wanting to learn the way I trade with precision (check out my signature)
GOLD: Target Is Down! Short!
My dear friends,
Today we will analyse GOLD together☺️
The market is at an inflection zone and price has now reached an area around 3,342.22 where previous reversals or breakouts have occurred.And a price reaction that we are seeing on multiple timeframes here could signal the next move down so we can enter on confirmation, and target the next key level of 3,336.36..Stop-loss is recommended beyond the inflection zone.
❤️Sending you lots of Love and Hugs❤️

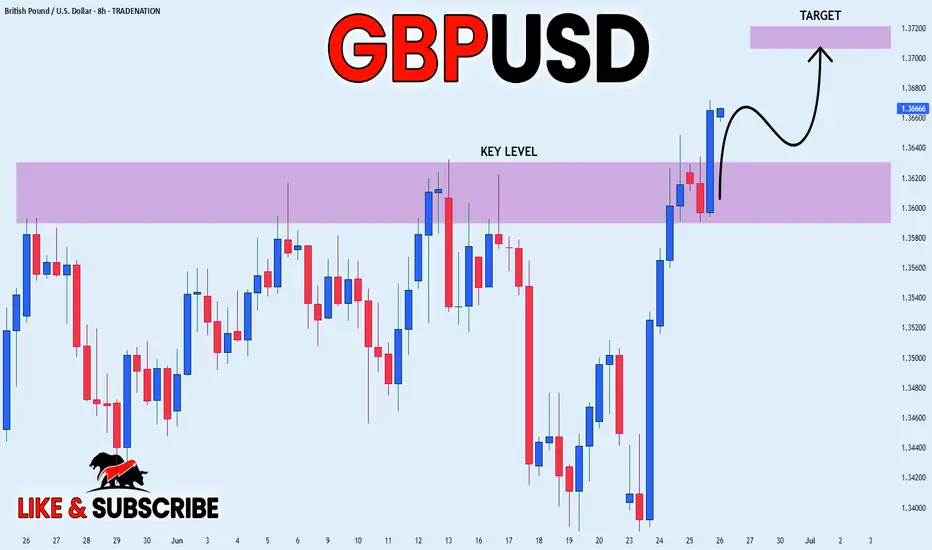
GBP_USD WILL KEEP GROWING|LONG|
✅GBP_USD broke the key structure level of 1.3620
While trading in an local uptrend
Which makes me bullish biased
And I think that after the retest of the broken level is complete
A rebound and bullish continuation will follow
LONG🚀
✅Like and subscribe to never miss a new idea!✅
Disclosure: I am part of Trade Nation's Influencer program and receive a monthly fee for using their TradingView charts in my analysis.
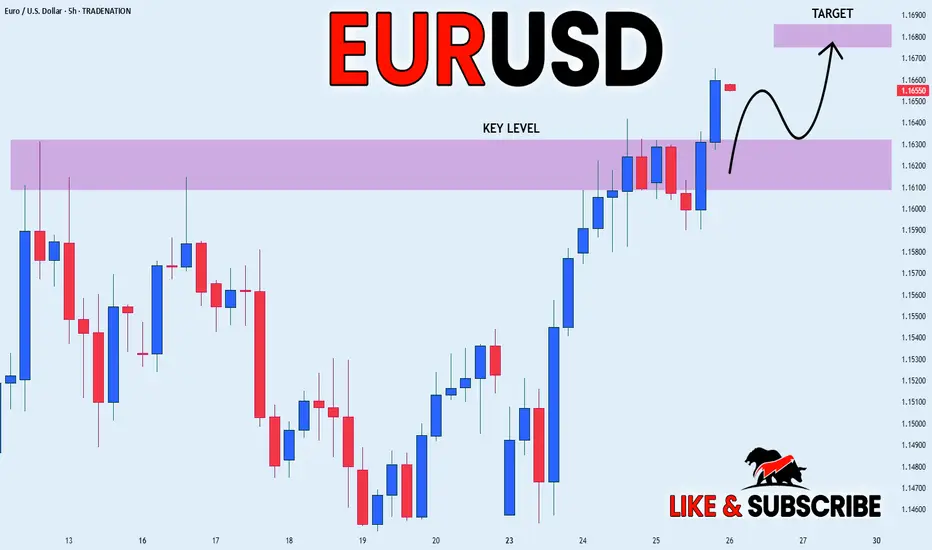
EUR_USD BULLISH BREAKOUT|LONG|
✅EUR_USD is going up
Now and the pair made a bullish
Breakout of the key horizontal
Level of 1.1630 and the breakout
Is confirmed so we are bullish
Biased and we will be expecting
A further bullish move up
LONG🚀
✅Like and subscribe to never miss a new idea!✅
Disclosure: I am part of Trade Nation's Influencer program and receive a monthly fee for using their TradingView charts in my analysis.
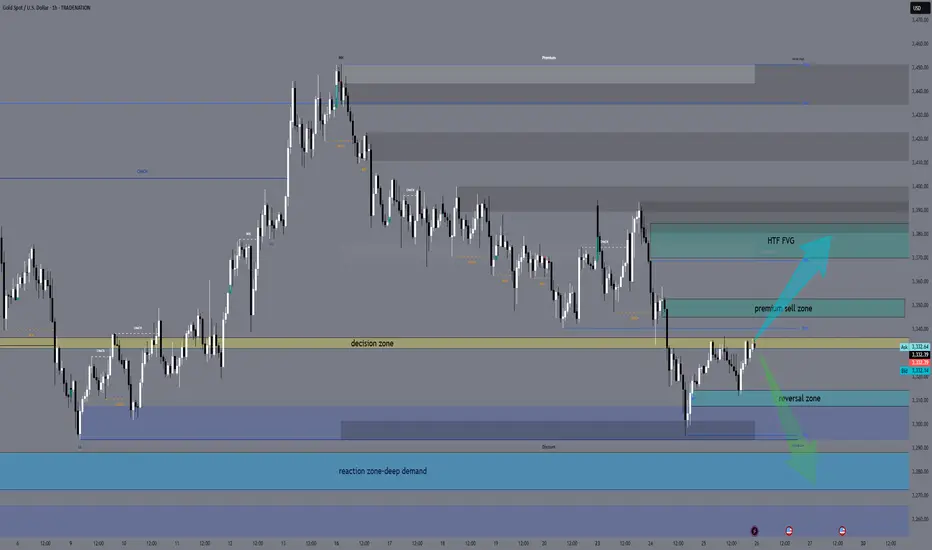
XAUUSD – Sniper Entry Plan June 26, 2025👋 Hello traders,
Gold is currently consolidating after recent downside liquidity sweeps, and Thursday brings high-impact USD catalysts. Let’s break it down and build a precise plan for sniper entries around these volatile zones. We’re trading structure, not noise — eyes on the prize. 🎯
🔸 HTF Outlook (D1 → H4 → H1)
🌐 Macro & Geopolitical Context
Markets are bracing for:
USD Unemployment Claims (Forecast: 244K, previous: 245K)
Final GDP q/q and Durable Goods Orders
Fed speakers (Barkin, Barr, Harker)
Stronger-than-expected data could reinforce USD bullish sentiment, sending gold down. Weaker reports + dovish Fed = bullish pressure on gold.
🗺️ Daily Bias: Neutral to Bullish
Price is ranging above a key CHoCH low + Daily OB (3272–3288)
Strong bullish continuation only confirmed with a break above 3370–3384
FIBO: 50% retracement of the last swing is near 3310, giving structure to Buy Zone 1
Bias: Bullish as long as 3272 holds — PA supports HL structure above imbalance
🕓 H4 Bias: Bearish Pullback
CHoCH at 3384 → clean Lower High + price failed to close above premium FVG
Pullback testing EMA 50/100 + FVG at 3345
FIBO extension zone at 161.8% aligns near 3288 = reactive downside target
Bias: Reactive bearish under 3352. If 3370 breaks cleanly → short invalid.
🕐 H1 Bias: Bullish Short-Term
CHoCH → HL printed at 3310 → higher lows forming toward supply
EMA 21/50 crossed to the upside, RSI mid-range (50–60)
PA structure showing ascending triangle under resistance
Bias: Bullish continuation valid toward 3352–3370, unless breakdown under 3308
🔸 LTF Precision (M30 → M15)
🔹 Sell Zone 1 – 3352–3345
H1 OB + M15 FVG + upper range sweep
RSI expected to peak near 70 → potential divergence
FIBO: 78.6% retracement of previous bearish leg
PA: Watch for M15 liquidity sweep + bearish engulfing
🔸 Entry: Wait for break/retest → confirmation on M5–M15 BOS
🔹 Sell Zone 2 – 3370–3384
HTF premium imbalance zone + weak high above
RSI likely in exhaustion zone
FIBO extension 1.272–1.618 completes inside this supply
PA: Only enter after stop hunt wick + clear CHoCH (M5)
🔸 Entry: Reactive fade after liquidity trap
🔸 Buy Zone 1 – 3308–3313
H1 CHoCH + OB + EQ zone
RSI bounce zone (30–40)
FIBO 50–61.8% retracement of bullish swing
PA: Watch for M15 bullish engulfing or double bottom formation
🔸 Entry: Only on structure break + retest confirmation
🔸 Buy Zone 2 – 3288–3272
Daily OB + HTF FVG + massive imbalance
RSI expected to overshoot under 30
FIBO: 1.618 extension from previous M15 bullish leg
PA: High-RR reversal zone if flushed by NY open
🔸 Entry: Enter only after M5 CHoCH or strong engulfing near the OB
⚖️ Decision Zone – 3333–3336
Previous supply turned EQ zone
PA shows indecision — do not enter here
Useful for monitoring if price holds support or rejects
🔸 Trade Scenarios
🟢 Bullish Scenario
If USD data is weak:
Flush to 3308 or 3288
Confirm HL formation → sniper buy from OB → aim 3345+, possibly 3370 sweep
🔴 Bearish Scenario
If USD prints strong:
Price spikes into 3352 or 3370 zones → rejection + BOS
Sniper short entry → targets 3310 → 3288
🔸 Final Plan & Action Points
✅ Patience is key during news. Let structure confirm.
✅ Track price behavior near 14:30 CEST, avoid instant spikes.
✅ Best sniper RR zones:
🔹 Sell from 3352 or 3370
🔸 Buy from 3308 or 3288
📊 Precision matters. Structure wins.
👍 Like this if it helped you map the move, and 🔔 follow for tomorrow’s sniper entry.
— GoldFxMinds
Disclosure: I am part of TradeNation's Influencer program and receive a monthly fee for using their TradingView charts in my analyses and educational articles.
AUD-NZD Long From Rising Support! Buy!
Hello,Traders!
AUD-NZD went down but
Will soon retest a rising
Support line from where
We will be expecting a
Bullish rebound and a move up
Buy!
Comment and subscribe to help us grow!
Check out other forecasts below too!
Disclosure: I am part of Trade Nation's Influencer program and receive a monthly fee for using their TradingView charts in my analysis.

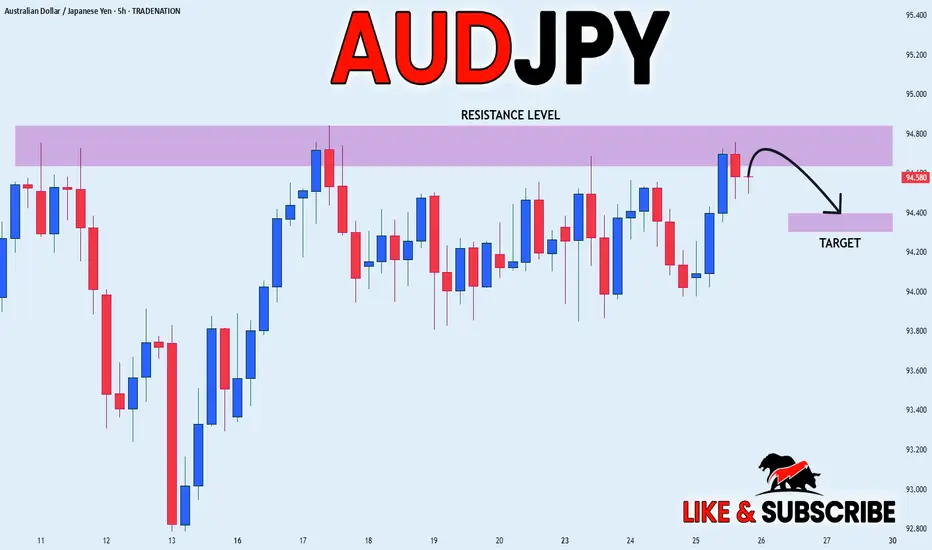
AUD_JPY LOCAL SHORT|
✅AUD_JPY made a retest of the
Strong horizontal resistance level of 94.800
And as you can see the pair is already
Making a local pullback from
The level which sends a clear
Bearish signal to us therefore
We will be expecting a
Further bearish correction
SHORT🔥
✅Like and subscribe to never miss a new idea!✅
Disclosure: I am part of Trade Nation's Influencer program and receive a monthly fee for using their TradingView charts in my analysis.
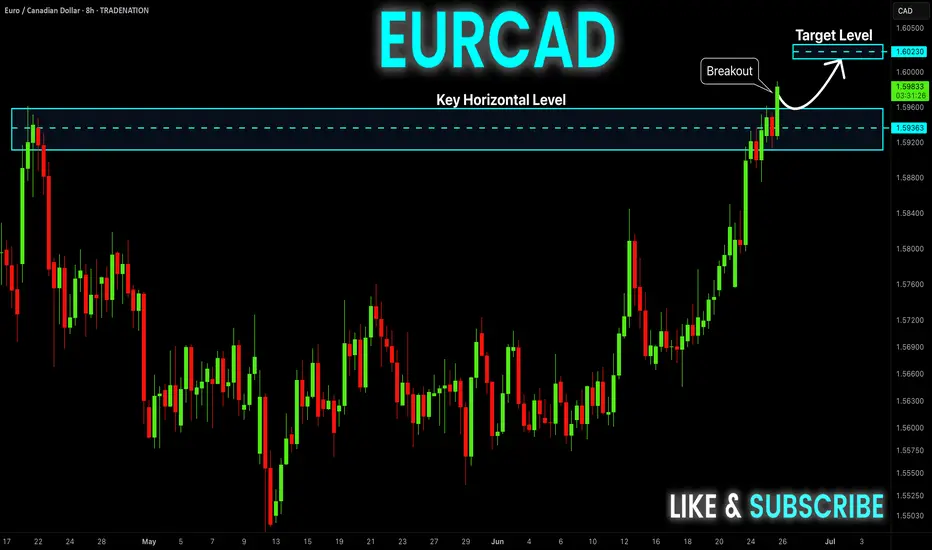
EUR-CAD Bullish Breakout! Buy!
Hello,Traders!
EUR-CAD is trading in an
Uptrend and the pair made
A bullish breakout of the key
Horizontal level of 1.5936 so we
Are bullish biased and we
Will be expecting a further
Bullish move up
Buy!
Comment and subscribe to help us grow!
Check out other forecasts below too!
Disclosure: I am part of Trade Nation's Influencer program and receive a monthly fee for using their TradingView charts in my analysis.
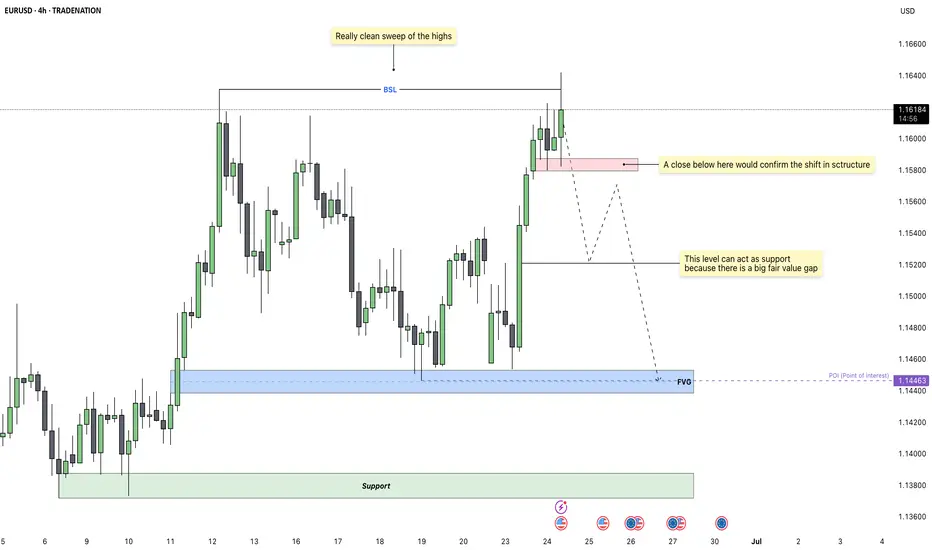
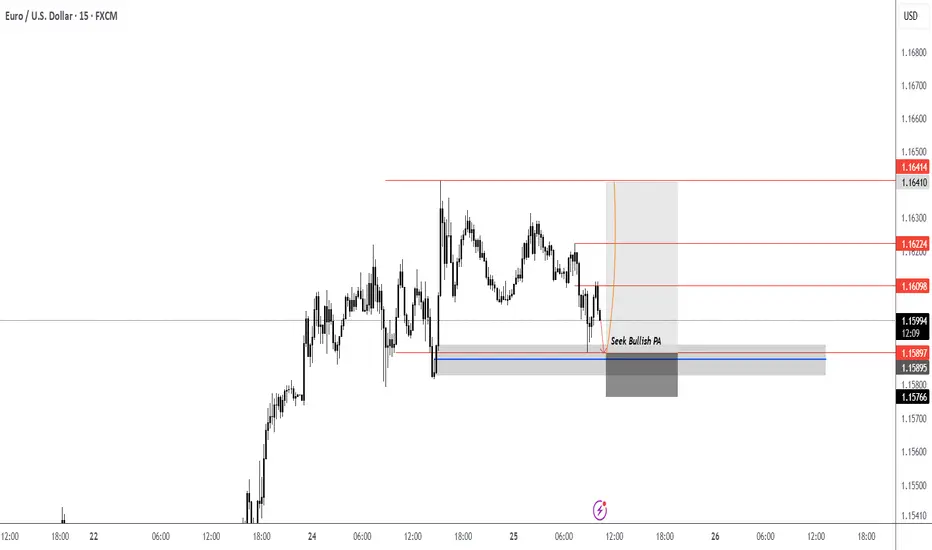
EURUSD - Bears Preparing a Bearish Shift in StructureEURUSD has been pushing higher over the past few sessions, reaching into a key liquidity zone. On the 4H chart, we’ve now seen a very clean sweep of previous swing highs, which completes the first step needed for a potential reversal. This sweep acted as a buy-side liquidity run, taking out resting orders before showing early signs of exhaustion.
Liquidity Sweep and Structural Confirmation
The sweep of the highs marked a potential turning point, but for this setup to gain validity, we need to see confirmation through structure. That confirmation would come from a decisive 4H close below the red mitigation zone. This area aligns with a small demand that previously pushed price up, so a close below would mark a clean break in bullish order flow and confirm a bearish structure shift.
Downside Expectations and Key Levels
If the structure shift is confirmed, I expect EURUSD to move lower toward the fair value gap around 1.14600 to 1.14400. This FVG could provide temporary support, and we may see some reaction there. However, due to the size of the imbalance and the overall context, price has the potential to continue lower through that level.
Interim Reactions and Minor Scenarios
There is a chance price reacts to the FVG and pulls back before continuing lower. Any bounce from this zone would likely be short-term unless it leads to a clear market structure shift back to the upside. If price fails to hold above the FVG, the deeper support zone below near 1.13800 would become the next logical target.
Trigger Point for Bearish Bias
The most important trigger for this trade is a 4H close below the red box. Without that, the bullish structure technically remains intact. Once that level is broken, I will consider the sweep and break combination a completed reversal signal, targeting the FVG and beyond.
Conclusion
This setup follows a textbook liquidity grab followed by a potential structure break. Patience is key here, as I’m waiting for confirmation before taking action. If price closes below the red zone, I’ll be actively looking for shorts targeting the 1.14600 region, with room to extend lower depending on how price reacts at the FVG.
Disclosure: I am part of Trade Nation's Influencer program and receive a monthly fee for using their TradingView charts in my analysis.
___________________________________
Thanks for your support!
If you found this idea helpful or learned something new, drop a like 👍 and leave a comment, I’d love to hear your thoughts! 🚀
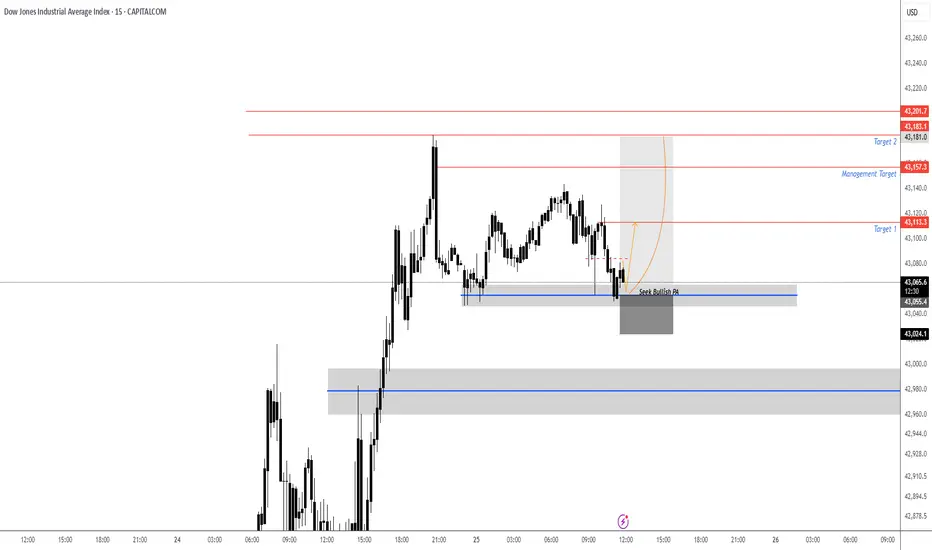
US30 - Entries ActiveAs anticipated got the sweep below then break above our area with a U shape formation. Looking to the upside.
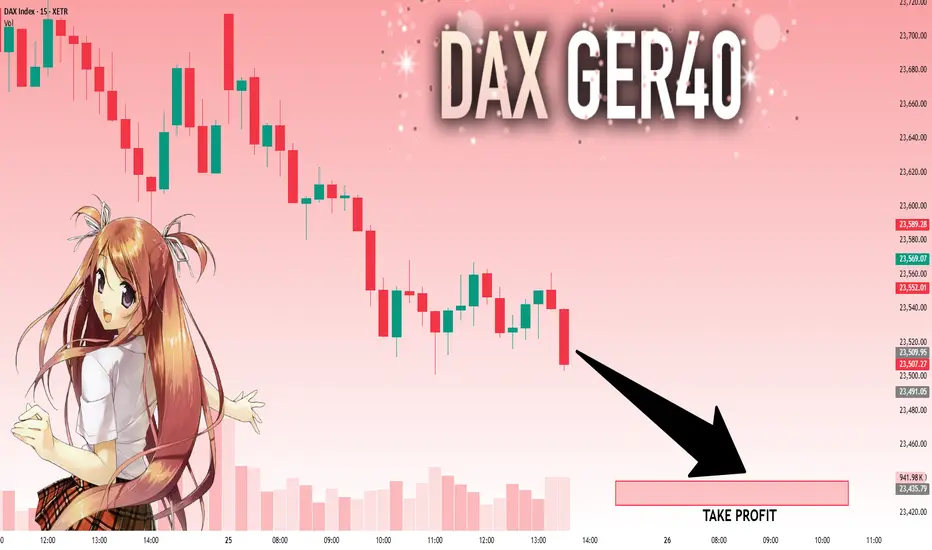
DAX: Move Down Expected! Short!
My dear friends,
Today we will analyse DAX together☺️
The price is near a wide key level
and the pair is approaching a significant decision level of 23,509.95 Therefore, a strong bearish reaction here could determine the next move down.We will watch for a confirmation candle, and then target the next key level of 23,438.51..Recommend Stop-loss is beyond the current level.
❤️Sending you lots of Love and Hugs❤️
GOLD: Local Bullish Bias! Long!
My dear friends,
Today we will analyse GOLD together☺️
The recent price action suggests a shift in mid-term momentum. A break above the current local range around 3,314.13 will confirm the new direction upwards with the target being the next key level of 3,322.84 and a reconvened placement of a stop-loss beyond the range.
❤️Sending you lots of Love and Hugs❤️

EURUSD: Strong Growth Ahead! Long!
My dear friends,
Today we will analyse EURUSD together☺️
The in-trend continuation seems likely as the current long-term trend appears to be strong, and price is holding above a key level of 1.16017 So a bullish continuation seems plausible, targeting the next high. We should enter on confirmation, and place a stop-loss beyond the recent swing level.
❤️Sending you lots of Love and Hugs❤️

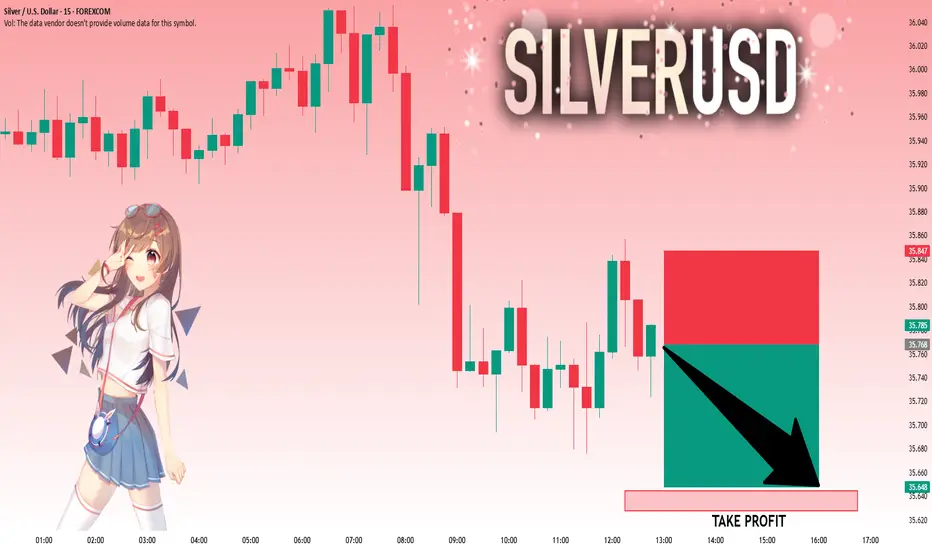
SILVER: Will Go Down! Short!
My dear friends,
Today we will analyse SILVER together☺️
The market is at an inflection zone and price has now reached an area around 35.768 where previous reversals or breakouts have occurred.And a price reaction that we are seeing on multiple timeframes here could signal the next move down so we can enter on confirmation, and target the next key level of 35.645..Stop-loss is recommended beyond the inflection zone.
❤️Sending you lots of Love and Hugs❤️
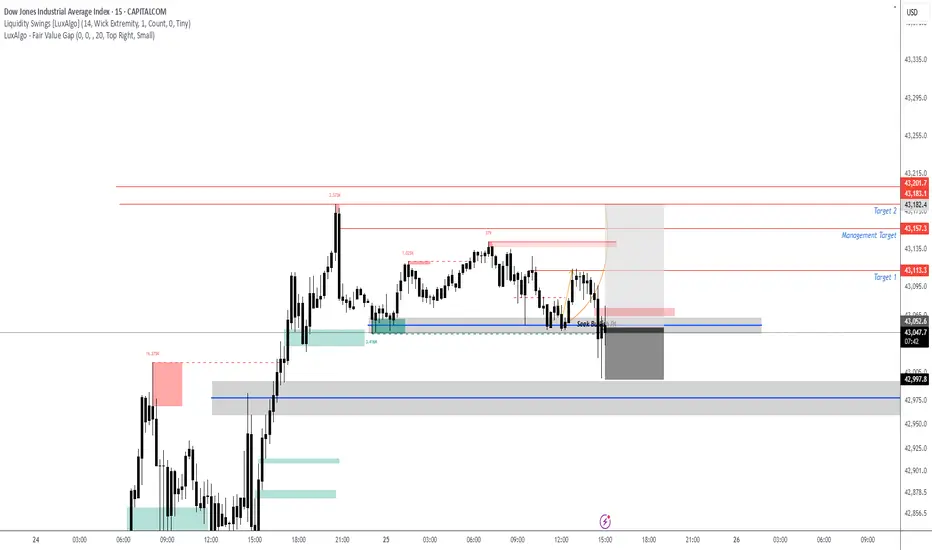
US30 - Final Push before PullbackPotentially another push to upper levels of supply potentially 43,150-43,200. Can see this retest before seeing a potential pull back based off larger time frame.
EURUSD - Looking to the upside retest of SupplyLooking to the upside, first lets get that push to lower level of liquidity swing then a push to the upside. Only on bullish confirmation at our highlighted level. I think we have one more retest before catching a potential short (pullback) on the larger time frame. Long term target for EURUSD is 1.200.
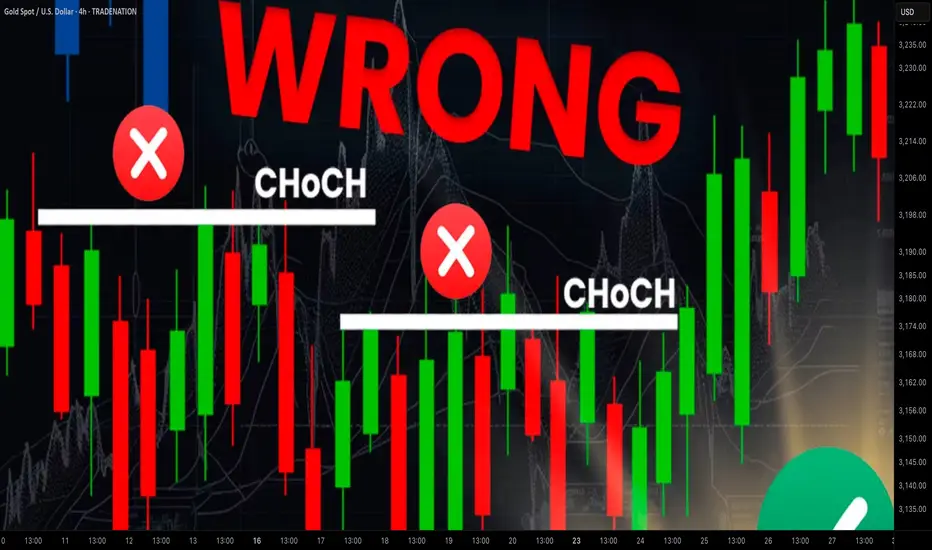
Learn Best Change of Character CHoCH Model in Trading with SMC
Most of the SMC traders get Change of Character CHoCH WRONG!
In this article, I will share with you Change of Character models that have a low accuracy and better to be avoided.
I will teach you the best CHoCH model for Forex Gold trading and show you how to identify it easily.
Let's start with the basic theory first and discuss what Change of Character signifies.
Change of Character in Bearish Trend
In a downtrend, Change of Character CHoCH is an important event that signifies a violation of a bearish trend.
CHoCH is confirmed when the price breaks and closes above the level of the last lower high.
Above, is a text book Change of Character model in a bearish trend.
For the newbie traders, such a price action provides a strong signal to buy while it fact it is NOT .
One crucial thing is missing in this model to confirm a bullish reversal.
According to basic trend analysis rules, we say that the market trend is bullish if the price forms a bullish impulse, retraces and sets a Higher Low HH , forms a new bullish impulse with a new Higher High HH.
Only then, we can say that the market is trading in up trend.
CHoCH model above confirms a bearish trend violation BUT it does not confirm a trend change.
Such a model may easily signify a deeper correction.
Look what happened with GBPNZD.
Though the price formed a confirmed bearish CHoCH, it was a false signal and just an extended correction.
That's a perfect bullish reversal model.
It combines CHoCH and conditions for a bullish trend.
Such a union is extremely accurate in predicting up movements.
Examine a price action on USDJPY.
Not only the price formed a confirmed CHoCH but also we see a start of a new bullish trend.
Change of Character in Bullish Trend
In an uptrend, Change of Character CHoCH is a significant event that signifies a violation of a bullish trend.
CHoCH is confirmed when the price breaks and closes below the level of the last higher low.
Above is a typical model of a bearish CHoCH.
For many traders, that is the signal to open short.
However, it is not that accurate and one important component is missing there.
According to basic price action rules, the market trend is bearish
if the price forms at least 2 bearish impulses with Lower Lows LL and a pullback between them with a Lower High LH.
Only when these 3 conditions are met, a bearish trend is confirmed .
Perfect bearish Change of Character model should include both CHoCH and a bearish trend price action. That will confirm a violation of a bullish trend and start of a new bearish trend.
EURCAD has a very strong potential to continue falling:
not only we see a valid bearish Change of Character but also
a start of a new bearish trend based on a price action.
Next time when you identify CHoCH on forex market, make sure that you check the preceding price action. It will help you to more accurate assess reversal probabilities and make a wiser trading decision.
❤️Please, support my work with like, thank you!❤️
I am part of Trade Nation's Influencer program and receive a monthly fee for using their TradingView charts in my analysis.
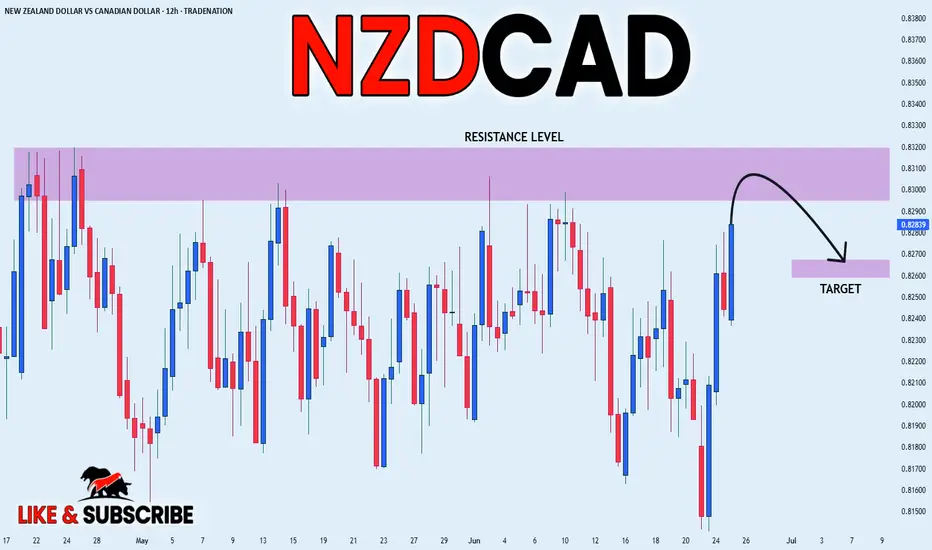
NZD_CAD SHORT FROM RESISTANCE|
✅NZD_CAD will soon retest a key resistance level of 0.8320
So I think that the pair will make a pullback
And go down to retest the demand level below at 0.8267
SHORT🔥
✅Like and subscribe to never miss a new idea!✅
Disclosure: I am part of Trade Nation's Influencer program and receive a monthly fee for using their TradingView charts in my analysis.
GOLD Risky Short! Sell!
Hello,Traders!
GOLD made a bullish
Rebound but will soon
Hit a wide horizontal
Resistance of around 3,345$
And as we are locally bearish
Biased after the recent rising
Support breakout we will be
Expecting a bearish pullback
And a local move down
Sell!
Comment and subscribe to help us grow!
Check out other forecasts below too!
Disclosure: I am part of Trade Nation's Influencer program and receive a monthly fee for using their TradingView charts in my analysis.

XAUUSD Bullish OutlookThis chart captures a highly strategic bullish setup on XAUUSD, rooted in Smart Money Concepts (SMC) and institutional trading principles. The market has performed a major liquidity sweep, dipping below previous lows to collect resting sell-side liquidity before reacting sharply from a key demand zone.
Why Bullish? The Confluences:
Liquidity Sweep:
Price manipulated below a significant structural low to trap late sellers and activate institutional orders. This move into deeper liquidity suggests the smart money is building long positions.
Extreme P.O.I. + Demand Zone:
The blue zone marks a high probability reversal area where demand outweighs supply. This zone is validated by historical reactions and refined to align with an Order Block (OB) a clear footprint of institutional accumulation.
Bullish Structure Anticipation:
After the reaction, price is expected to form a series of higher highs and higher lows, confirming bullish market structure. Multiple resistance levels are in sight, each one representing an objective for price to reach in its journey upward.
Entry Point: $3,343 – $3,330
Located inside the OB and demand zone, this is where price is likely to build a base for upward continuation.
Stop Loss: Below $3,324
TP1: $3,363 (first internal structure break)
TP2: $3,375 (mid range target)
TP3: $3,383 (structural high retest)
TP Final: $3,405 (liquidity target above EQH)
Remember confirmation is key before execution.
#GOLD 2H Technical Analysis Expected Move.

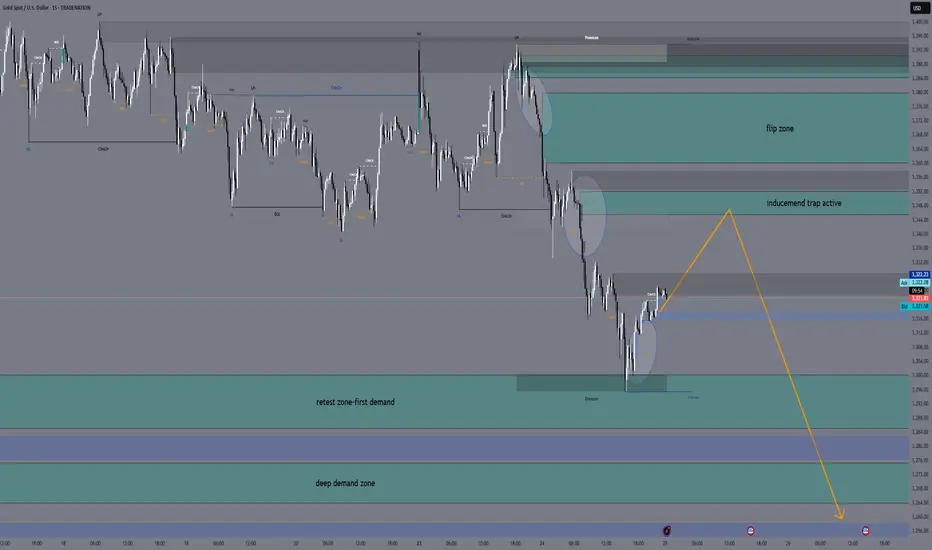
XAUUSD Daily Sniper Plan – June 25, 2025👋👋 Hello traders!
Gold is still moving down strongly. Today’s plan is made for traders who want clear and precise levels. Let’s look at the structure, important zones, and where to watch for trades.
1. Higher Timeframe Overview (Daily, H4, H1)
Daily: Price is falling near the 200 EMA around 3323. RSI shows less buying strength. We wait for a clear move.
H4: The trend is down with lower highs at 3418 and lower lows at 3311. RSI is low, showing weak buying. Price is near the 200 EMA.
H1: Small bounce up to 3328–3332 resistance. RSI is weak, so price must break this zone to move higher.
2. Lower Timeframe Details (M30, M15)
M30: EMA5 crossed above EMA21 but price is near resistance at 3328–3332. RSI is neutral.
M15: Price broke a small wedge up but is limited by EMA21 and EMA50. RSI near 58 shows price could be overbought.
3. Key Zones and How to Trade Them
🔻 Sell Zone: 3345 – 3352
Look for signs that price rejects this zone (wicks, bearish candles) before selling.
🟡 Flip / Decision Zone: 3360 – 3380
Do not trade here. This zone will show if trend changes. Wait for clear confirmation.
🟢 Buy Zone: 3300 – 3285
Look for price rejection and strong buying signs before buying here.
🟢 Deep Buy Zone: 3265 – 3272
Only buy here if price goes below 3280 and shows strength.
4. What to Do
Current price is about 3323.
If price goes above 3332, watch the sell zone 3345–3352 for a short trade.
If price drops below 3332, expect a move down to the buy zone 3300–3285.
Do not buy above 3360 without a clear trend change.
Be patient and wait for good signals.
5. Important Levels
Zone Price Range Notes
Sell Zone 3345 – 3352 Best short zone
Flip Zone 3360 – 3380 Wait and watch, no trades
Buy Zone 3300 – 3285 Good buy zone
Deep Buy Zone 3265 – 3272 Last buy chance
📣 If you like clear and simple plans, please like, comment, and follow
I’m part of Trade Nation’s Influencer Program and get paid to use their charts.
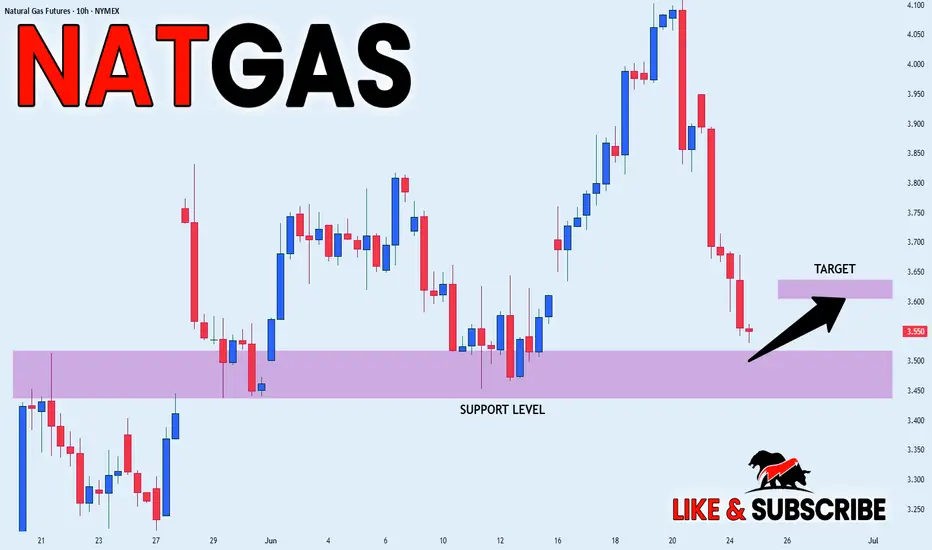
NATGAS SUPPORT AHEAD|LONG|
✅NATGAS is going down now
But a strong support level is ahead at 3.450$
Thus I am expecting a rebound
And a move up towards the target of 3.600$
LONG🚀
✅Like and subscribe to never miss a new idea!✅
Disclosure: I am part of Trade Nation's Influencer program and receive a monthly fee for using their TradingView charts in my analysis.