EURUSD Long As the war escalated over the weekend market gapped during Asia session invalidating our initial forecast. (Linked Idea). Looking for the long on EURUSD.
SMC

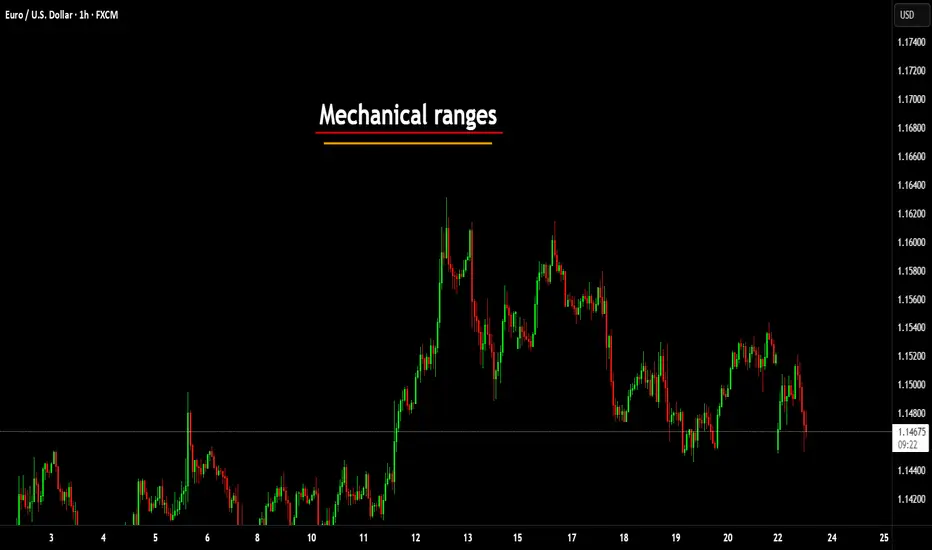
Mechanical rangesMany traders will talk about things like "Smart Money Concepts" (SMC) and think they have found something new.
The truth is, everything in trading stems back to Liquidity.
There is no "Algo" nobody is out to get you specifically. The market is always right, where you position yourself is your own choice.
I have written several posts on mechanical trading, recorded a number of streams. The more mechanical you can make the process, the less the emotions have a chance to kick your ass.
Let me give you a very simple method of being able to identify the ranges. Ignore the timeframes as this will work on any of them, on most instruments. (I say most, as some behave differently due to how it attracts liquidity). Lets assume high end crypto such as Bitcoin (BTC) and of course Forex in the general sense, stocks, commodities etc.
This is simple - only 2 rules.
You start by zooming out and giving yourself a general feel for the trend.
Let's say this looks to be an uptrend - we now need to understand the rules.
An opposing candle can simply be defined by a different colour. If the trend is up (Green) and we see a red candle - then it's an opposing candle.
The inverse is true, if we are down and the trend is Red. Then a Green candle would be opposing.
This is only half of the story. The second rule is a pullback candle or even a sequence of candles. This simply means either the very same opposing candle that doesn't make a new high or low (depending on the trend up not making fresh highs or down not taking new lows).
In this image, you can see we have in one candle both an opposing and pullback in one candle. This means we can now mark the high of the range. Working backwards to identify the swing range low.
This easy method means I can draw a range exactly the same and mechanically every single time.
Giving me a mechanical range.
We could then get a lot more technical by looking for liquidity, 50% of the range or places such as supply or demand areas.
But these are all for other posts.
For now, getting a range on the higher timeframes means you can work down and down into a timeframe you are likely to want to trade on.
These ranges will give clues to draws and runs of liquidity.
This will also help identify changes in the character and fresh breaks of structure.
Here's another post I posted on the mechanical structures and techniques.
More in the next post.
Have a great week!
Disclaimer
This idea does not constitute as financial advice. It is for educational purposes only, our principal trader has over 25 years' experience in stocks, ETF's, and Forex. Hence each trade setup might have different hold times, entry or exit conditions, and will vary from the post/idea shared here. You can use the information from this post to make your own trading plan for the instrument discussed. Trading carries a risk; a high percentage of retail traders lose money. Please keep this in mind when entering any trade. Stay safe.
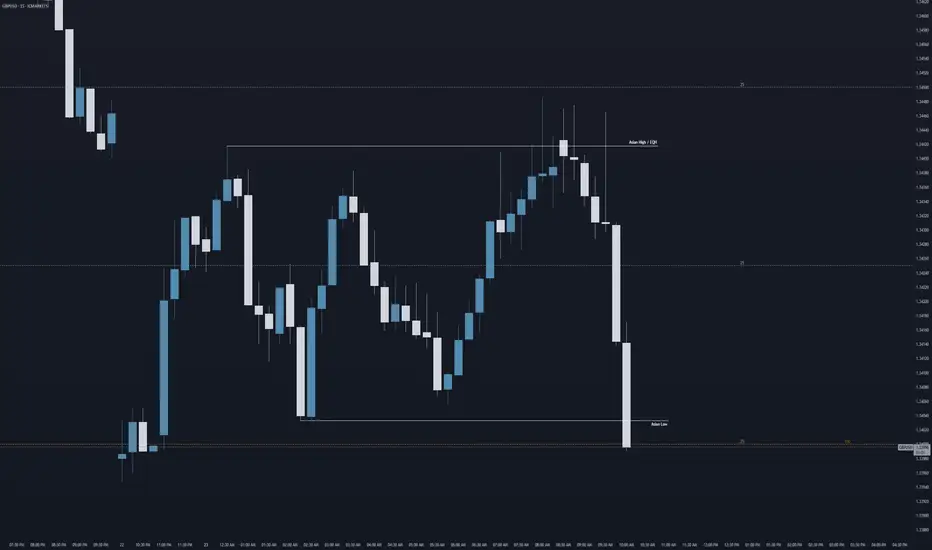
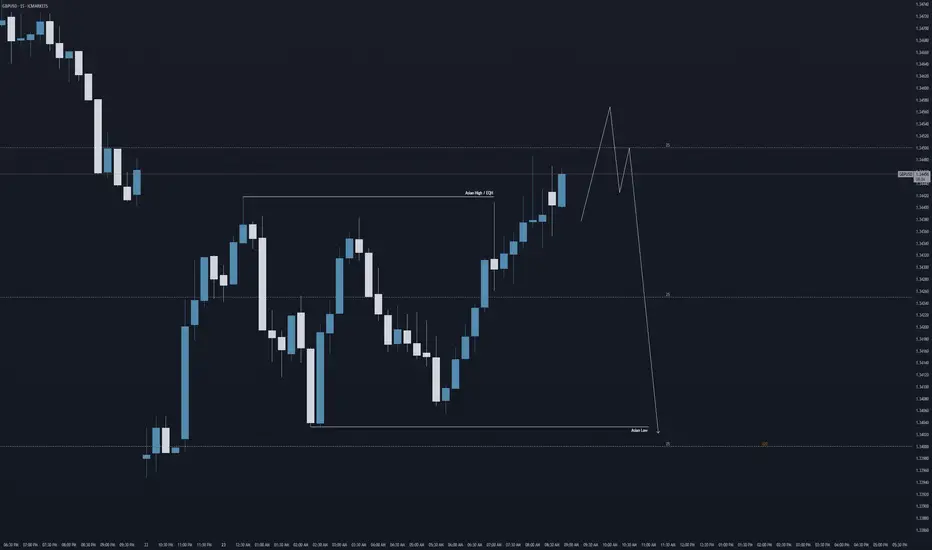
GU = Asian Highs > Asian LowsAs per my morning forecast on GU shared this morning. Price action did exactly that. Sweeped the Asian highs and plummeted towards the Asian lows at around 1.34.
- Aman
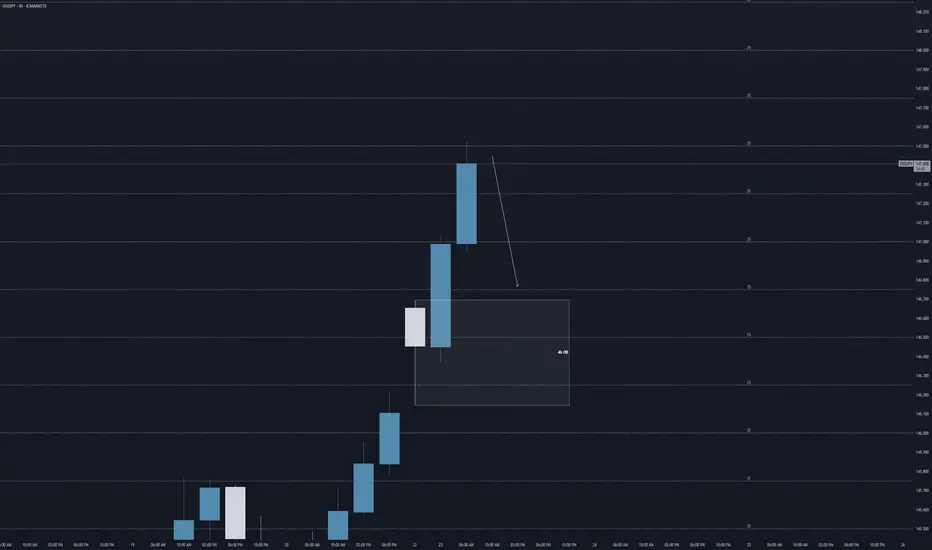
UJ: Could we see a bearish leg looking at the 4h?USD/JPY is currently trading at a key price level of 147.5. We've got a 4h order block about 75 pips to the downside at 146.75.
If we see some lower time frame confirmations, we could potentially see a bearish leg towards this 4h OB today.
- Aman
GU: Trading back towards 1.34 today?Hi everyone, hope you've all had a nice weekend.
Looking at GBP/USD this morning, keeping the forecast and analysis simple, but looking at a further bearish run today if we get the right lower time frame price action to confirm...
Looking at a sweep into 1.345 before trading lower, potentially towards 1.34.
Aman
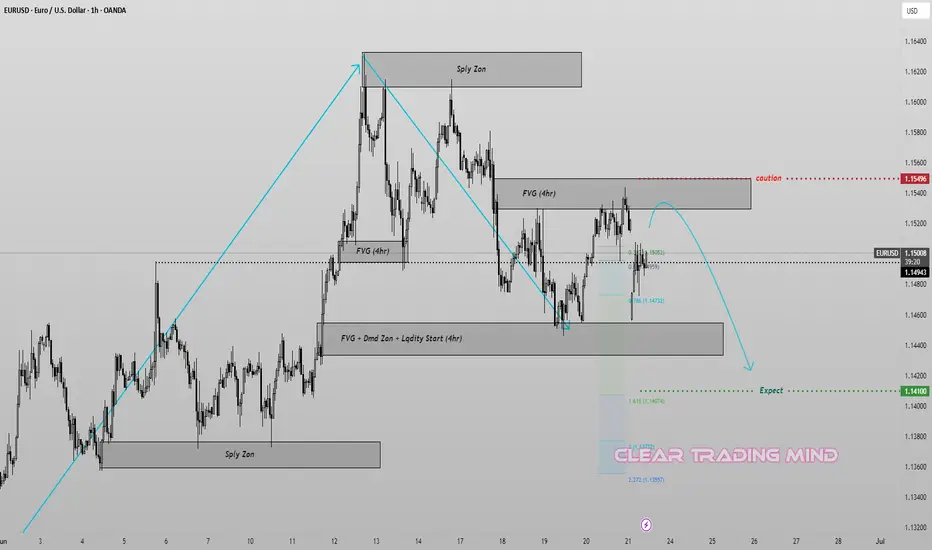
Supply Trap Revisit Before Final Drop? | Smart Money Outlook
📉 Price has recently reacted from a strong FVG + Demand + Liquidity Start Zone (4hr) around 1.1450, confirming bullish intent temporarily.
📈 However, a corrective move is now heading into a 4hr Fair Value Gap (FVG) zone near 1.1520–1.1550, which aligns with a potential lower high setup.
Key Zones:
Supply Zone @ 1.1550 (Caution): Watch for rejection signs here—high confluence with previous imbalance.
Bearish Expectation: After liquidity grab or mitigation in FVG, expect a strong sell-off targeting the 1.1410 level (measured move and 1.618 fib extension).
⚠️ Be cautious of price pushing slightly above 1.1550 to sweep liquidity before reversing.
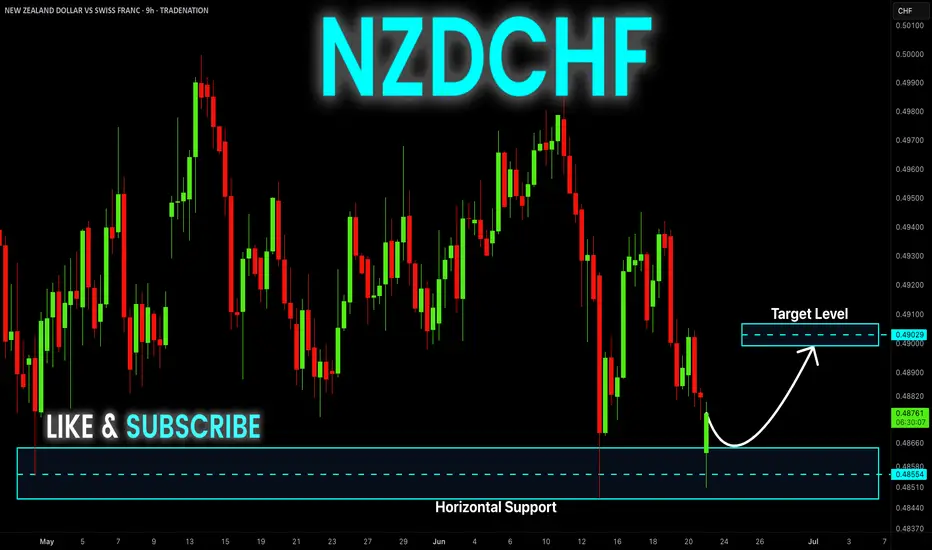
NZD-CHF Rebound Ahead! Buy!
Hello,Traders!
NZD-CHF made a retest
Of the horizontal support
Level of 0.4847 from where
We are already seeing a
Bullish rebound so we are
Locally bullish biased and
We will be expecting a
Further bullish move up
Buy!
Comment and subscribe to help us grow!
Check out other forecasts below too!
Disclosure: I am part of Trade Nation's Influencer program and receive a monthly fee for using their TradingView charts in my analysis.
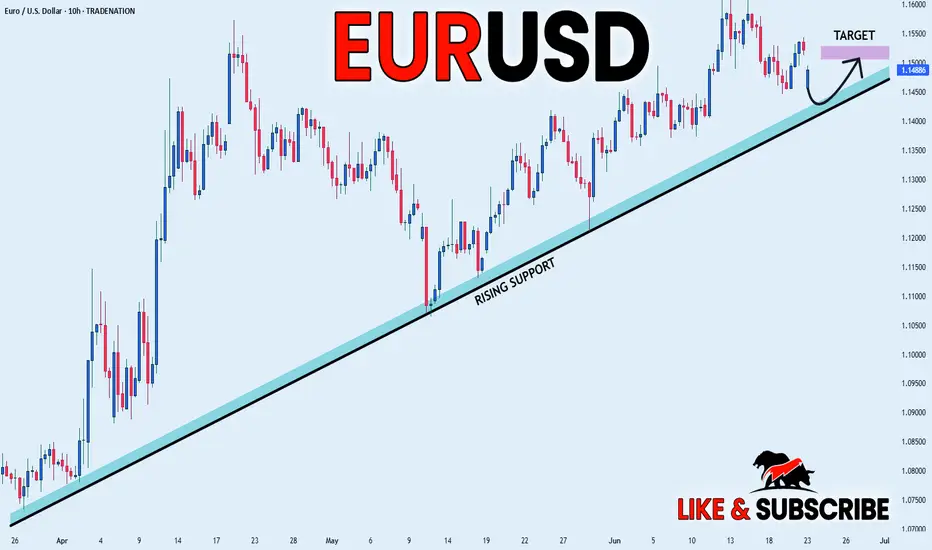
EUR_USD RISING SUPPORT AHEAD|LONG|
✅EUR_USD is trading along the rising support
And as the pair will soon retest it
I am expecting the price to go up
To retest the supply levels above at 1.1511
LONG🚀
✅Like and subscribe to never miss a new idea!✅
Disclosure: I am part of Trade Nation's Influencer program and receive a monthly fee for using their TradingView charts in my analysis.
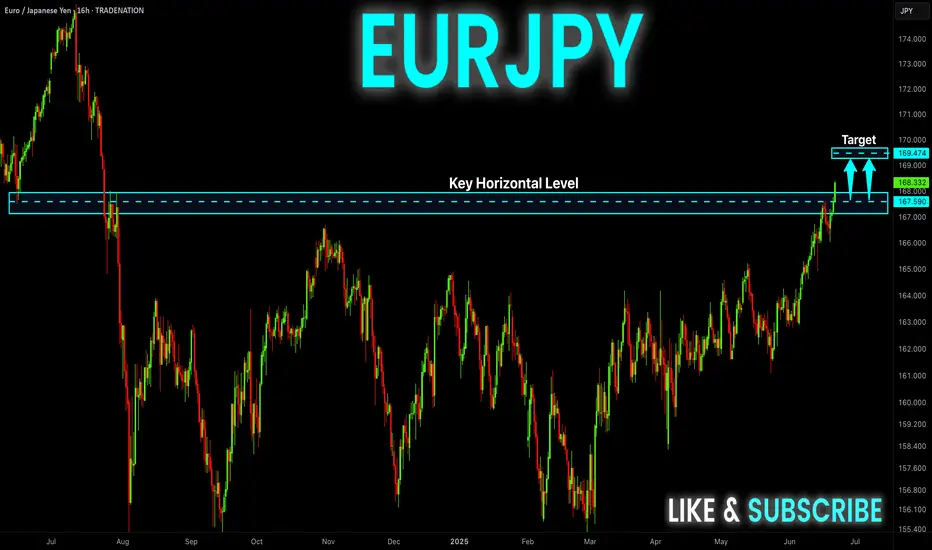
EUR-JPY Bullish Breakout! Buy!
Hello,Traders!
EUR-JPY is trading in an
Uptrend and the pair made
A strong bullish breakout
Of the key horizontal level
Of 168.000 and the breakout
Is confirmed so we will be
Expecting a further bullish
Move up on Monday
Buy!
Comment and subscribe to help us grow!
Check out other forecasts below too!
Disclosure: I am part of Trade Nation's Influencer program and receive a monthly fee for using their TradingView charts in my analysis.
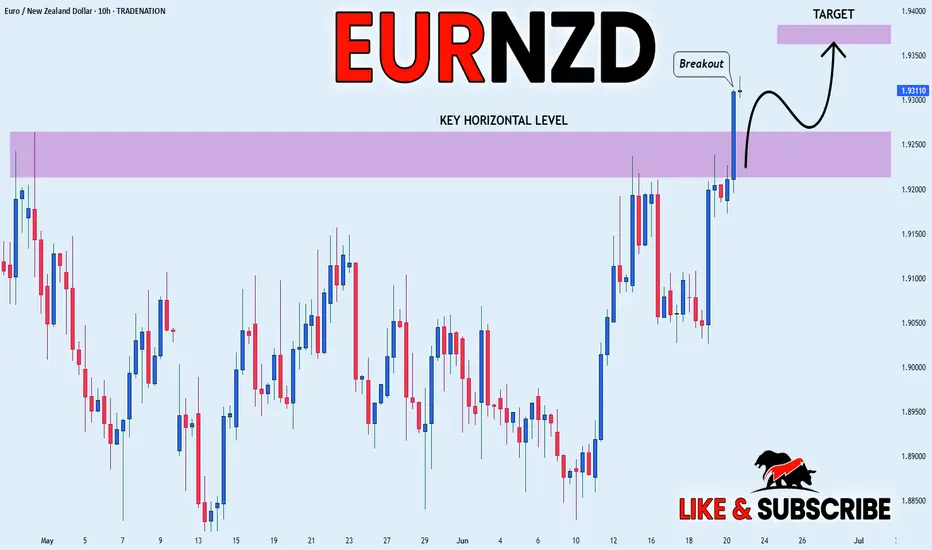
EUR_NZD WILL KEEP GROWING|LONG|
✅EUR_NZD is going up
Now and the pair made a bullish
Breakout of the key horizontal
Level of 1.9250 and the breakout
Is confirmed so we are bullish
Biased and we will be expecting
A further bullish move up on Monday
LONG🚀
✅Like and subscribe to never miss a new idea!✅
Disclosure: I am part of Trade Nation's Influencer program and receive a monthly fee for using their TradingView charts in my analysis.
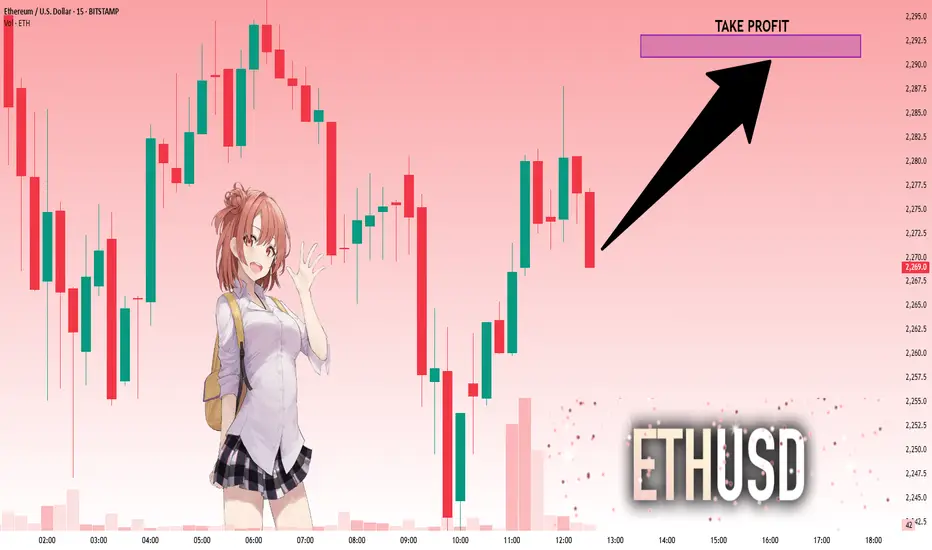
ETHUSD: Will Go Up! Long!
My dear friends,
Today we will analyse ETHUSD together☺️
The price is near a wide key level
and the pair is approaching a significant decision level of 2,270.9 Therefore, a strong bullish reaction here could determine the next move up.We will watch for a confirmation candle, and then target the next key level of 2,290.8.Recommend Stop-loss is beyond the current level.
❤️Sending you lots of Love and Hugs❤️
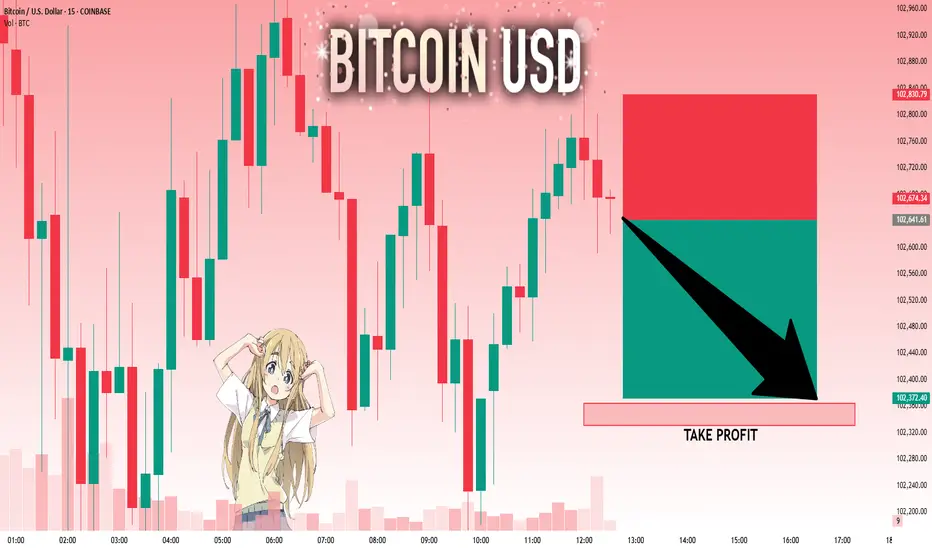
BTCUSD: The Market Is Looking Down! Short!
My dear friends,
Today we will analyse BTCUSD together☺️
The recent price action suggests a shift in mid-term momentum. A break below the current local range around 102,641.61 will confirm the new direction downwards with the target being the next key level of 102,364.09.and a reconvened placement of a stop-loss beyond the range.
❤️Sending you lots of Love and Hugs❤️
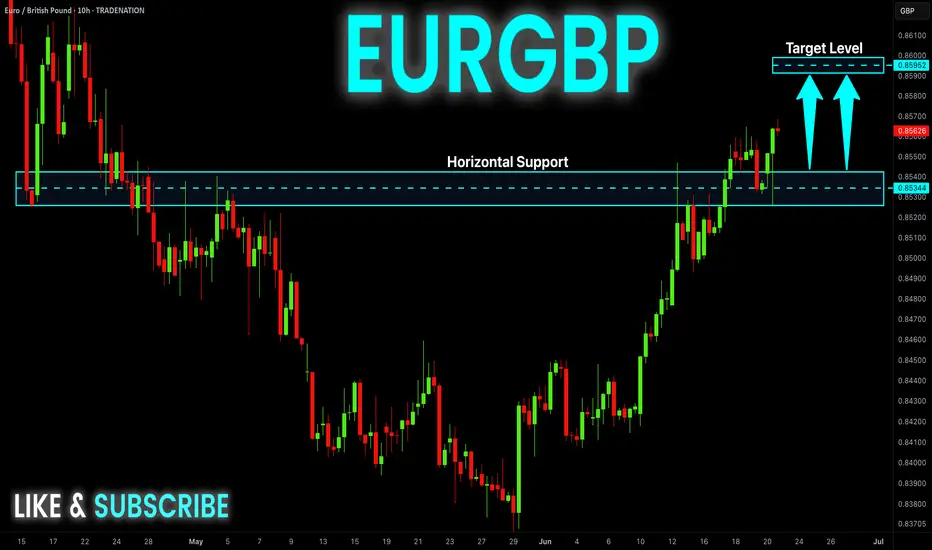
EUR-GBP Growth Ahead! Buy!
Hello,Traders!
EUR-GBP keeps growing
And the pair is already
Making a bullish rebound
From the horizontal support
Level of 0.8540 so we are
Bullish biased and we will
Be expecting a further
Bullish continuation
Buy!
Comment and subscribe to help us grow!
Check out other forecasts below too!
Disclosure: I am part of Trade Nation's Influencer program and receive a monthly fee for using their TradingView charts in my analysis.
NATGAS REBOUND AHEAD|LONG|
✅NATGAS went down to retest
A horizontal support of 3.820$
Which makes me locally bullish biased
And I think that a move up
From the level is to be expected
Towards the target above at 3.984$
LONG🚀
✅Like and subscribe to never miss a new idea!✅
Disclosure: I am part of Trade Nation's Influencer program and receive a monthly fee for using their TradingView charts in my analysis.

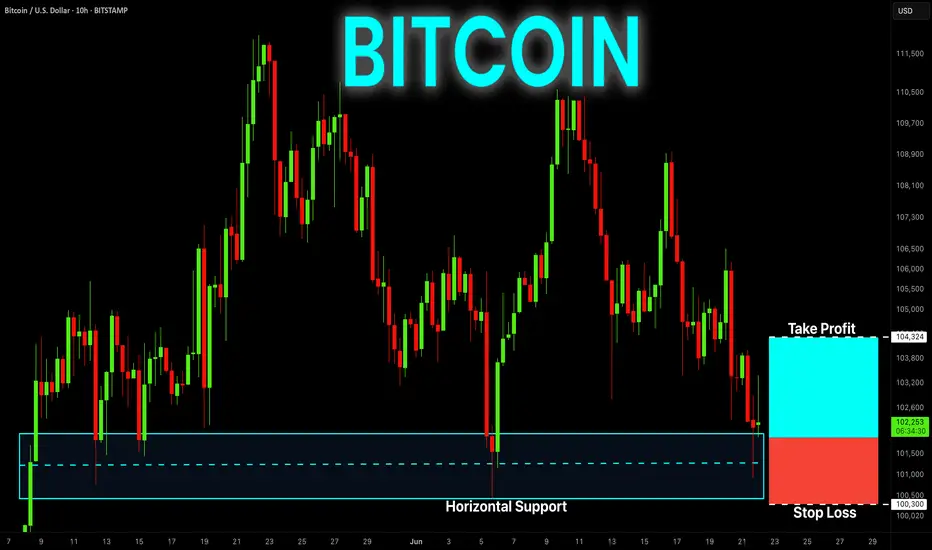
BITCOIN Free Signal! Buy!
Hello,Traders!
BITCOIN is retesting a
Horizontal support level
Around 101,288$ from
Where we will be expecting
A local rebound so we can
Go long with the Take Profit
Of 104,324$ and the Stop
Loss of 100,300$
Buy!
Comment and subscribe to help us grow!
Check out other forecasts below too!
Disclosure: I am part of Trade Nation's Influencer program and receive a monthly fee for using their TradingView charts in my analysis.
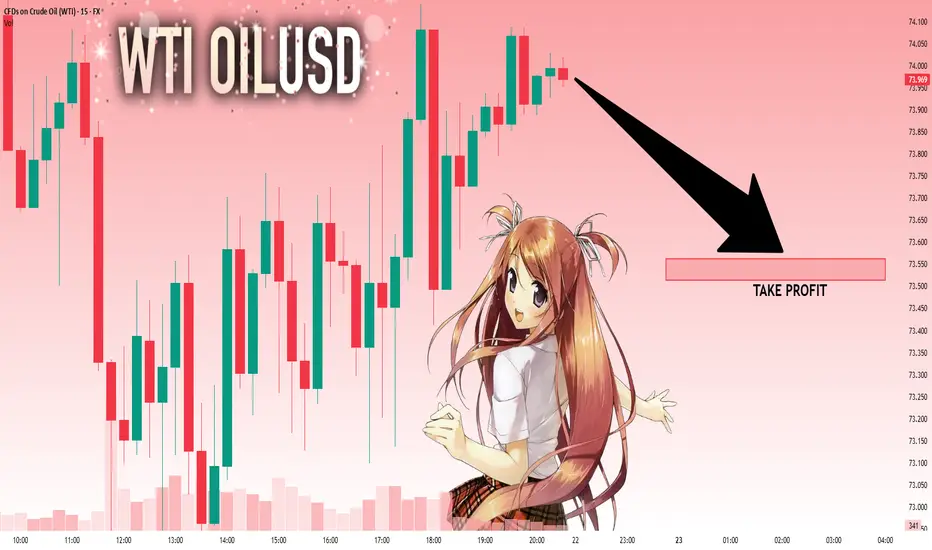
USOIL: Strong Bearish Sentiment! Short!
My dear friends,
Today we will analyse USOIL together☺️
The in-trend continuation seems likely as the current long-term trend appears to be strong, and price is holding below a key level of 73.969 So a bearish continuation seems plausible, targeting the next low. We should enter on confirmation, and place a stop-loss beyond the recent swing level.
❤️Sending you lots of Love and Hugs❤️
NG1!: Bulls Are Winning! Long!
My dear friends,
Today we will analyse NG1! together☺️
The market is at an inflection zone and price has now reached an area around 3.894 where previous reversals or breakouts have occurred.And a price reaction that we are seeing on multiple timeframes here could signal the next move up so we can enter on confirmation, and target the next key level of 3.993.Stop-loss is recommended beyond the inflection zone.
❤️Sending you lots of Love and Hugs❤️

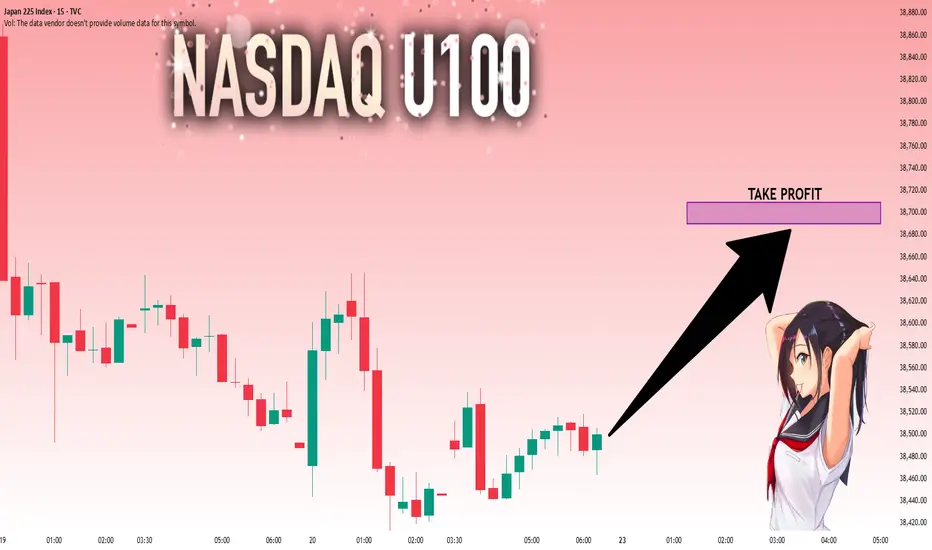
NI225: Next Move Is Up! Long!
My dear friends,
Today we will analyse NI225 together☺️
The price is near a wide key level
and the pair is approaching a significant decision level of 38,501.82 Therefore, a strong bullish reaction here could determine the next move up.We will watch for a confirmation candle, and then target the next key level of 38,689.93.Recommend Stop-loss is beyond the current level.
❤️Sending you lots of Love and Hugs❤️
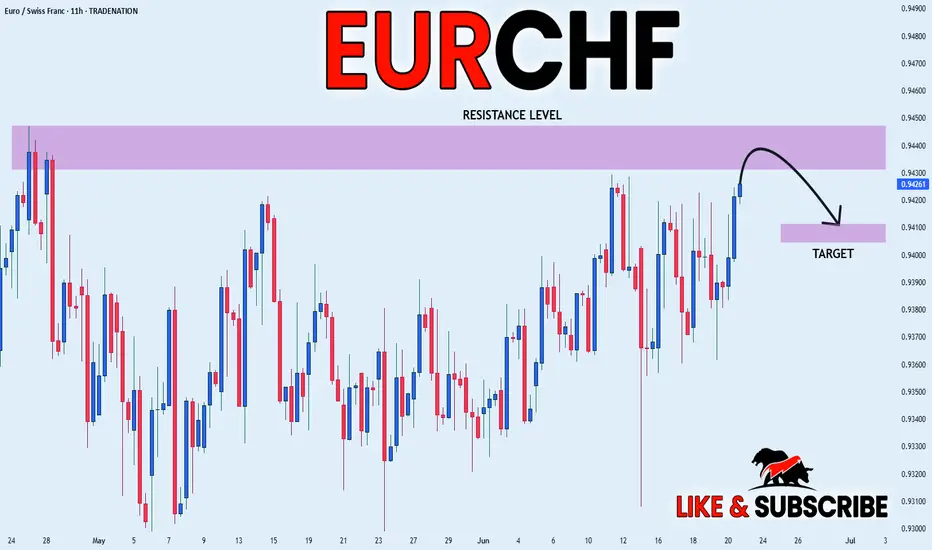
EUR_CHF CORRECTION AHEAD|SHORT|
✅EUR_CHF is set to retest a
Strong resistance level above at 0.9446
After trading in a local uptrend for some time
Which makes a bearish pullback a likely scenario
With the target being a local support below at 0.9410
SHORT🔥
✅Like and subscribe to never miss a new idea!✅
Disclosure: I am part of Trade Nation's Influencer program and receive a monthly fee for using their TradingView charts in my analysis.
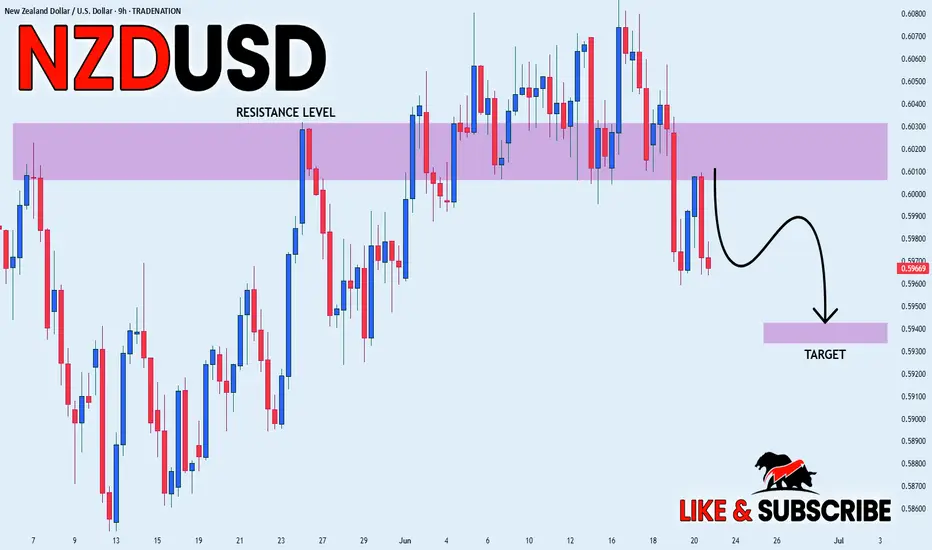
NZD_USD WILL GO DOWN|SHORT|
✅NZD_USD is going down currently
As the pair broke the key structure level of 0.6030
Which is now a resistance, and has made a pullback
And the retest, so I think the price will keep going down on Monday
SHORT🔥
✅Like and subscribe to never miss a new idea!✅
Disclosure: I am part of Trade Nation's Influencer program and receive a monthly fee for using their TradingView charts in my analysis.
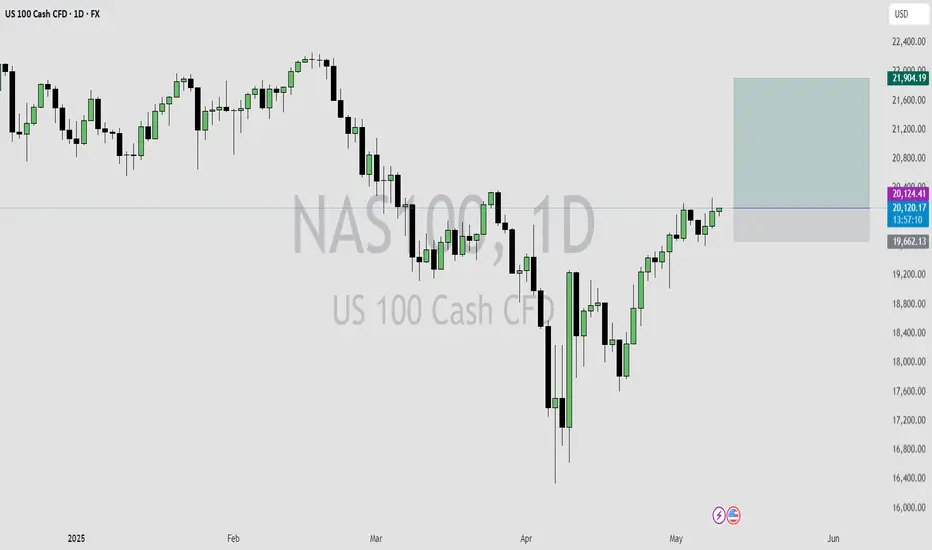
NASDAQ Bullish Play into Liquidity Before Potential ReversalForecast:
NOTE: At this moment, this is a forecast and trades will be taken dependent on live PA.
Price has reacted strongly off the 21,410–21,430 Daily Order Block, suggesting bullish intent. If bullish structure holds, I expect a move into the 22,060–22,130 liquidity zone, where sell-side setups could form.
This is a classic Buy to Sell model:
Buy from OB at ~21,420
Target liquidity above recent highs (~22,100+)
Look for shorts after sweep into 22,130–22,220 range
Invalidation: Break and close below 21,410 suggests the OB failed — potential deeper drop toward 20,700.

NASDAQ READY TO CONTINUE THE LONG-TERM WEEKLY BULLISH RUN
FX:NAS100
I just entered this buy trade on Nasdaq on the daily time frame.
The trade setup is a Swing trade following the monthly and weekly orderflow.
The Monthly is bullish, the weekly is also bullish, so I entered on the daily time frame retracement.
My overall take profit is a risk reward of 1:4.
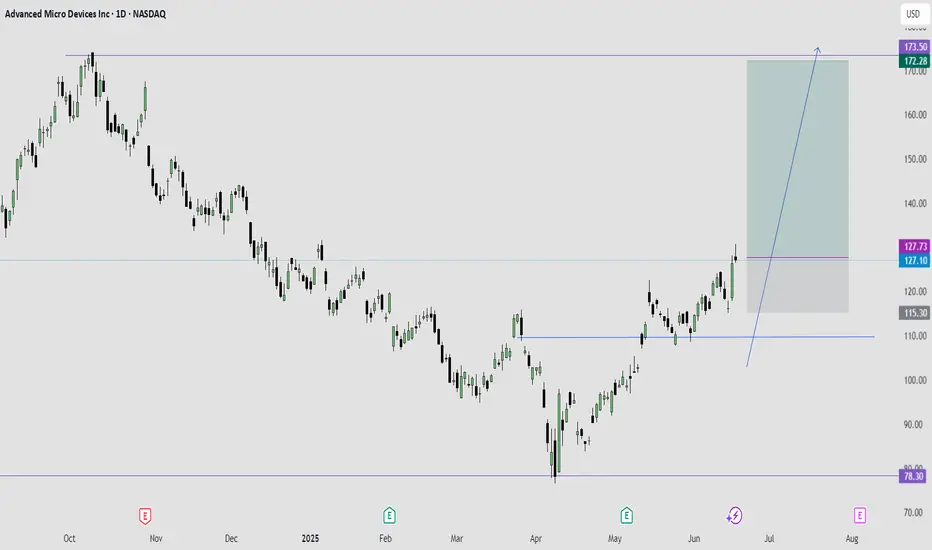
AMD IS READY FOR A STRONG BULLISH MOVENASDAQ:AMD Right now, am extremely bullish on AMD.
I expect AMD to give a good bullish run to trail NVIDIA.
Technically, AMD is supper bullish right now, having had a multiple bullish break of structure on the daily time frame.
I took a long entry on the bullish break of structure on daily time frame. Stop loss is below the recent structure swing low.
What do you see on your chart?