XAUUSD Daily Outlook | June 23, 2025👋 Hello Gold traders!
We’re entering a new week with structure sharpening around key zones. Price is now hovering just below the decision shelf at 3385, and all eyes are on whether bulls defend structure — or bears trigger the first real trap. Let’s zoom in with pure Daily focus and zero noise.
🔸 DAILY STRUCTURE OUTLOOK
Gold remains in a clear bullish trend on the Daily timeframe, with the last confirmed Higher High at 3452. However, current price is in a retracement phase, testing the area just below the BOS and reacting to recent liquidity sweeps.
Despite rising USD pressure, the bullish structure remains intact unless a daily close breaks below 3315.
📌 Daily Bias: Bullish (retracement phase active)
🧭 Macro Context:
Heavy Fed week: Powell testifies Tue & Wed, Core PCE and Consumer Sentiment hit Fri.
USD may remain supported short-term, but gold still benefits from long-term inflation hedge + geopolitical risk flows.
🔹 STRUCTURAL KEY ZONES (D1)
Type Zone Confluences
🟢 Buy Zone #1 3320 – 3340 Daily OB, FVG base, EMA50 , structure HL defense
🔵 Buy Zone #2 3265 – 3285 Untapped OB + imbalance, deeper fib retrace
🟠 Flip Zone 3363 – 3385 Former BOS, FVG retest, minor liquidity shelf
🔴 Sell Zone #1 3405 – 3425 First sweep of equal highs, premium OB, FVG pocket
🔴 Sell Zone #2 3440 – 3460 Extreme bull trap: clean OB top, imbalance cluster
🎯 EXECUTION PLAN
🔍 Flip Zone is your battlefield — if bulls reclaim this zone cleanly, we may revisit 3405.
📉 3405–3425 offers the first sniper short opportunity: liquidity sweep + OB + FVG = prime short trigger.
📈 3320–3340 is the cleanest high-RR long zone — only enter if price reacts with strength and forms a rejection candle or bullish engulfing.
🧊 If 3320 fails, standby at 3265–3285 for a deeper correction entry backed by clean OB/FVG logic.
✅ SUMMARY & ACTION PLAN
Wait for confirmation at the Flip Zone — do not force direction.
Most precise sniper trades expected:
🔻 Sell from 3405–3425 → target Flip Zone
🔺 Buy from 3320–3340 → target 3385–3400
Only engage with clear OB reactions and strong PA confirmation — no bounce chasing.
💬 If this outlook gave you clarity, drop a 🚀 and a like to support the work — it helps more traders find it.
💡 Got feedback or want to ask something? Comment below — we read everything.
📌 Follow GoldFxMinds for high-precision sniper plans, every single day.
📌 Disclaimer: I'm part of Trade Nation's Influencer Program and receive compensation for using their charts on TradingView. This content is for educational purposes only.
— GoldFxMinds
SMC
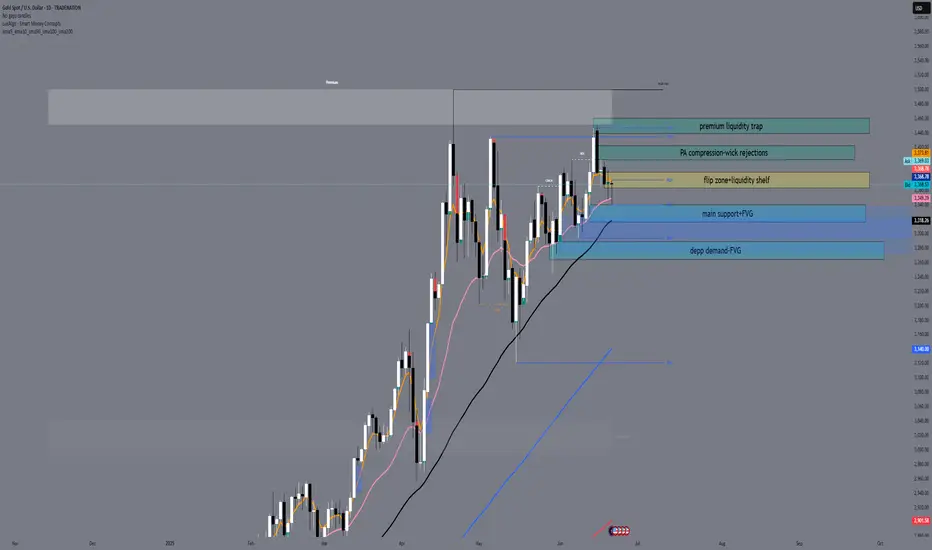
XAUUSD Weekly Outlook | June 23–27, 2025👋 Hey gold traders! As we close out the FOMC week and head into the final stretch of June, gold continues to hold bullish structure — but this week's candle is entering a very sensitive premium area. Let's break it all down in full top-down clarity:
🔍 Weekly Structure Update
✅ Weekly BOS confirmed since November 2023
✅ Price holding above EMA 5/21/50 — bullish lock intact
🔼 Current HH printed at 3452
📍Price is now entering a weekly FVG + supply trap zone around 3440–3460
🟣 RSI divergence starting to appear — caution in premium
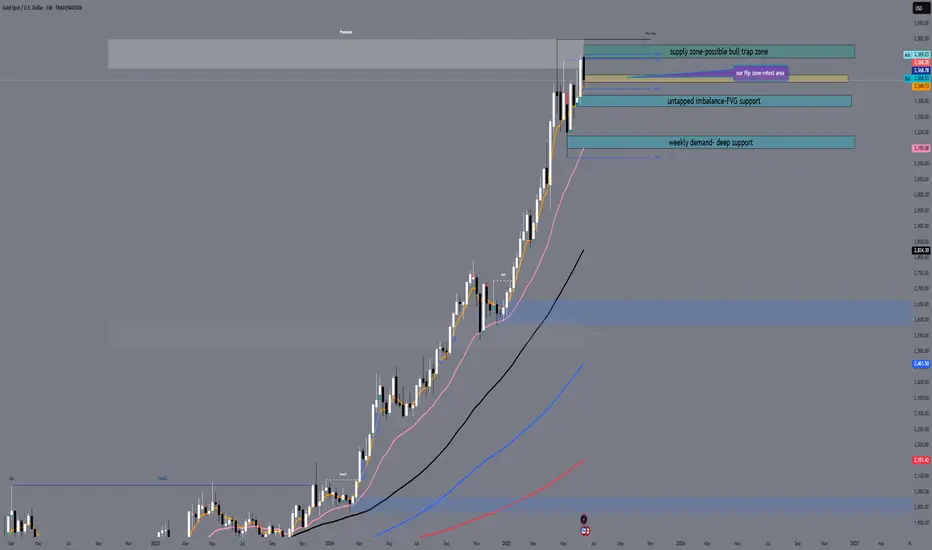
🗺 Key Weekly Zones
Type Price Range Context
🔵 Demand Zone 3150 – 3190 Weekly OB + EMA50 confluence
🟣 FVG Support 3284 – 3320 Fresh imbalance post BOS
🟠 Flip Zone 3363 – 3385 Retest of BOS + FVG bottom
🔴 Sell Trap Zone 3440 – 3460 Weekly OB + liquidity sweep area
🧠 Bias This Week
📌 Bullish, but extended.
We expect a reaction from 3440–3460, not blind continuation.
The next healthy buy opportunity is only valid on a retrace toward 3320–3280, aligned with imbalance + structure.
🧭 GoldFxMinds Game Plan
Above 3440–3460 = overextension — wait for trap/sweep confirmation 🧨
Below 3363 = bearish flip zone — risk of revisiting 3280
Ideal buy = 3284–3320 → only on bullish PA or reversal confirmation
📰 Upcoming Economic Events (June 23–27)
🗣 FOMC Speakers flood the week (Waller, Powell, Williams, Goolsbee, Hammack, etc.)
🏠 Existing & New Home Sales, Consumer Confidence, Pending Home Sales
🛢 Crude Oil & Natural Gas Inventory reports
📊 Final GDP q/q, Core PCE, Personal Spending/Income
📉 Durable Goods, Unemployment Claims
🧪 Bank Stress Test Results (Friday)
⚠️ This is a dense news week — stay alert for surprise volatility, especially around Powell’s testimonies (Tue & Wed).
⚠️ Summary:
We are no longer in discount — we are inside the premium trap. Gold remains bullish, but 3440–3460 is a red flag zone. If this becomes the top, watch the flip at 3363–3385. Only re-enter long if structure confirms.
💬 If you found this helpful, drop a comment, give it a like, and make sure to follow GoldFxMinds for more sniper-level updates every week!
📣 This post was made using the Trade Nation chart feed. As a partner in their influencer program, I receive compensation for using and sharing their tools.
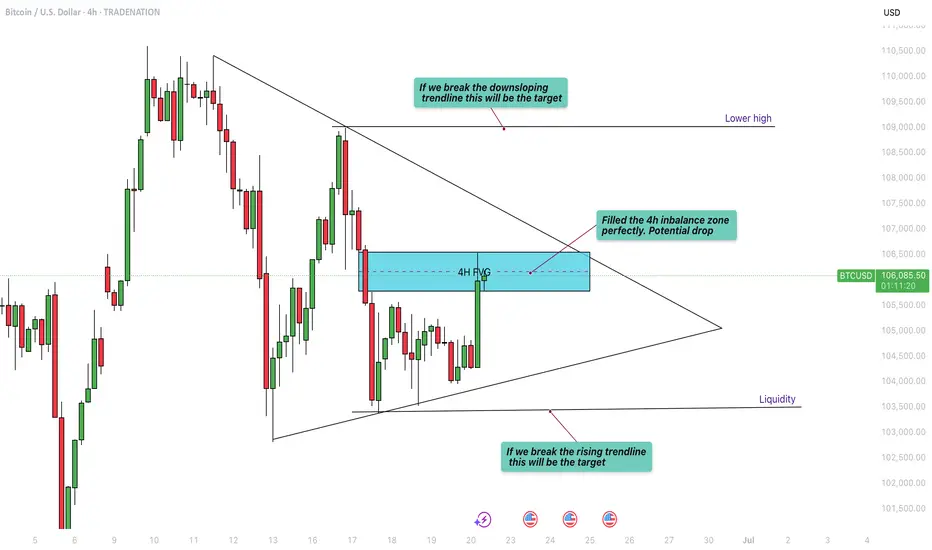
Bitcoin - Will it explode up or down?Introduction
Bitcoin (BTC) is currently trading within a symmetrical triangle pattern, forming a series of higher lows and lower highs. This price action indicates a tightening range as the market approaches the apex of the triangle. A breakout is becoming increasingly likely in the coming days, and traders are now watching closely to see which direction BTC will choose. Will it break to the upside or the downside?
Pattern Trading
The symmetrical triangle has been a consistent feature of BTC’s recent price action. Price has been oscillating between the descending resistance and ascending support trendlines, gradually compressing the range. Based on the current structure, Bitcoin could continue moving within this pattern until around June 26th, when the triangle becomes extremely narrow and a breakout becomes imminent. Historically, such setups can produce false breakouts or “fake-outs,” where the price temporarily moves in one direction before sharply reversing and breaking out in the opposite direction. These moves often trap traders who enter too early, so caution is advised. Market manipulation is not uncommon in these tight formations, making it essential to wait for confirmation before entering a position.
4H Fair Value Gap (FVG)
Bitcoin has recently filled a 4-hour Fair Value Gap (FVG), a zone that often attracts price due to inefficiencies in the market. Now that this gap has been filled, there could be increased selling pressure, potentially pushing BTC back down toward the lower boundary of the triangle. If BTC is unable to break through the resistance created by this FVG, we may see more bearish momentum. However, should BTC manage to break and hold above this imbalance zone, it would be a strong sign of bullish intent and could open the door for a move to the upside. For now, though, this area remains a significant resistance level.
Upside Target
If BTC manages to break out of the triangle to the upside with strong volume and confirmation, the first major resistance level is around $109,000. This would be a logical target for bulls, as it represents a key zone of liquidity and previous interest. A successful move toward this level would confirm the bullish breakout and could set the stage for further gains, depending on broader market sentiment.
Downside Targets
Conversely, if BTC breaks below the lower trendline of the triangle, the first area to watch is around $103,500. This level is where a significant amount of liquidity has built up, and it could act as initial support. However, if that level fails to hold, the next key psychological level to watch would be $100,000. A drop below this milestone could trigger panic selling and further downside, especially if market sentiment turns negative.
Conclusion
At this point, BTC is at a critical juncture, and traders should remain patient as the market decides its next direction. While the current rejection from the 4H FVG suggests some short-term bearish pressure, the overall pattern remains neutral until a confirmed breakout occurs. Trading within the triangle can be risky due to the possibility of fake-outs, so it’s best to wait for clear confirmation before committing to a trade. Stay cautious, manage your risk carefully, and prepare for volatility as Bitcoin approaches a decisive move.
Disclosure: I am part of Trade Nation's Influencer program and receive a monthly fee for using their TradingView charts in my analysis.
Thanks for your support.
- Make sure to follow me so you don't miss out on the next analysis!
- Drop a like and leave a comment!
EURUSD - 2nd potential entryEvening all
Here is a still screenshot of what I am looking for the market open on EURUSD come Sunday night after the spreads have died down on the pair.
My pending order will go directly on the FVG with my stops below the manipulation of the range.
If I get tagged in great. If I don't also great if we continue to move high I mill just manage the one position.
If I am tagged in I will give you and update with a new idea and then depending on how that idea plays out win or lose I will come back and re-visit it and break it down some more.
However I have high hopes for this trade to make it up to 1.16300
Have a great weekend
and I will speak to you all soon
EURUSD - BreakdownApologies video is a bit rushed.
Wanted to get it done before the weekend arrived.
There's so much more to this video and entry reason that I have left out unintentionally like the fact we swept the Asia lows before creating a BoS. There are also a few other things like I have left out but without looking at the chart right now I cannot remember off the top of my head.
I will post the idea of this trade below so you can see that I was taking it before it played out.
Hope you all have a great weekend and a better trading week than you had this week.
Enjoy
P.S if you have any questions please do message

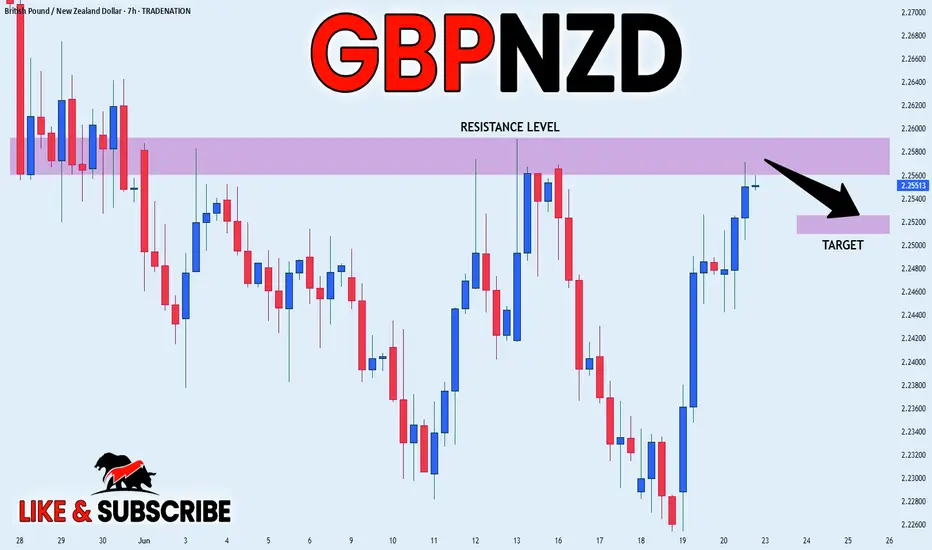
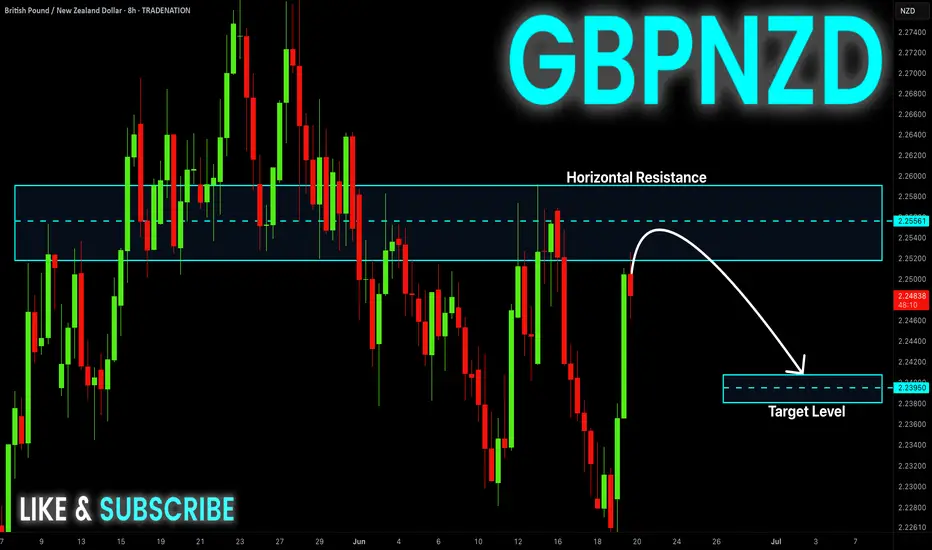
GBP_NZD RISKY SHORT|
✅GBP_NZD is going up now
But a strong resistance level is ahead at 2.2591
Thus I am expecting a pullback
And a move down towards the target of 2.2524
SHORT🔥
✅Like and subscribe to never miss a new idea!✅
Disclosure: I am part of Trade Nation's Influencer program and receive a monthly fee for using their TradingView charts in my analysis.
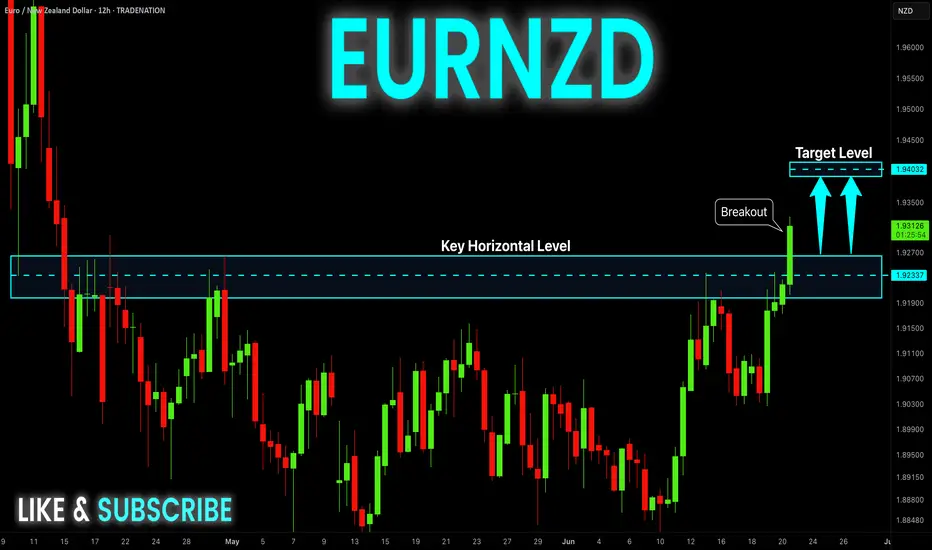
EUR-NZD Bullish Breakout! Buy!
Hello,Traders!
EUR-NZD keeps growing and
The pair made a bullish breakout
Of the key horizontal level
Of 1.9270 and the breakout
Is confirmed so we are bullish
Biased and we will be
Expecting a further move up
Buy!
Comment and subscribe to help us grow!
Check out other forecasts below too!
Disclosure: I am part of Trade Nation's Influencer program and receive a monthly fee for using their TradingView charts in my analysis.
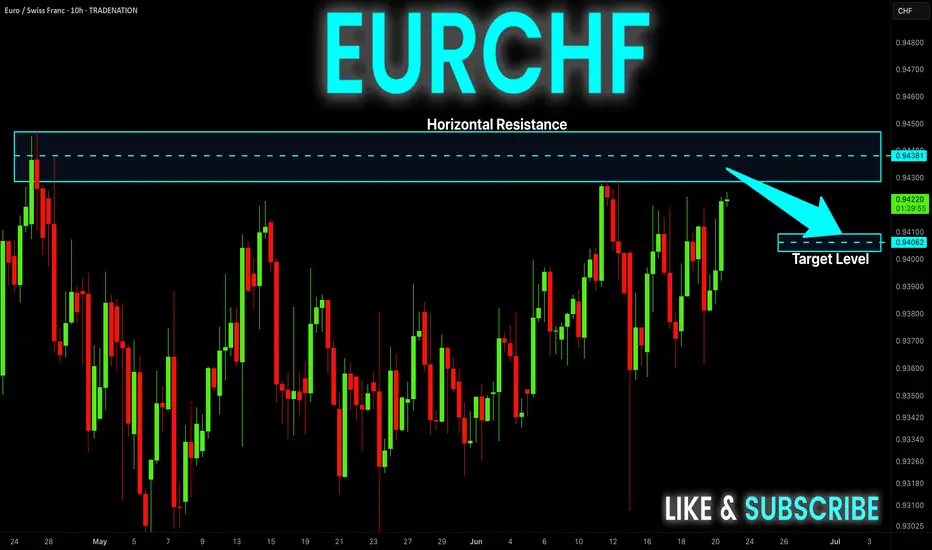
EUR-CHF Resistance Ahead! Sell!
Hello,Traders!
EUR-CHF keeps growing
But a strong horizontal
Resistance level is ahead
Around 0.9443 so after
The retest we will be
Expecting a local pullback
And a local bearish correction
Sell!
Comment and subscribe to help us grow!
Check out other forecasts below too!
Disclosure: I am part of Trade Nation's Influencer program and receive a monthly fee for using their TradingView charts in my analysis.
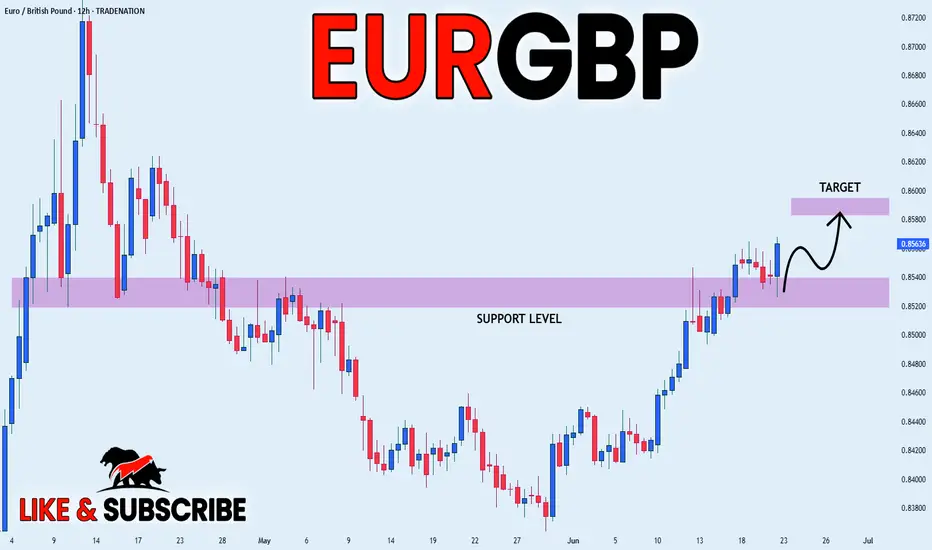
EUR_GBP WILL KEEP GROWI|LONG|
✅EUR_GBP broke the key horizontal level of 0.8540
Which is now a support then went down
To retest it and we are now seeing
A bullish reaction so I think that
The pair will go even higher up
LONG🚀
✅Like and subscribe to never miss a new idea!✅
Disclosure: I am part of Trade Nation's Influencer program and receive a monthly fee for using their TradingView charts in my analysis.
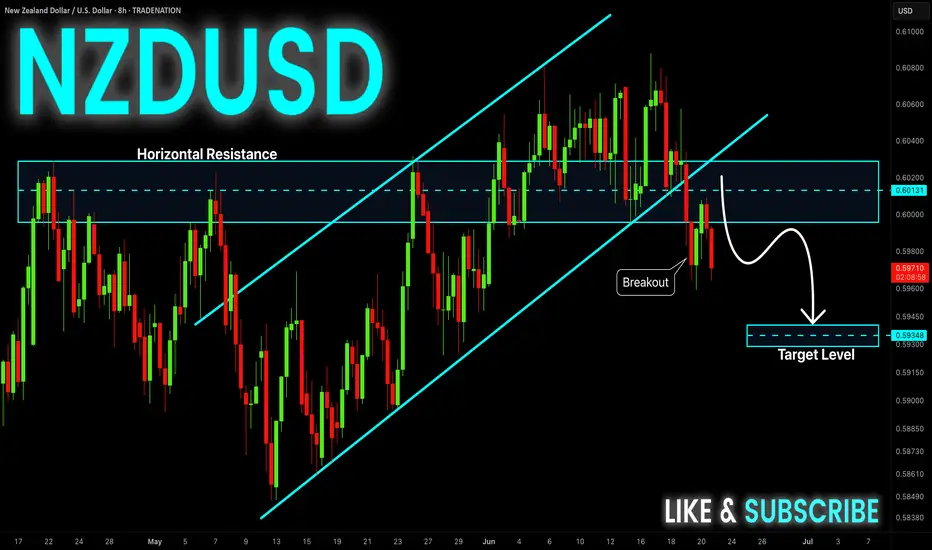
NZD-USD Bearish Breakout! Sell!
Hello,Traders!
NZD-USD broke out of the
Rising channel and then made
A bearish breakout of the
Horizontal key level too
Around 0.0602 which is
Now a resistance, then
Made a pullback and retest
And is going down again which
Reinforces our local bearish bias
And we will be expecting a
Further bearish move down
Sell!
Comment and subscribe to help us grow!
Check out other forecasts below too!
Disclosure: I am part of Trade Nation's Influencer program and receive a monthly fee for using their TradingView charts in my analysis.
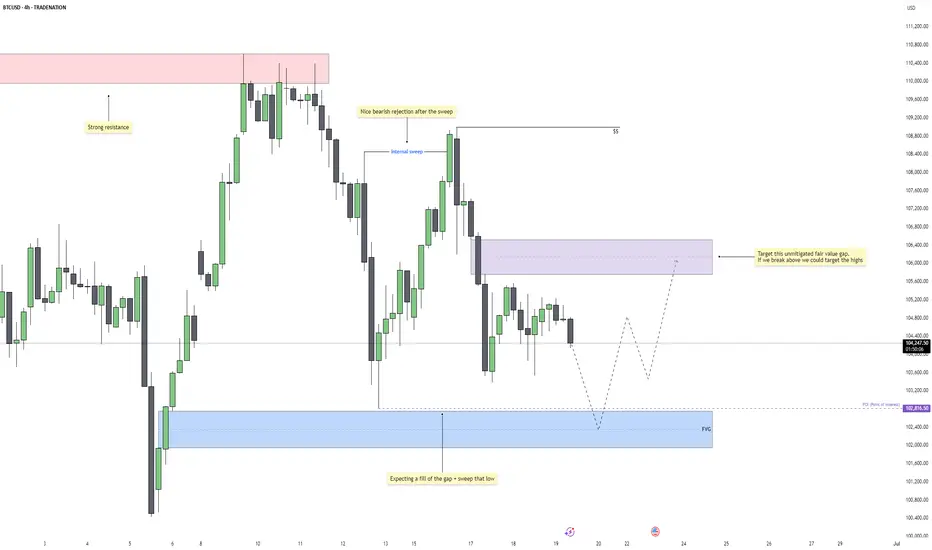
Bitcoin - Expecting Liquidity Grab at 102.8k Before Relief MoveMarket Context
After a strong rejection from resistance, price has shown clear signs of internal weakness. We recently got an internal liquidity sweep followed by a sharp move down, confirming a shift in momentum. The market is currently compressing just below a key fair value gap, hinting at further downside before any real bullish structure can form
Internal Sweep and Bearish Pressure
The internal sweep acted as a final inducement before the market sold off. The reaction afterward was clean and aggressive, suggesting that smart money is offloading positions into trapped longs. Price has now stalled in a tight range, and the lack of bullish follow-through adds weight to the idea that lower prices are still on the table.
Fair Value Gap Below as Draw
The unfilled imbalance below, lining up near 102.8k, is acting as a magnet. This level has not been tapped and lines up cleanly with the idea of a final liquidity sweep before any retracement. It would make sense to target this zone to clear out remaining liquidity and rebalance price before reassessing.
Retracement Scenarios After the Sweep
Once that low is swept and the gap is filled, we could see a retracement back into the previous fair value gap around 106k. This could either form a lower high, continuing the broader downtrend, or potentially run the high if there's enough momentum. Either way, the reaction from that level will offer the next major clue on direction.
Key Expectation
Until the low around 102.8k is swept, the bearish narrative remains intact. The cleanest setup would be a liquidity run into that level followed by a reaction that leads us higher, ideally back toward the 106k zone. From there, we’ll watch how price behaves to decide whether a deeper correction or a trend continuation is in play.
Conclusion
Still leaning bearish short-term as long as that gap and low remain unfilled. Once we tap into the 102.8k area, I’ll be watching for a shift that could give us a play back into the 106k gap. It’s all about liquidity, structure, and the cleanest path for smart money to move.
Disclosure: I am part of Trade Nation's Influencer program and receive a monthly fee for using their TradingView charts in my analysis.
Thanks for your support!
If you found this idea helpful or learned something new, drop a like 👍 and leave a comment, I’d love to hear your thoughts! 🚀
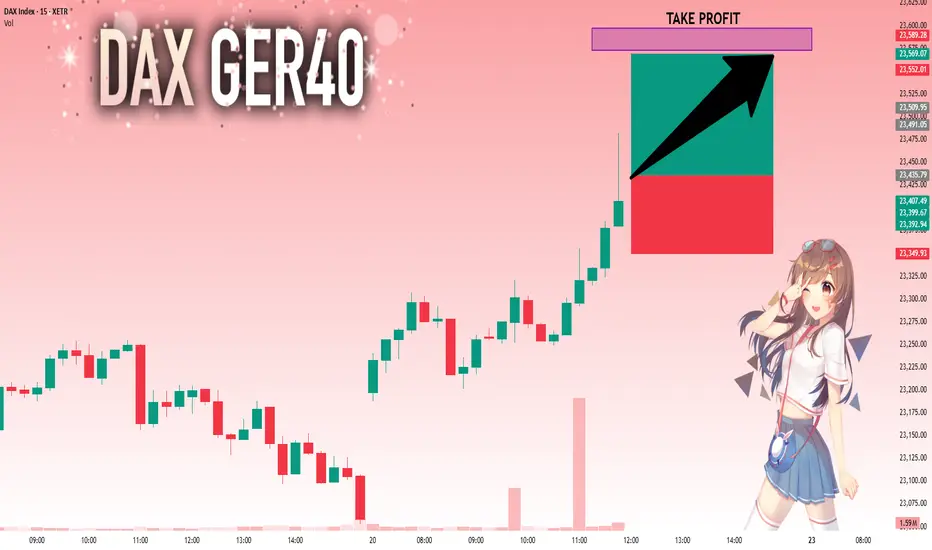
DAX: Target Is Up! Long!
My dear friends,
Today we will analyse DAX together☺️
The recent price action suggests a shift in mid-term momentum. A break above the current local range around 23,435.79 will confirm the new direction upwards with the target being the next key level of 23,572.93 and a reconvened placement of a stop-loss beyond the range.
❤️Sending you lots of Love and Hugs❤️
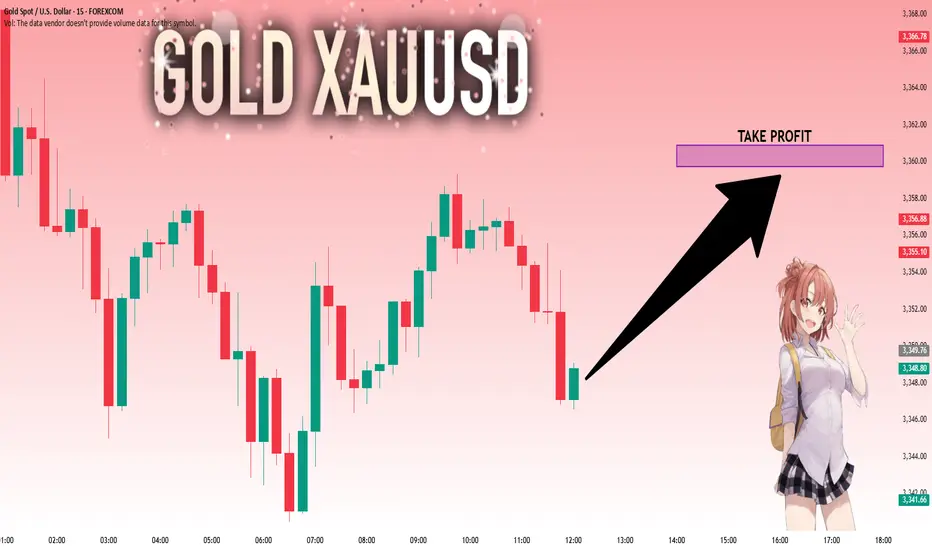
GOLD: Move Up Expected! Long!
My dear friends,
Today we will analyse GOLD together☺️
The in-trend continuation seems likely as the current long-term trend appears to be strong, and price is holding above a key level of 3,348.30 So a bullish continuation seems plausible, targeting the next high. We should enter on confirmation, and place a stop-loss beyond the recent swing level.
❤️Sending you lots of Love and Hugs❤️
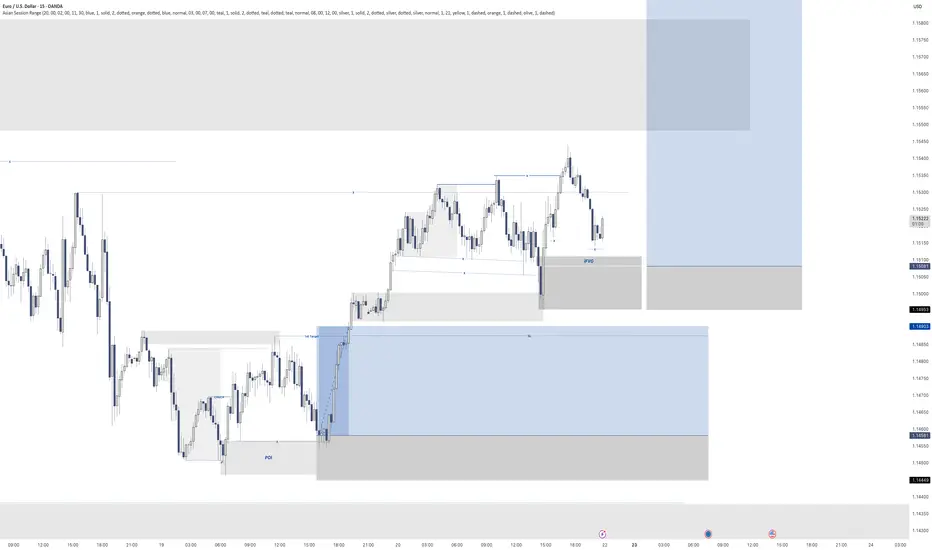
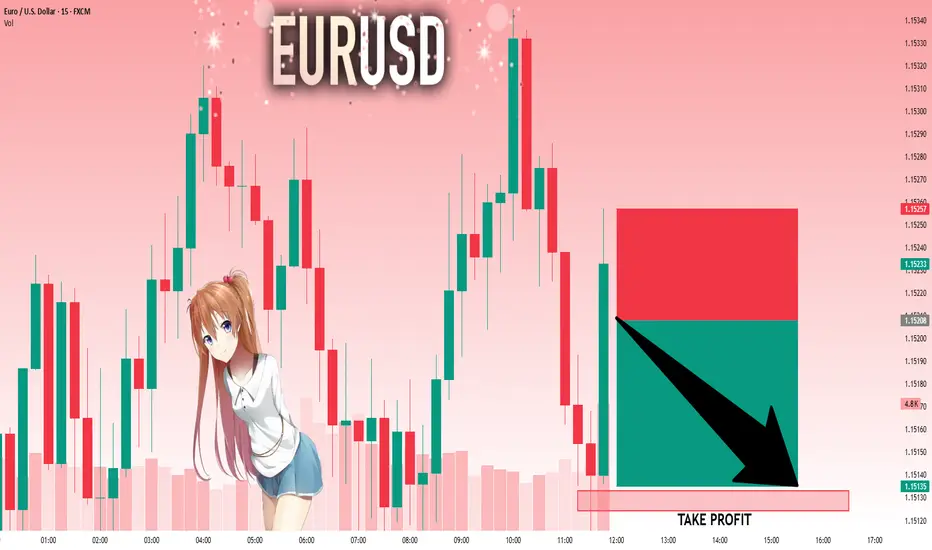
EURUSD: Move Down Expected! Short!
My dear friends,
Today we will analyse EURUSD together☺️
The market is at an inflection zone and price has now reached an area around 1.15208 where previous reversals or breakouts have occurred.And a price reaction that we are seeing on multiple timeframes here could signal the next move down so we can enter on confirmation, and target the next key level of 1.15133..Stop-loss is recommended beyond the inflection zone.
❤️Sending you lots of Love and Hugs❤️
SILVER: Local Bearish Bias! Short!
My dear friends,
Today we will analyse SILVER together☺️
The price is near a wide key level
and the pair is approaching a significant decision level of 36.067 Therefore, a strong bearish reaction here could determine the next move down.We will watch for a confirmation candle, and then target the next key level of 35.716..Recommend Stop-loss is beyond the current level.
❤️Sending you lots of Love and Hugs❤️

Bitcoin– bearish momentum builds after rejection at $109KIntroduction
Bitcoin (BTC) is currently showing weakness after forming a lower high at $109,000. This level acted as a significant point of rejection, and since then, BTC has been moving lower. The price has broken through key support areas, indicating a possible shift in market structure. In this analysis, we’ll break down the recent price action, explain the technical signals behind the move, and discuss what could be expected in the short term.
Rejection from the 0.786 Fibonacci Level
The rejection at the $109,000 level aligns perfectly with the 0.786 Fibonacci retracement on the 4-hour timeframe. This level is often seen as a strong resistance point during corrective moves, and in this case, it held firmly. The precision of this rejection gives it more weight, and since hitting that point, BTC has been steadily declining. This move down suggests that buyers were unable to push through the resistance, leading to increased selling pressure.
Break of the 4H Bullish FVG
As BTC started its decline from $109,000, it broke through the bullish Fair Value Gap (FVG) that had formed earlier on the 4-hour chart. This gap previously served as a support zone but has now been decisively broken with strong volume. The loss of this level is significant, as it marks a breakdown of the bullish structure and opens the door for further downside movement. In the process of this move lower, BTC has created a new bearish FVG on the 4-hour timeframe. This gap remains open and could potentially act as a magnet for price to revisit, offering a possible short entry if price retraces into that zone. However, the clear break below the previous bullish FVG indicates a shift in momentum and supports a more bearish bias for now.
Downside Target at $102.7K
Given the recent breakdown, the next key level to watch is around $102,700. This area marks the wick low on the 4-hour timeframe and stands out due to the size and sharpness of the wick. Such large wicks often leave behind unfilled orders, which markets tend to revisit over time. The presence of these resting orders makes this level a likely target for the ongoing move down. It also acts as a strong area of potential support, where buyers might step back in if the price reaches that point.
Conclusion
With the rejection from the 0.786 Fibonacci level and the failure to hold the bullish 4H FVG, BTC has shown clear signs of weakness. The breakdown in structure suggests a continuation to the downside is likely, with $102.7k being the most immediate target. This level could serve as a strong support zone due to the unfilled orders left behind by the previous wick. Until BTC reclaims key support levels or shows a shift in momentum, the bias remains bearish in the short term, and traders should remain cautious while expecting further downside.
Thanks for your support.
- Make sure to follow me so you don't miss out on the next analysis!
- Drop a like and leave a comment!

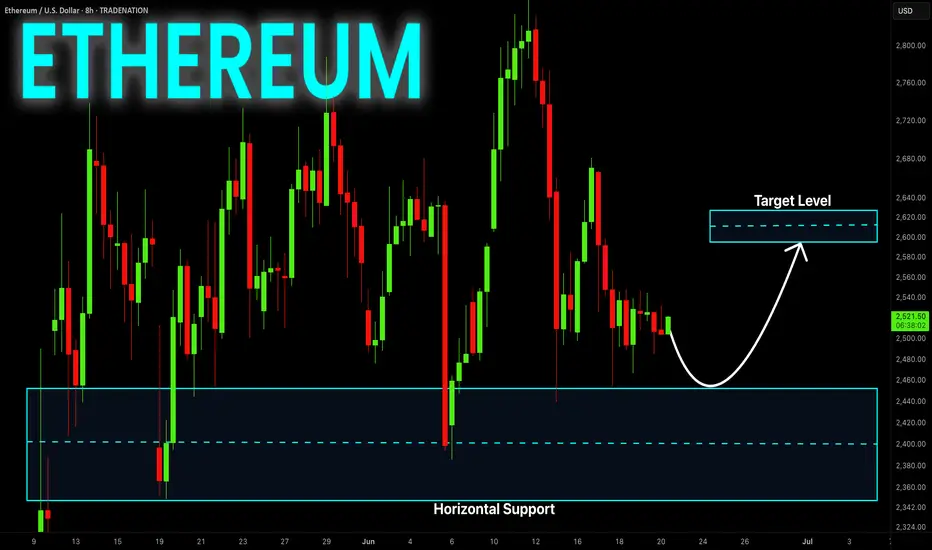
ETHEREUM Risky Long! Buy!
Hello,Traders!
ETHEREUM is consolidating
Above the horizontal support
Area around 2360$ and we
Are already seeing a local
Rebound from the level
So as we are bullish biased
A further price growth
Is to be expected
Buy!
Comment and subscribe to help us grow!
Check out other forecasts below too!
Disclosure: I am part of Trade Nation's Influencer program and receive a monthly fee for using their TradingView charts in my analysis.
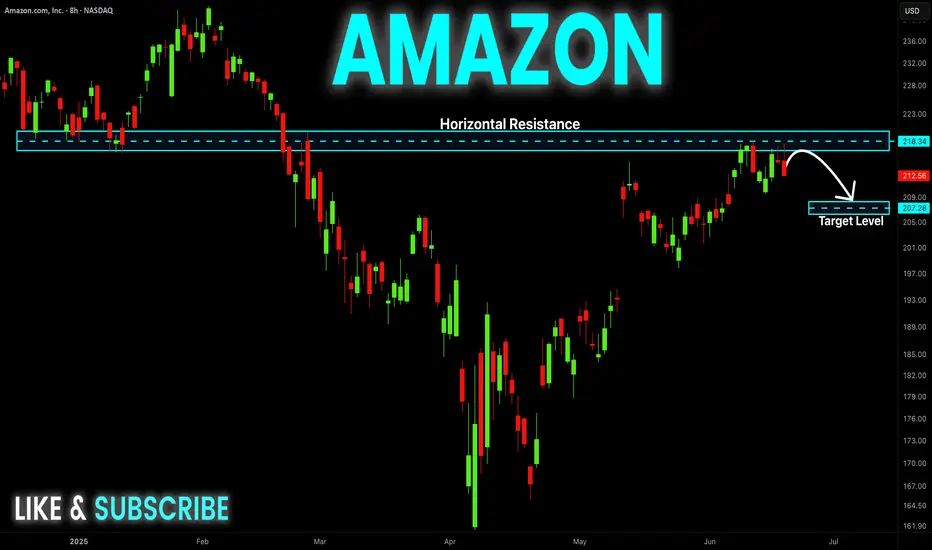
AMAZON Local Short! Sell!
Hello,Traders!
AMAZON made a retest
Of the horizontal resistance
Around 219$ and the stock
Is already making a local
Bearish pullback so a further
Bearish correction
Is to be expected
Sell!
Comment and subscribe to help us grow!
Check out other forecasts below too!
Disclosure: I am part of Trade Nation's Influencer program and receive a monthly fee for using their TradingView charts in my analysis.
NATGAS STRONG RESISTANCE AHEAD|SHORT|
✅NATGAS has been growing recently
And Gas seems locally overbought
So as the pair is approaching
A horizontal resistance of 4.256$
Price decline is to be expected
SHORT🔥
✅Like and subscribe to never miss a new idea!✅
Disclosure: I am part of Trade Nation's Influencer program and receive a monthly fee for using their TradingView charts in my analysis.

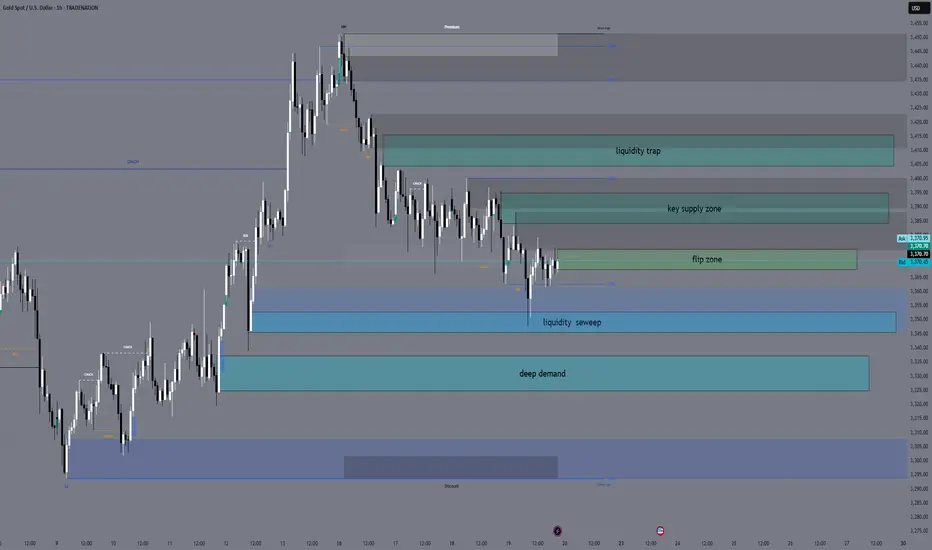
XAUUSD Daily Sniper Plan – June 20, 2025🧭 Market Context
Following FOMC volatility and a Wednesday bullish reaction off 3351, XAUUSD is now hovering near 3370. The structure remains compressed between a flat EMA cluster and a key supply zone above. Thursday may bring low-to-moderate volatility early on, but watch for reaction after Philly Fed Manufacturing and CB Leading Index data during NY. Also, stay alert for a tentative Fed Monetary Policy Report release that may trigger later-session volatility.
🔍 Structural Overview
Daily Bias: Neutral-to-Bullish
H4 Trend: Still respecting higher lows but price is trapped under dynamic resistance
H1–M15: Consolidation between 3351 demand and 3388 supply
RSI: Mixed; compression between 47–55
EMA Flow: Flat on M30/H1; slight compression building for breakout
Liquidity Pools:
Resting buy-side above 3388
Resting sell-side below 3351 and deeper toward 3340
📍 Key Zones to Watch
🔵 BUY ZONE #1 – 3345–3352
🔹 Demand zone | Previous NY reversal base
🔹 M15 OB + EQ zone + liquidity sweep
🔹 Below full EMA stack → oversold entry if NY flushes pre-news
🔵 BUY ZONE #2 – 3328–3340
🔹 Deeper HTF demand + RSI oversold potential
🔹 Bullish CHoCH reaction zone from last week
🔹 High RR for recovery play if price collapses during NY news
🔴 SELL ZONE #1 – 3384–3395
🔸 Rejected on FOMC wicks
🔸 Key supply zone + EMA200 (M30/H1)
🔸 Fakeout zone → valid if price spikes before NY volatility
🔴 SELL ZONE #2 – 3405–3415
🔸 Secondary high liquidity trap
🔸 Last bullish FVG inefficiency
🔸 To be used only in case of irrational spikes post-data
🟠 FLIP ZONE – 3368–3375
🔸 Compression zone + recent CHoCH
🔸 EMA50 (M15–H1) aligning
🔸 Watch for breakout and real volume entry → flip zone into continuation
📌 Note:
Tomorrow’s news events:
Philly Fed Manufacturing Index
CB Leading Index m/m
Fed Monetary Policy Report (Tentative)
This could bring range plays early and a directional break later. Stay patient and wait for confirmation inside zones. Flip zone is ideal for quick scalps if volume picks up.
🔥 Stay sharp and don’t force trades in pre-news chop. Clean zones only.
Tag us if you’re using the plan, and don’t forget:
🧠 Think in structure. Enter in precision.
– GoldFxMinds
🟢 Disclosure: I am part of TradeNation's Influencer program and receive a monthly fee for using their TradingView charts in my analyses and educational articles.
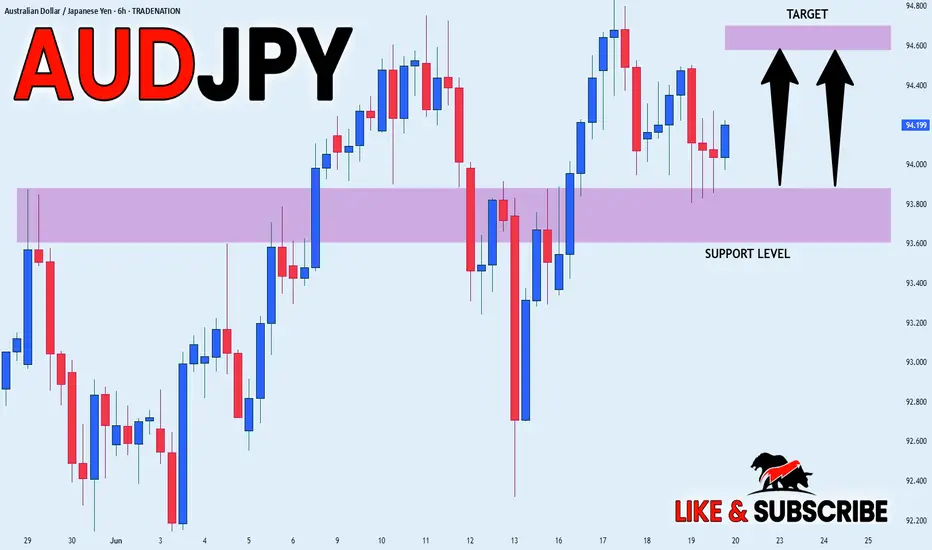
AUD_JPY GROWTH AHEAD|LONG|
✅AUD_JPY has retested a key support level of 93.800
And as the pair is already making a bullish rebound
A move up to retest the supply level above at 94.600 is likely
LONG🚀
✅Like and subscribe to never miss a new idea!✅
Disclosure: I am part of Trade Nation's Influencer program and receive a monthly fee for using their TradingView charts in my analysis.
GBP-NZD Will Go Down! Sell!
Hello,Traders!
GBP-NZD will soon hit
A horizontal resistance
Of 2.2556 and as its a
Strong key level we will
Be expecting a local
Pullback and a move down
Sell!
Comment and subscribe to help us grow!
Check out other forecasts below too!
Disclosure: I am part of Trade Nation's Influencer program and receive a monthly fee for using their TradingView charts in my analysis.
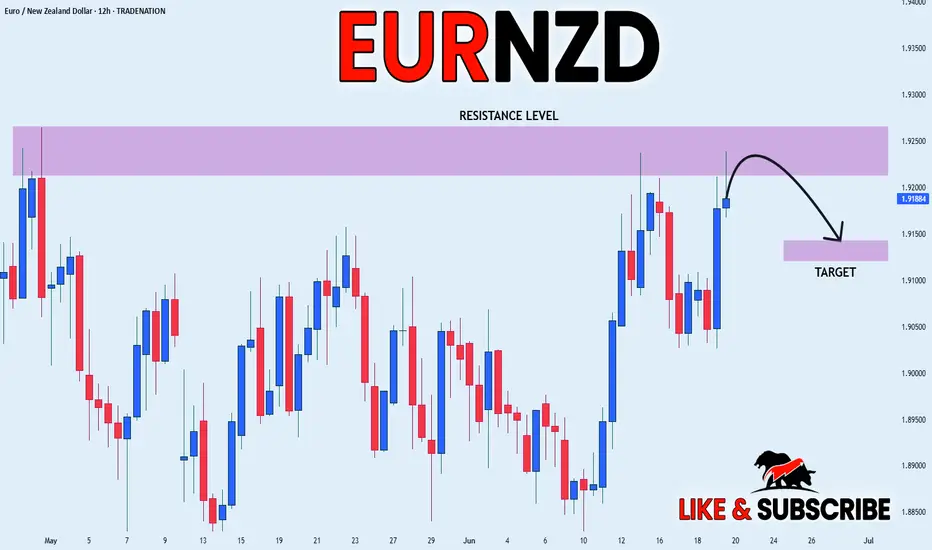
EUR_NZD SHORT FROM RESISTANCE|
✅EUR_NZD is going up now
But a strong resistance level is ahead at 1.9266
Thus I am expecting a pullback
And a move down towards the target of 1.9150
SHORT🔥
✅Like and subscribe to never miss a new idea!✅
Disclosure: I am part of Trade Nation's Influencer program and receive a monthly fee for using their TradingView charts in my analysis.