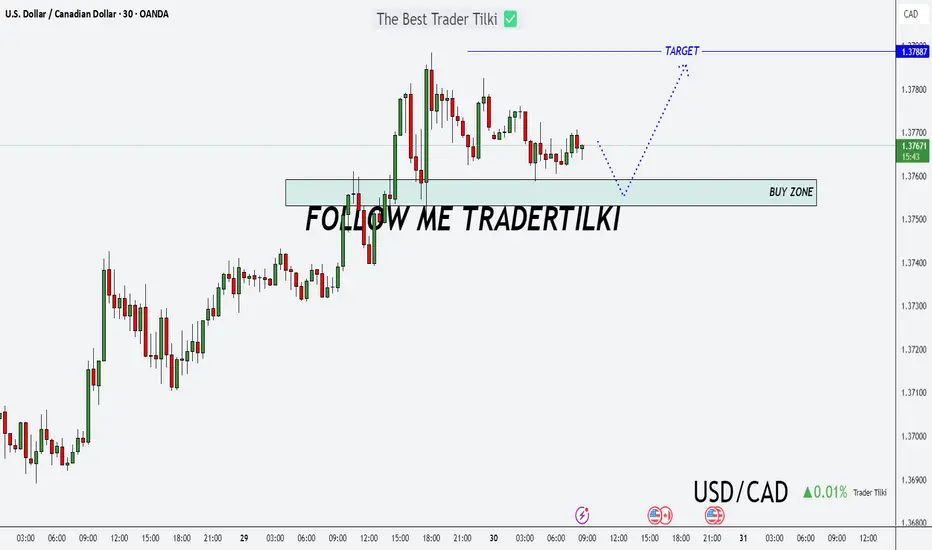
A New Day, A New Opportunity: USDCAD Buy StrategyGood morning Traders,
USDCAD has reached a key support zone between 1.37531 and 1.37592.
I'm opening a buy position from this level, aiming for the 1.37887 target.
Feel free to adjust your stop-loss based on your own margin and risk tolerance.
Your likes are my biggest source of motivation when sharing analysis. Thanks to everyone who supports with a simple like!
SMC
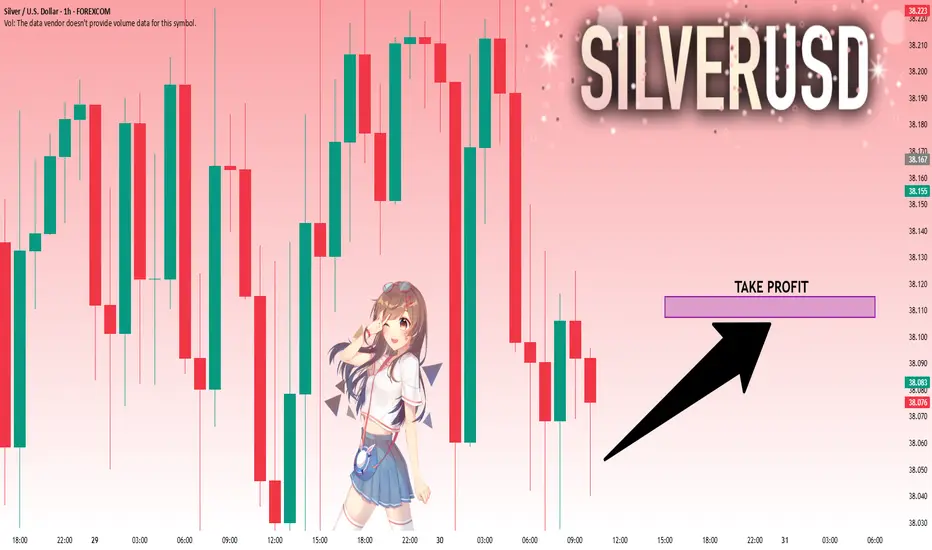
SILVER: Move Up Expected! Long!
My dear friends,
Today we will analyse SILVER together☺️
The recent price action suggests a shift in mid-term momentum. A break above the current local range around 38.054 will confirm the new direction upwards with the target being the next key level of 38.107 and a reconvened placement of a stop-loss beyond the range.
❤️Sending you lots of Love and Hugs❤️
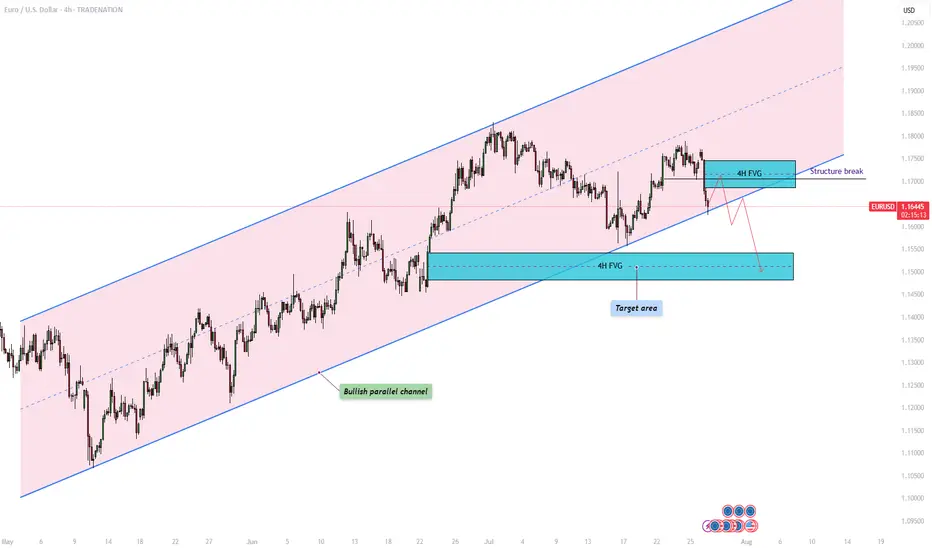
EURUSD – Will the bullish parallel channel hold?The EUR/USD currency pair is currently trading within a clearly defined bullish parallel channel, as shown on the 4-hour chart. This channel has provided consistent directional structure over recent weeks, with price respecting both its upper resistance and lower support boundaries. At present, the pair is approaching the lower end of this channel, raising the critical question: will it bounce off support and continue the bullish trajectory, or will it decisively break down, opening the door to lower price targets?
Bullish parallel channel
On the 4-hour timeframe, the EUR/USD has been consistently moving within a bullish parallel channel, characterized by higher highs and higher lows. This price structure suggests sustained upward momentum, with the top of the channel acting as dynamic resistance and the bottom as reliable support. Today, price action is testing the lower boundary of the channel once again. A successful hold at this level could confirm continued bullish structure and open the door for a potential rebound.
Bullish scenario
In the bullish scenario, the EUR/USD holds its ground at the support region around 1.164, where the lower boundary of the channel intersects with price. For upward continuation, it must overcome the short-term resistance posed by the 4-hour Fair Value Gap (FVG) between 1.169 and 1.174. A reclaim and close above this zone could signal a shift in short-term momentum and lead to a move back toward the upper boundary of the channel. However, the path upward is not without resistance , price must navigate through potential supply zones and maintain higher lows to preserve the bullish structure.
Bearish scenario
On the other hand, a break and close below the channel support could indicate a change in market sentiment and invalidate the bullish pattern. In this bearish case, we would expect a structure break confirmation followed by a possible retest of the broken trendline and the 4-hour FVG. If this retest fails to reclaim the trendline, bearish continuation becomes more likely. The next significant area of interest lies around the 1.150 level, where a bullish 4-hour FVG exists. This zone could act as a potential short-term support and serve as a target for the downside move before any meaningful bounce occurs.
Final thoughts
The EUR/USD pair is currently at a technical crossroads. Traders should watch closely for price behavior around the lower channel boundary to determine whether bullish momentum will resume or whether a bearish breakout will set the tone for deeper retracement. Confirmation, either through a bounce or a breakdown with a retest, will be key in validating the next directional move.
-------------------------
Disclosure: I am part of Trade Nation's Influencer program and receive a monthly fee for using their TradingView charts in my analysis.
Thanks for your support. If you enjoyed this analysis, make sure to follow me so you don't miss the next one. And if you found it helpful, feel free to drop a like 👍 and leave a comment 💬, I’d love to hear your thoughts!
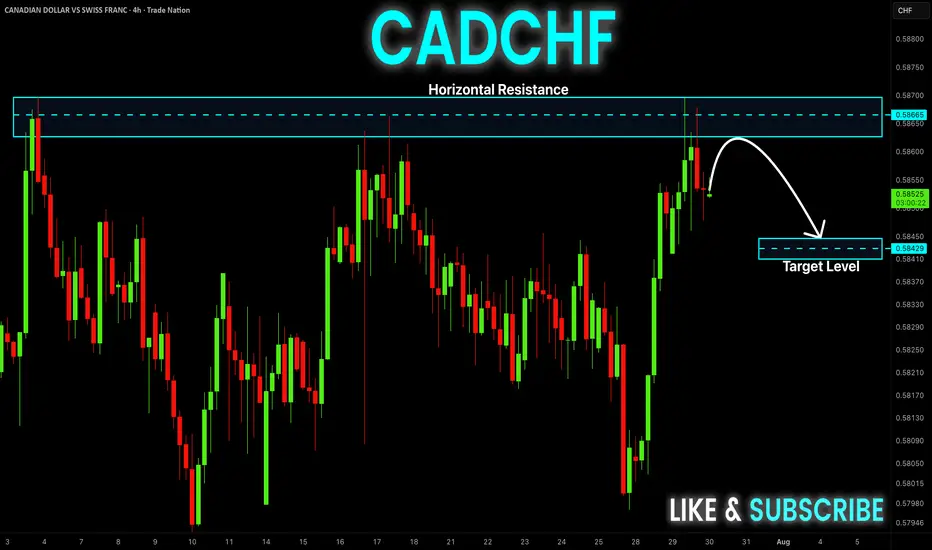
CAD-CHF Local Short! Sell!
Hello,Traders!
CAD-CHF went up and
Made a retest of the
Horizontal resistance
Around 0.5870 and we
Are already seeing a bearish
Pullback so we will be
Expecting a further
Bearish correction
Sell!
Comment and subscribe to help us grow!
Check out other forecasts below too!
Disclosure: I am part of Trade Nation's Influencer program and receive a monthly fee for using their TradingView charts in my analysis.
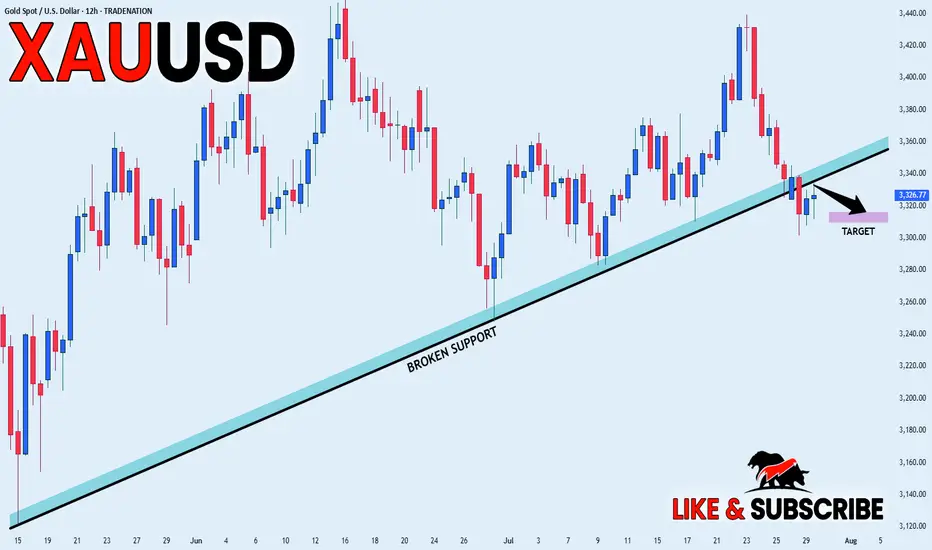
GOLD BEARISH BIAS|SHORT|
✅GOLD broke the rising
Support line which is now
A resistance and the price
Is retesting the line now so
We are locally bearish biased
And we will be expecting a
Local move down
SHORT🔥
✅Like and subscribe to never miss a new idea!✅
Disclosure: I am part of Trade Nation's Influencer program and receive a monthly fee for using their TradingView charts in my analysis.
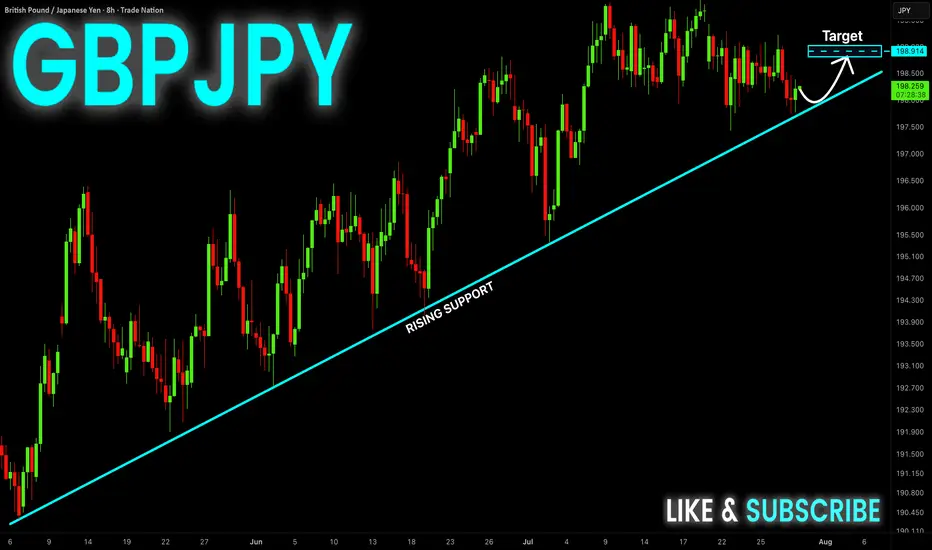
GBP-JPY Rising Support! Buy!
Hello,Traders!
GBP-JPY is trading in an
Uptrend and the pair made
A retest of the rising support
And we are seeing a local
Bullish rebound and we will
Be expecting a further
Local move up
Buy!
Comment and subscribe to help us grow!
Check out other forecasts below too!
Disclosure: I am part of Trade Nation's Influencer program and receive a monthly fee for using their TradingView charts in my analysis.
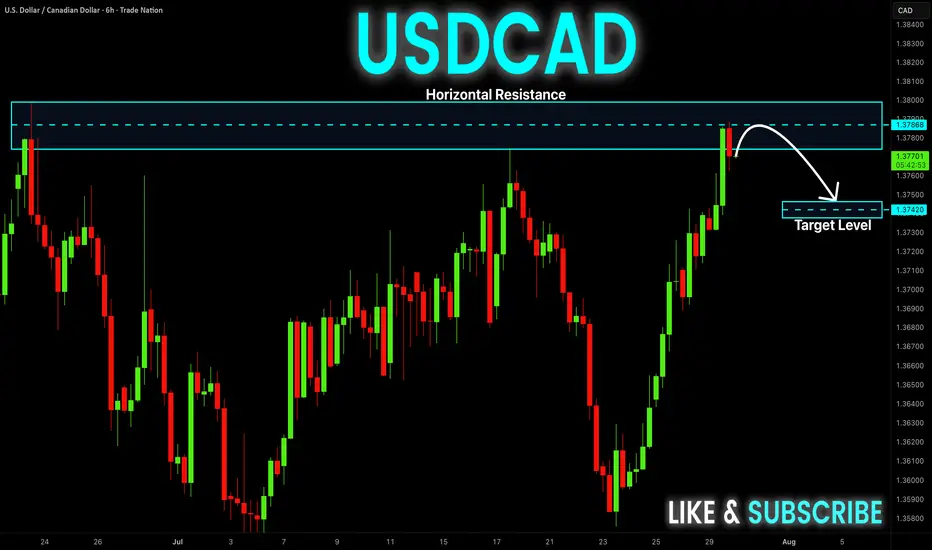
USD-CAD Short From Resistance! Sell!
Hello,Traders!
USD-CAD went up and
Retested a horizontal
Resistance of 1.3800
From where we are
Already seeing a local
Bearish pullback and
As we are locally bearish
Biased so we will be
Expecting a local move down
Sell!
Comment and subscribe to help us grow!
Check out other forecasts below too!
Disclosure: I am part of Trade Nation's Influencer program and receive a monthly fee for using their TradingView charts in my analysis.
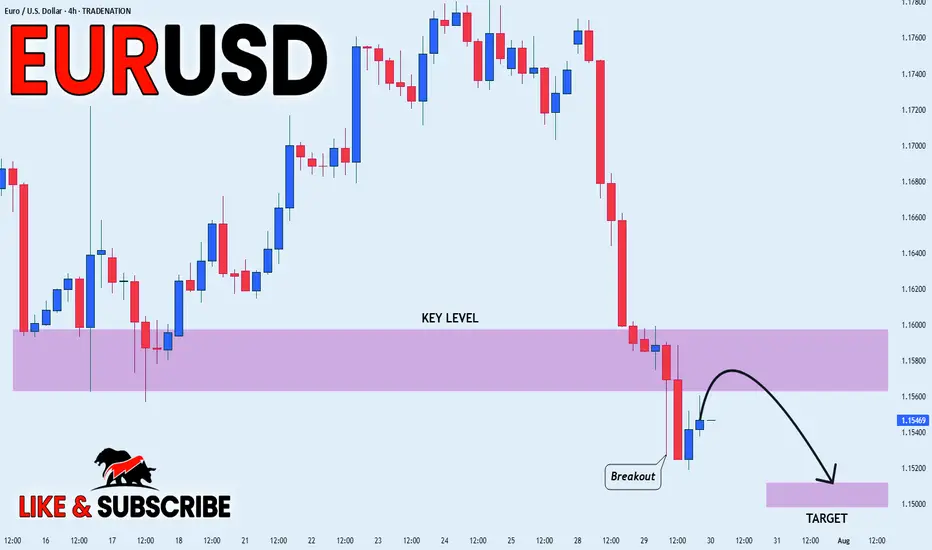
EUR_USD BEARISH BREAKOUT|SHORT|
✅EUR_USD broke the key
Structure level of 1.1580
While trading in an local downtrend
Which makes me bearish
And I think that after the retest of
The broken level is complete
A bearish continuation will follow
SHORT🔥
✅Like and subscribe to never miss a new idea!✅
Disclosure: I am part of Trade Nation's Influencer program and receive a monthly fee for using their TradingView charts in my analysis.
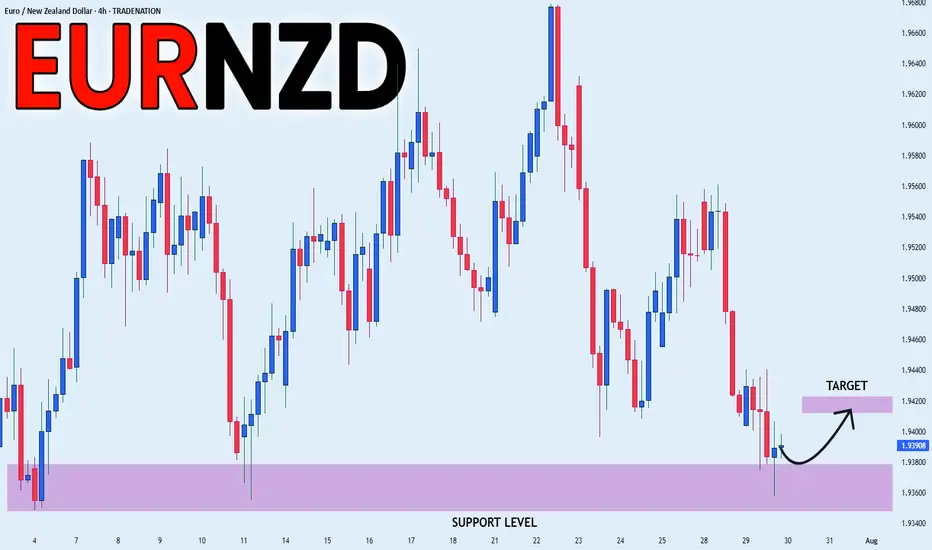
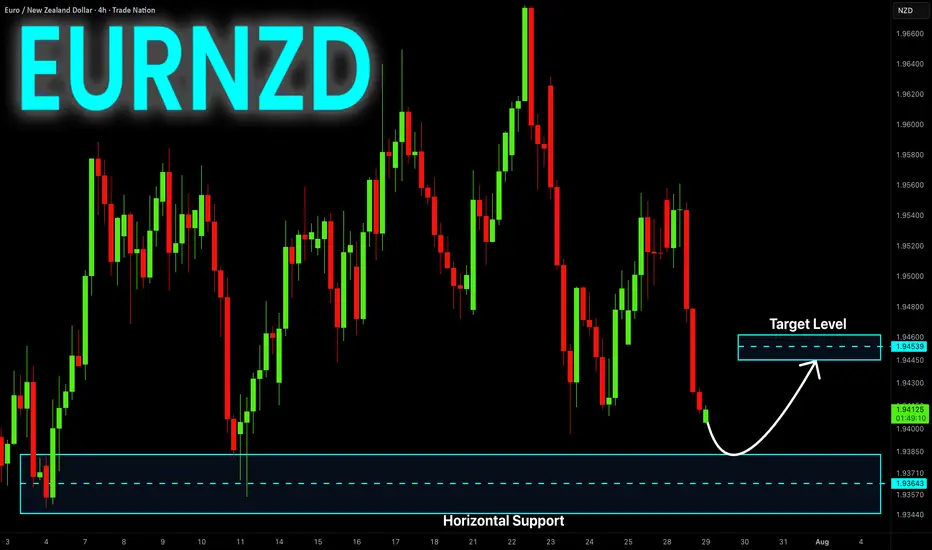
EUR_NZD REBOUND AHEAD|LONG|
✅EUR_NZD fell again to retest the support of 1.9380
But it is a strong key level
So I think that there is a high chance
That we will see a bullish rebound and a move up
LONG🚀
✅Like and subscribe to never miss a new idea!✅
Disclosure: I am part of Trade Nation's Influencer program and receive a monthly fee for using their TradingView charts in my analysis.
XAUUSD Monthly Technical OutlookMarket Structure Overview:
• The chart reveals consistent Breaks of Structure (BOS) to the upside, confirming a strong bullish market trend.
• Price has successfully reclaimed and retested the strong resistance zone (~3390–3400), which now acts as new support.
• A series of higher highs and higher lows show clear bullish intent, supported by sustained bullish momentum after each correction.
⸻
📈 Volume & Price Action:
• The Volume Profile (VRVP) on the left shows strong historical accumulation near the current breakout zone.
• After the breakout from resistance, the price retested this zone—validating it as support—and is expected to continue its bullish leg toward $3,500, the next psychological and technical target.
⸻
📍 Key Levels:
• Support Zone: $3,375 – $3,390 (previous resistance turned support)
• Immediate Resistance: $3,425
• Target Level: $3,500 (Monthly High Projection)
⸻
📘 Educational Note:
• This setup aligns with classic market structure theory: BOS + Retest + Continuation.
• The pullback into the breakout zone is a textbook bullish continuation signal often used in institutional trading strategies.
• Traders watching this pattern should combine it with confirmation entries such as bullish engulfing candles, FVGs, or order block rejections for safer entries.
⸻
🎯 Projection:
• As long as the price holds above $3,375, the bullish scenario toward $3,500 remains valid.
• Expect possible consolidation or minor pullbacks before continuation.
⸻
📌 Disclaimer:
This analysis is for educational purposes only and does not constitute financial advice. Always do your own research before entering the market.

DAX: Local Bearish Bias! Short!
My dear friends,
Today we will analyse DAX together☺️
The in-trend continuation seems likely as the current long-term trend appears to be strong, and price is holding below a key level of 24,252.78 So a bearish continuation seems plausible, targeting the next low. We should enter on confirmation, and place a stop-loss beyond the recent swing level.
❤️Sending you lots of Love and Hugs❤️

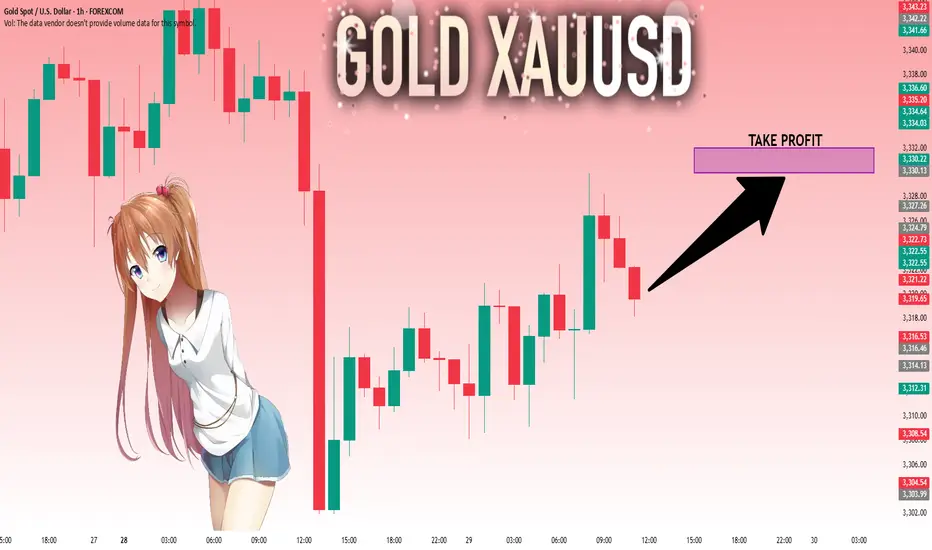
GOLD: Strong Growth Ahead! Long!
My dear friends,
Today we will analyse GOLD together☺️
The market is at an inflection zone and price has now reached an area around 3,321.22 where previous reversals or breakouts have occurred.And a price reaction that we are seeing on multiple timeframes here could signal the next move up so we can enter on confirmation, and target the next key level of 3,329.97.Stop-loss is recommended beyond the inflection zone.
❤️Sending you lots of Love and Hugs❤️
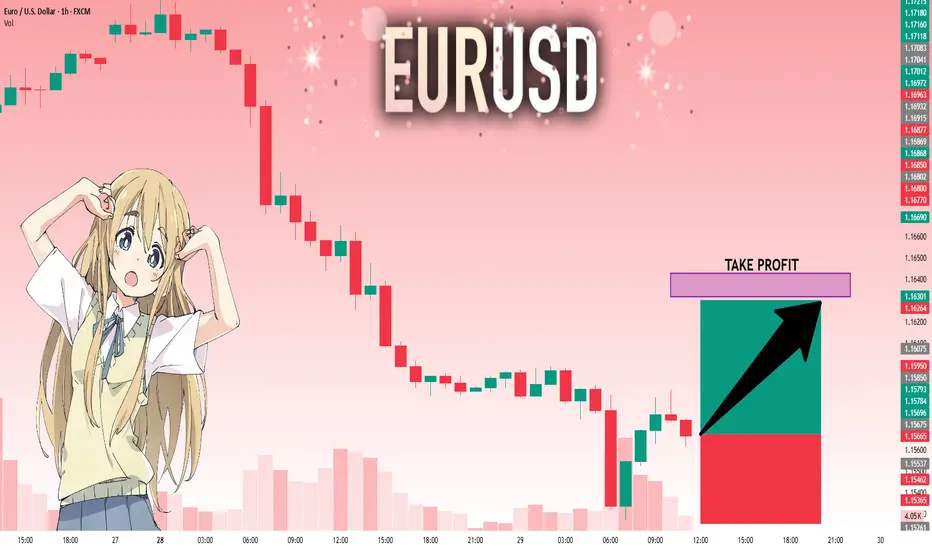
EURUSD: Will Go Up! Long!
My dear friends,
Today we will analyse EURUSD together☺️
The price is near a wide key level
and the pair is approaching a significant decision level of 1.15675 Therefore, a strong bullish reaction here could determine the next move up.We will watch for a confirmation candle, and then target the next key level of 1.16318.Recommend Stop-loss is beyond the current level.
❤️Sending you lots of Love and Hugs❤️
SILVER: The Market Is Looking Down! Short!
My dear friends,
Today we will analyse SILVER together☺️
The recent price action suggests a shift in mid-term momentum. A break below the current local range around 38.167 will confirm the new direction downwards with the target being the next key level of 37.976 .and a reconvened placement of a stop-loss beyond the range.
❤️Sending you lots of Love and Hugs❤️

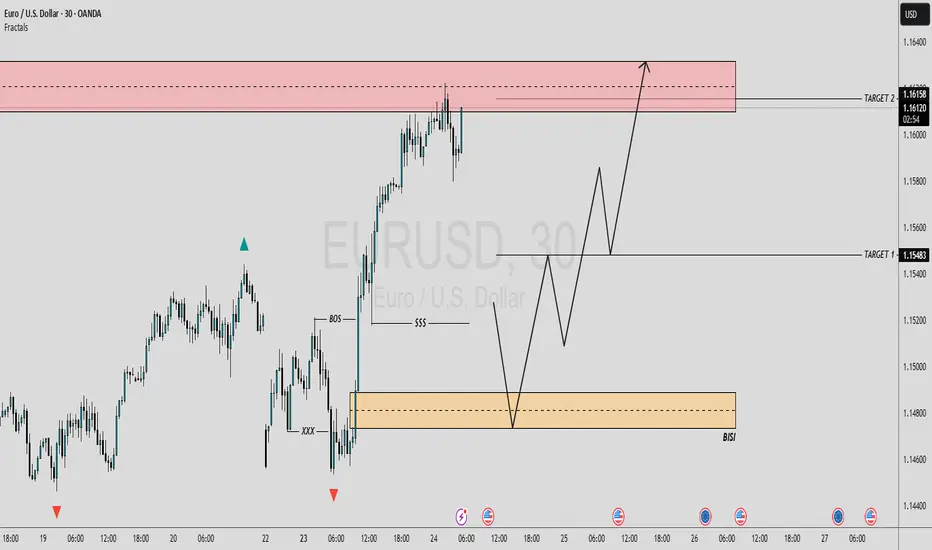
EUR/USD 30-MIN ANALYSISThis EURUSD setup showcases a clean bullish continuation scenario following a confirmed Break of Structure (BOS) and a sharp rally driven by momentum and liquidity imbalance.
After sweeping a key low (XXX), price impulsively broke structure to the upside, confirming a potential shift in market intent. A retracement is now expected to mitigate the Buy-Side Imbalance (BISI) zone.
BOS & SSS (Short-Term Structural Shift): Confirmed bullish intent.
Imbalance (BISI): Price left behind an unfilled imbalance zone a likely magnet for a pullback.
Re-Entry Zone: (BISI) provides a high probability area for long re-entry.
Upside Targets:
Target 1: 1.15483 – intermediate structural level.
Target 2: 1.16158 – premium supply / liquidity target.
#EURUSD 30M Technical Analysis Expected Move.
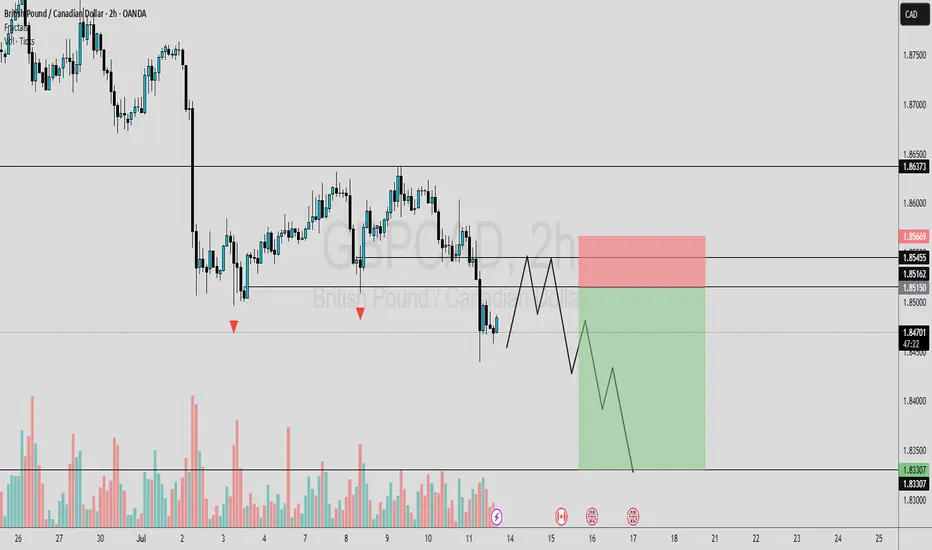
GBPCAD OUTLOOKIn this analysis we're focusing on 2H time frame for finding possible upcoming movement in price. So as per my strategy today I'm looking for a sell trade opportunity. Confirmation is very important, after confirmation we'll execute our trade. Let's see which opportunity market will give us.
Always use stoploss for your trade.
Always use proper money management and proper risk to reward ratio.
This is my prediction.
#GBPCAD 1H Technical Analysis Expected Move.
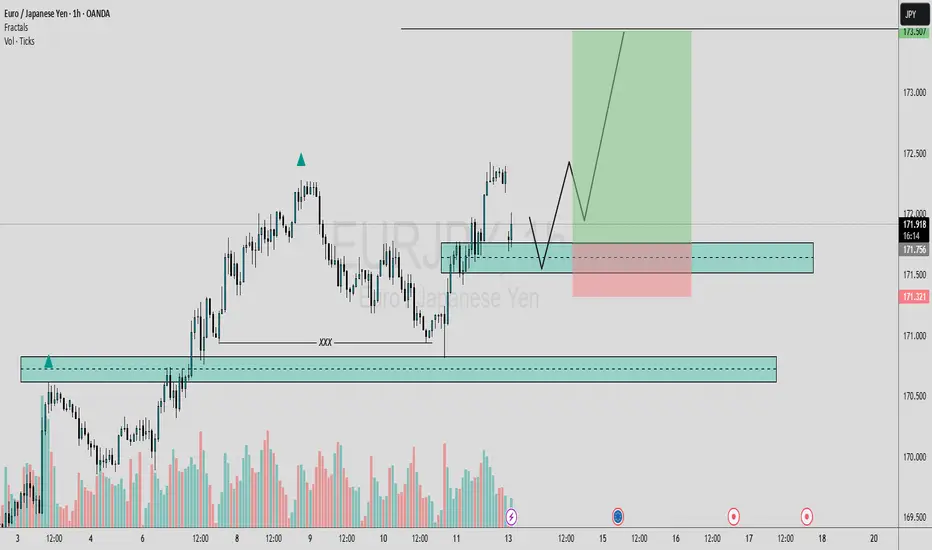
EURJPY POSSIBLE EXPECTED MOVEIn this analysis we're focusing on 1H time frame. Today I'm looking for a potential buy move from my marked key levels. This is a higher time frame analysis. Let's analyze more deeply into smaller timeframe and potential outcomes. Confirmation is very important.
Always use stoploss for your trade.
Always use proper money management and proper risk to reward ratio.
This is my analysis.
#EURJPY 1H Technical Analysis Expected Move.
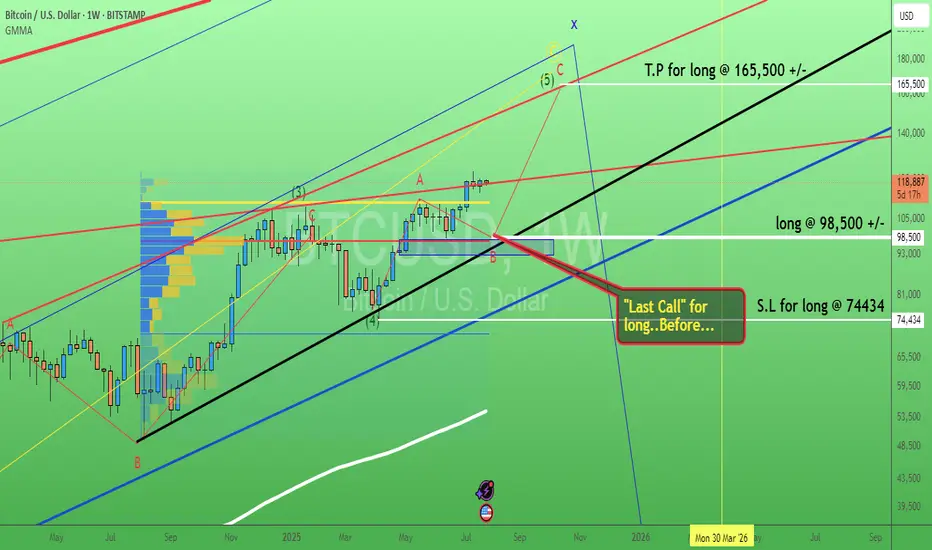
Bitcoin. Last call buy level? 29/July/25BTCUSD probably will have pullback toward confluence zone of 1) Trendline Support 2) Order Block 3) POC of volume before hitting ATH again
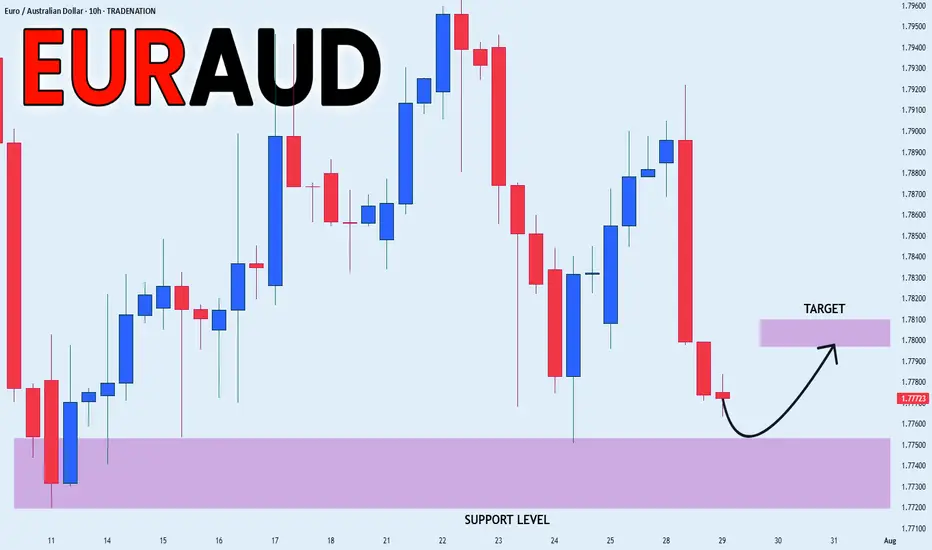
EUR_AUD LOCAL GROWTH AHEAD|LONG|
✅EUR_AUD will soon retest a key support level of 1.7750
So I think that the pair will make a rebound
And go up to retest the supply level above at 1.7800
LONG🚀
✅Like and subscribe to never miss a new idea!✅
Disclosure: I am part of Trade Nation's Influencer program and receive a monthly fee for using their TradingView charts in my analysis.
EUR-NZD Will Grow! Buy!
Hello,Traders!
EUR-NZD keeps falling
Down and we are bearish
Biased mid-term but there is
A horizontal support level
Below at 1.9370 so after
The retest we might expect
A local bullish correction
Buy!
Comment and subscribe to help us grow!
Check out other forecasts below too!
Disclosure: I am part of Trade Nation's Influencer program and receive a monthly fee for using their TradingView charts in my analysis.
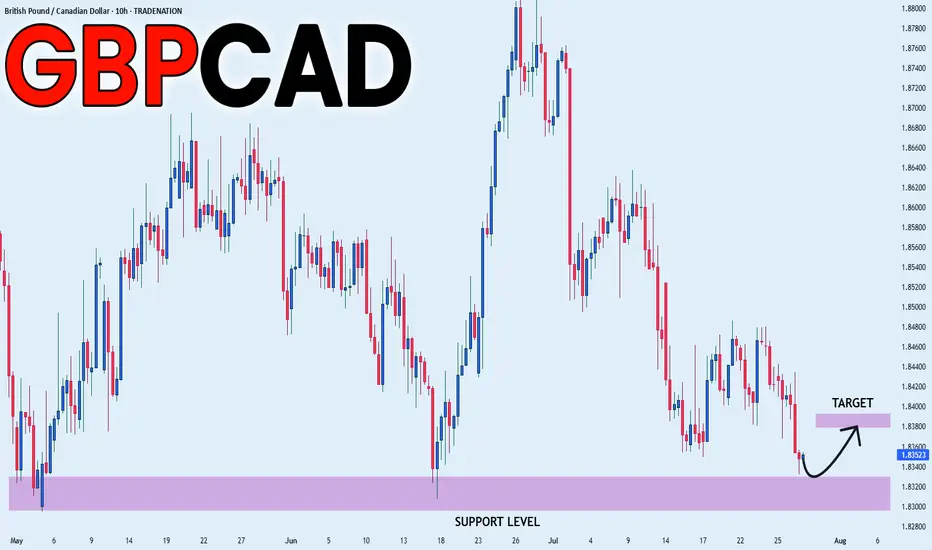
GBP_CAD RISKY SETUP|LONG|
✅GBP_CAD is going down to retest
A horizontal support of 1.8320
Which makes me locally bullish biased
And I think that we will see a rebound
And a move up from the level
Towards the target above at 1.8380
LONG🚀
✅Like and subscribe to never miss a new idea!✅
Disclosure: I am part of Trade Nation's Influencer program and receive a monthly fee for using their TradingView charts in my analysis.
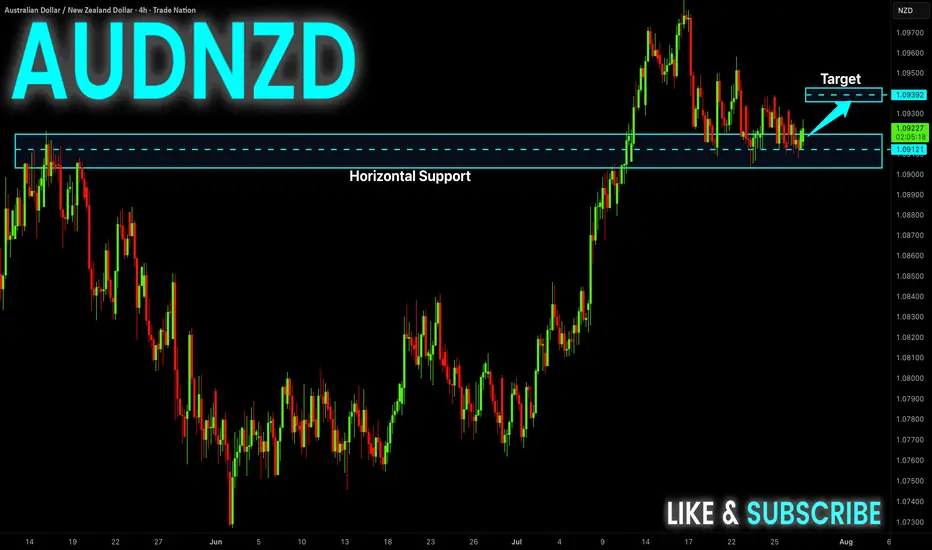
AUD-NZD Rebound Ahead! Buy!
Hello,Traders!
AUD-NZD made a retest
Of the wide horizontal support
Level again at 1.0909 and we
Are already seeing a bullish
Reaction so a local bullish
Rebound can be expected
Buy!
Comment and subscribe to help us grow!
Check out other forecasts below too!
Disclosure: I am part of Trade Nation's Influencer program and receive a monthly fee for using their TradingView charts in my analysis.
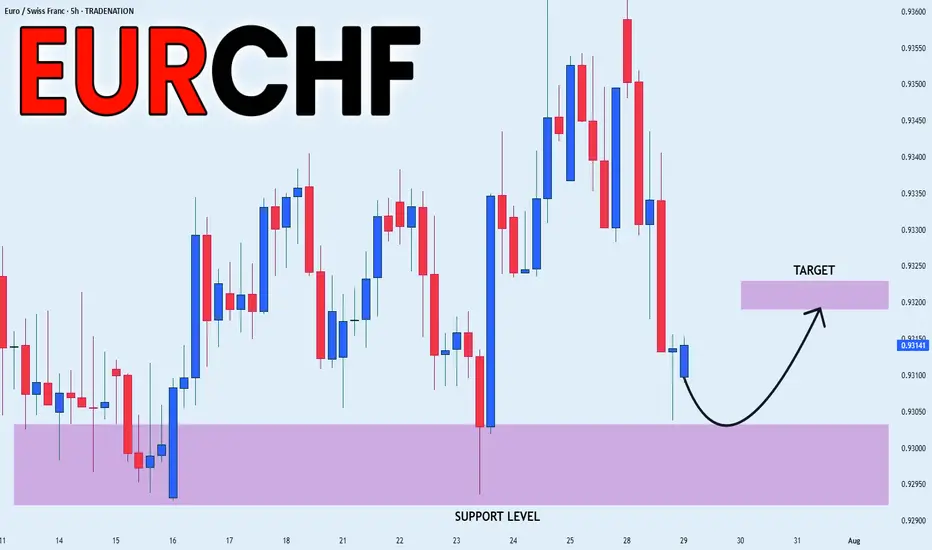
EUR_CHF RISKY LONG|
✅EUR_CHF is set to retest a
Strong support level below at 0.9300
After trading in a local downtrend for some time
Which makes a bullish rebound a likely scenario
With the target being a local resistance above at 0.9320
LONG🚀
✅Like and subscribe to never miss a new idea!✅
Disclosure: I am part of Trade Nation's Influencer program and receive a monthly fee for using their TradingView charts in my analysis.