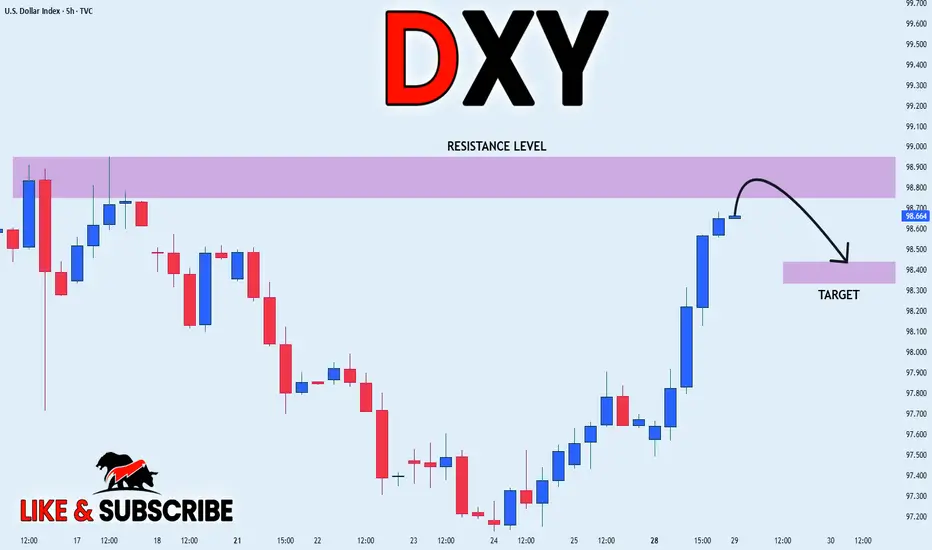
DXY LOCAL SHORT|
✅DXY is going up now
But a strong resistance level is ahead at 98.948
Thus I am expecting a pullback
And a move down towards the target of 98.451
SHORT🔥
✅Like and subscribe to never miss a new idea!✅
Disclosure: I am part of Trade Nation's Influencer program and receive a monthly fee for using their TradingView charts in my analysis.
SMC
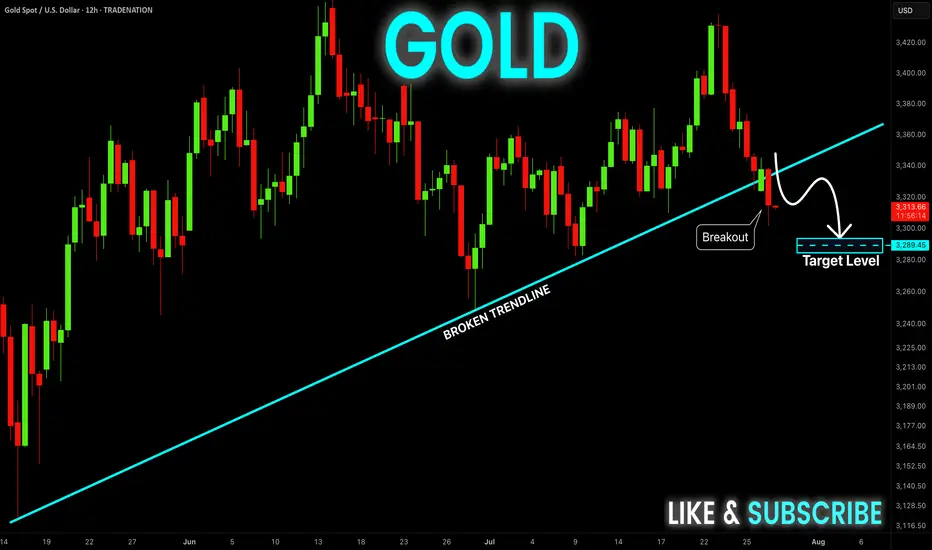
GOLD Epic Trendline Breakout! Sell!
Hello,Traders!
GOLD was trading along
A long-term trend-line but
It is broken now and the
Breakout is confirmed so
We are bearish biased now
And we will be expecting a
Further bearish move down
Sell!
Comment and subscribe to help us grow!
Check out other forecasts below too!
Disclosure: I am part of Trade Nation's Influencer program and receive a monthly fee for using their TradingView charts in my analysis.
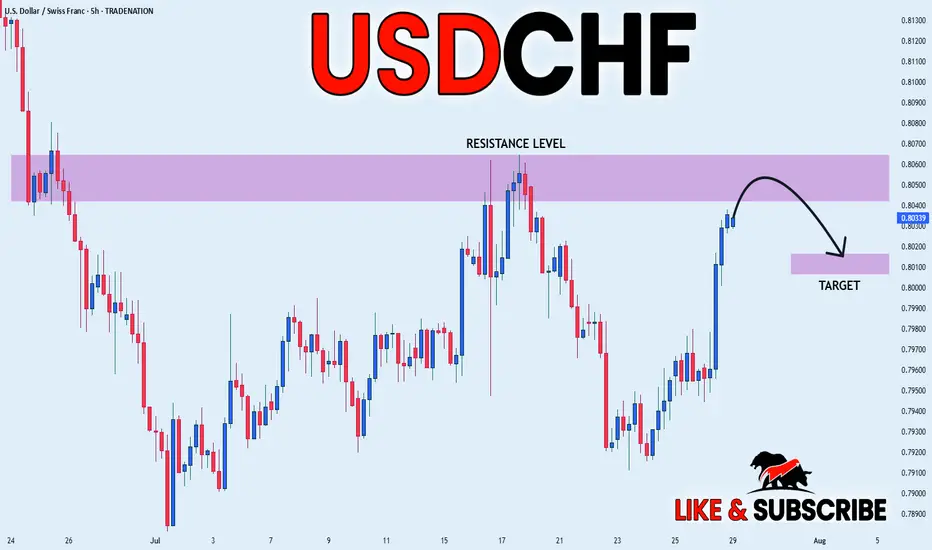
USD_CHF SHORT FROM RESISTANCE|
✅USD_CHF has been growing recently
And the pair seems locally overbought
So as the pair is approaching
A horizontal resistance of 0.8064
Price decline is to be expected
SHORT🔥
✅Like and subscribe to never miss a new idea!✅
Disclosure: I am part of Trade Nation's Influencer program and receive a monthly fee for using their TradingView charts in my analysis.
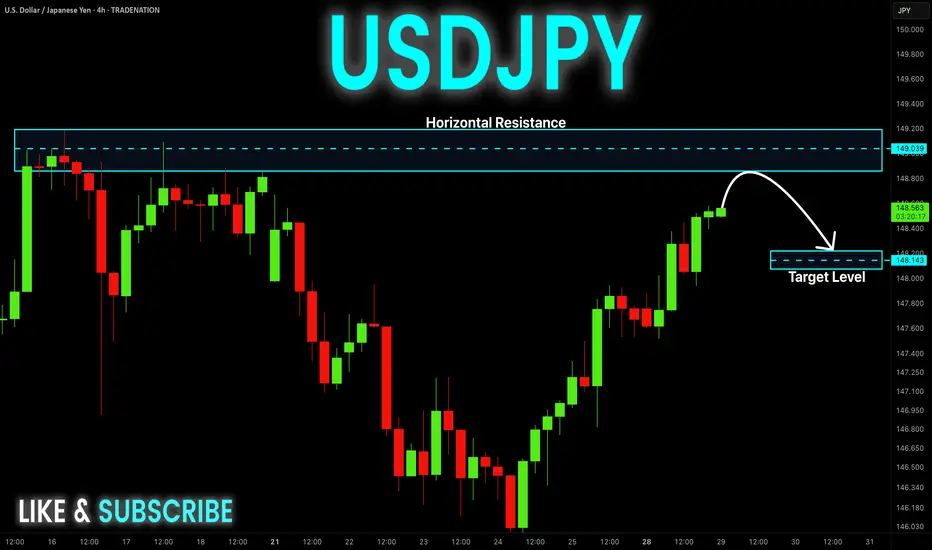
USD-JPY Is Overbought! Sell!
Hello,Traders!
USD-JPY is trading in a
Strong uptrend and the pair
Will soon hit a horizontal
Resistance of 149.200
So after the retest a
Local bearish pullback
Is to be expected
Sell!
Comment and subscribe to help us grow!
Check out other forecasts below too!
Disclosure: I am part of Trade Nation's Influencer program and receive a monthly fee for using their TradingView charts in my analysis.
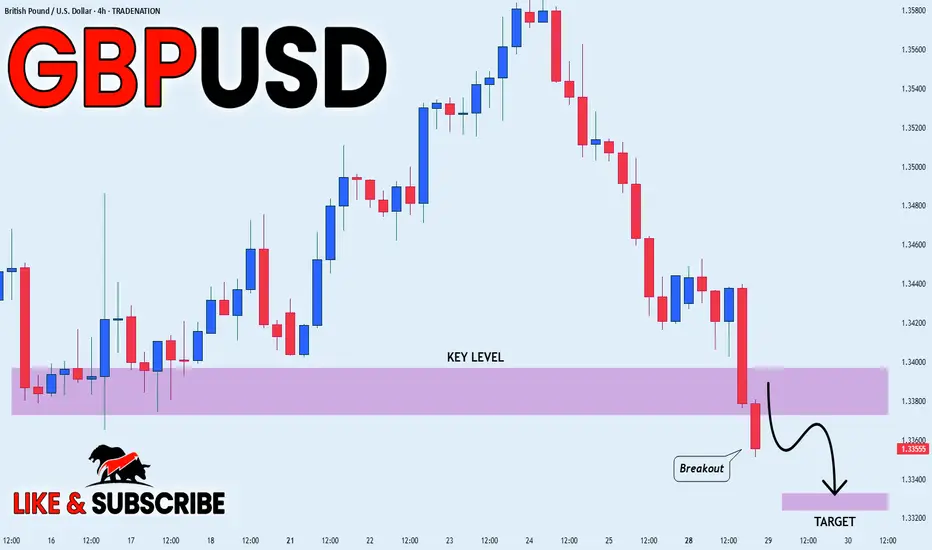
GBP_USD BEARISH BREAKOUT|SHORT|
✅GBP_USD is going down currently
As the pair broke the key structure level of 1.3380
Which is now a resistance, and after the pullback
And retest, I think the price will go further down
SHORT🔥
✅Like and subscribe to never miss a new idea!✅
Disclosure: I am part of Trade Nation's Influencer program and receive a monthly fee for using their TradingView charts in my analysis.
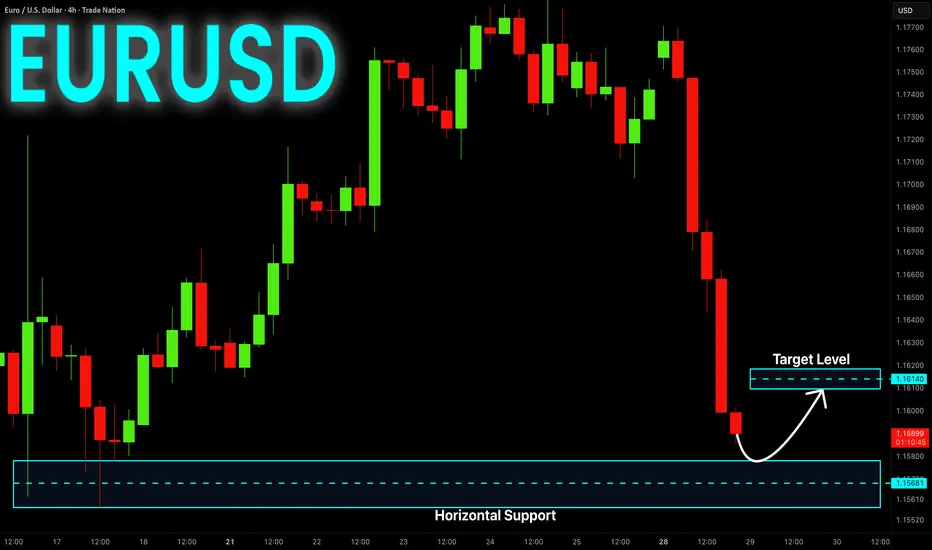
EUR-USD Support Ahead! Buy!
Hello,Traders!
EUR-USD is making a massive
Bearish correction and the pair
Is already locally oversold
So after it hits a horizontal
Support level below at 1.1568
We will be expecting a local
Bullish rebound
Buy!
Comment and subscribe to help us grow!
Check out other forecasts below too!
Disclosure: I am part of Trade Nation's Influencer program and receive a monthly fee for using their TradingView charts in my analysis.
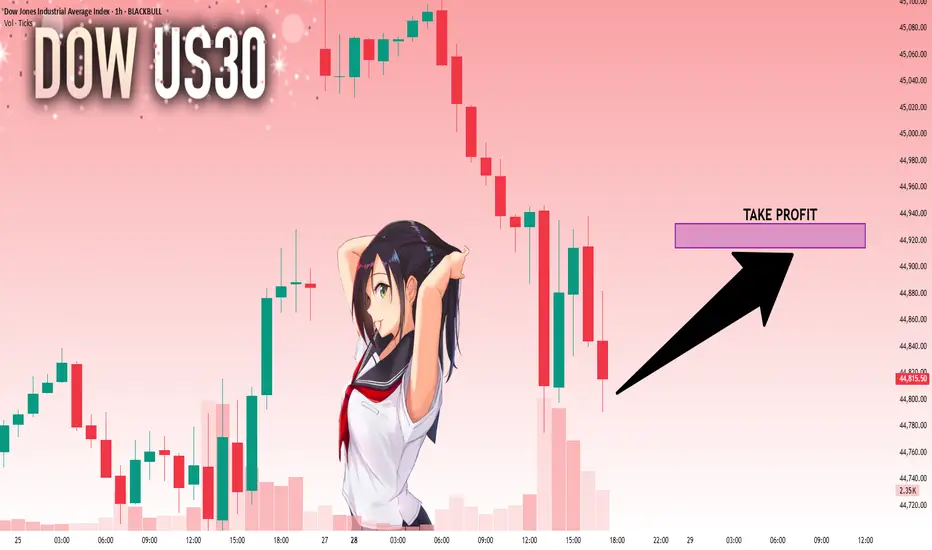
US30: : Local Bullish Bias! Long!
My dear friends,
Today we will analyse US30 together☺️
The recent price action suggests a shift in mid-term momentum. A break above the current local range around 44,802.50 will confirm the new direction upwards with the target being the next key level of 44,914.32 and a reconvened placement of a stop-loss beyond the range.
❤️Sending you lots of Love and Hugs❤️
SILVER: Strong Growth Ahead! Long!
My dear friends,
Today we will analyse SILVER together☺️
The in-trend continuation seems likely as the current long-term trend appears to be strong, and price is holding above a key level of 38.099 So a bullish continuation seems plausible, targeting the next high. We should enter on confirmation, and place a stop-loss beyond the recent swing level.
❤️Sending you lots of Love and Hugs❤️

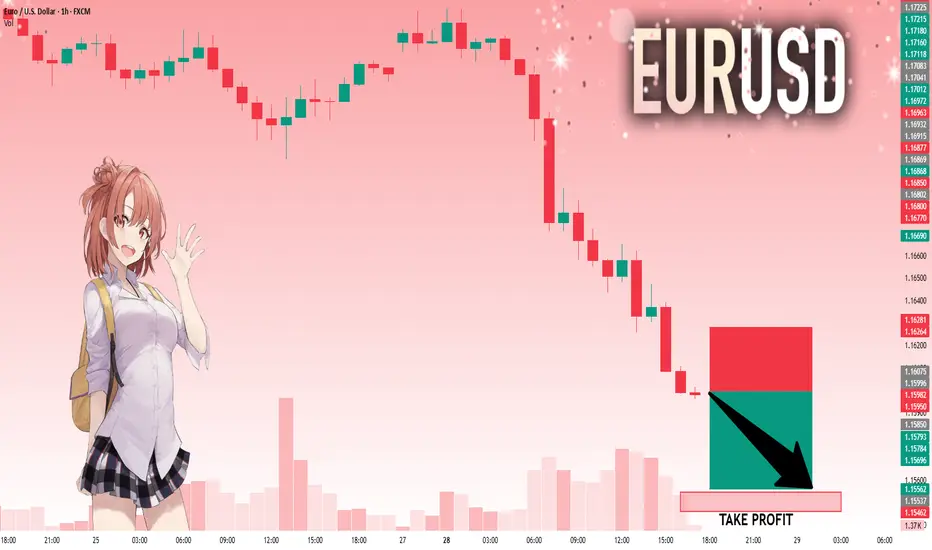
EURUSD: Will Go Down! Short!
My dear friends,
Today we will analyse EURUSD together☺️
The market is at an inflection zone and price has now reached an area around 1.15996 where previous reversals or breakouts have occurred.And a price reaction that we are seeing on multiple timeframes here could signal the next move down so we can enter on confirmation, and target the next key level of 1.15562..Stop-loss is recommended beyond the inflection zone.
❤️Sending you lots of Love and Hugs❤️
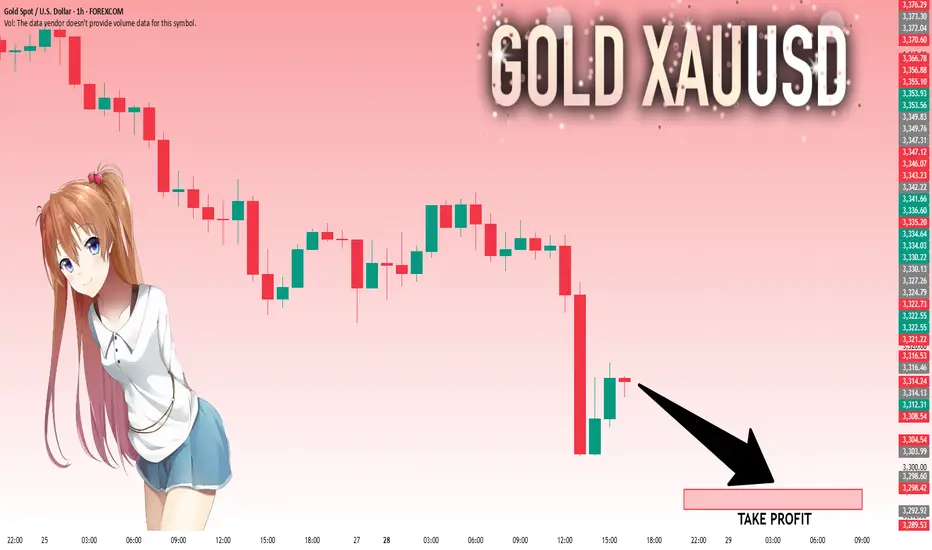
GOLD: The Market Is Looking Down! Short!
My dear friends,
Today we will analyse GOLD together☺️
The price is near a wide key level
and the pair is approaching a significant decision level of 3,313.85 Therefore, a strong bearish reaction here could determine the next move down.We will watch for a confirmation candle, and then target the next key level of 3,298.60..Recommend Stop-loss is beyond the current level.
❤️Sending you lots of Love and Hugs❤️
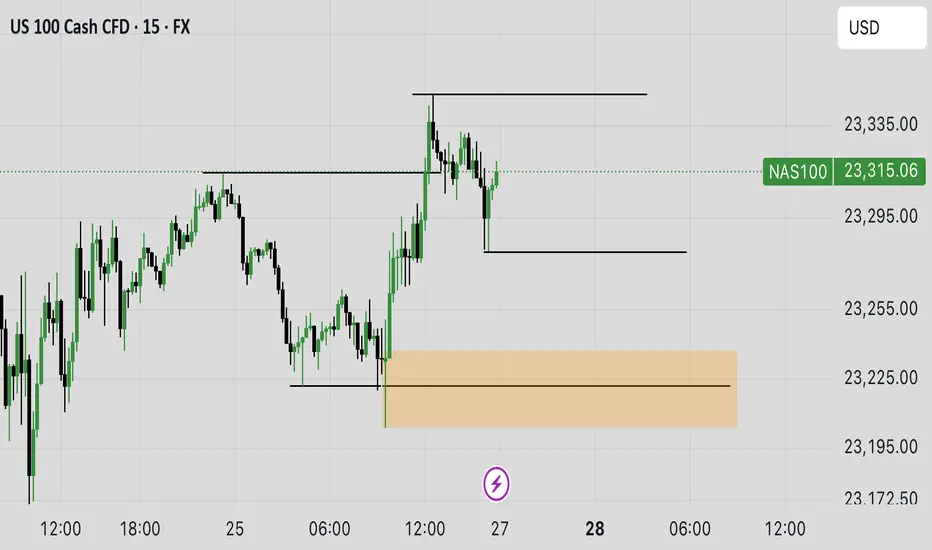
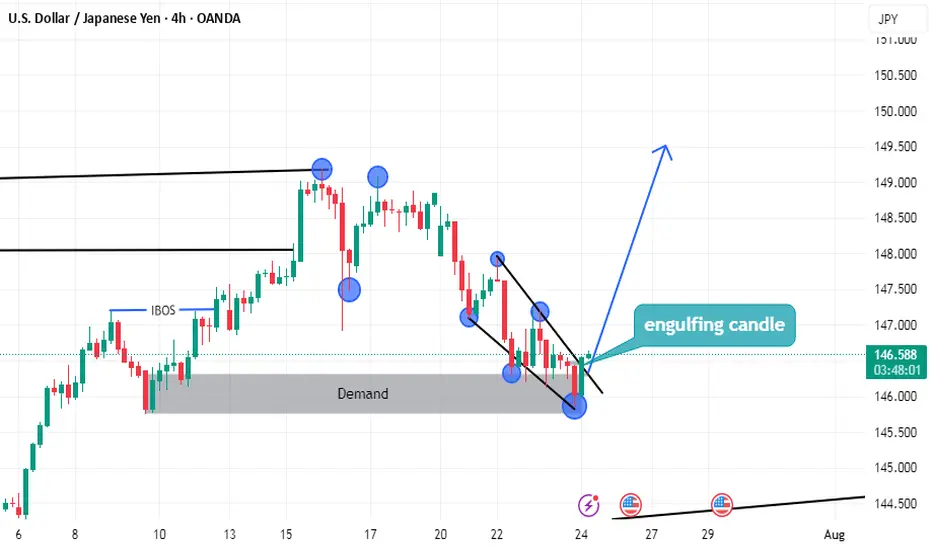
USDJPY LONG setupsimply
we have demand
and the price can't lower low
end we have break of structure on low time frame
and we have more but i don't have enough time to tell you
Look the photo well
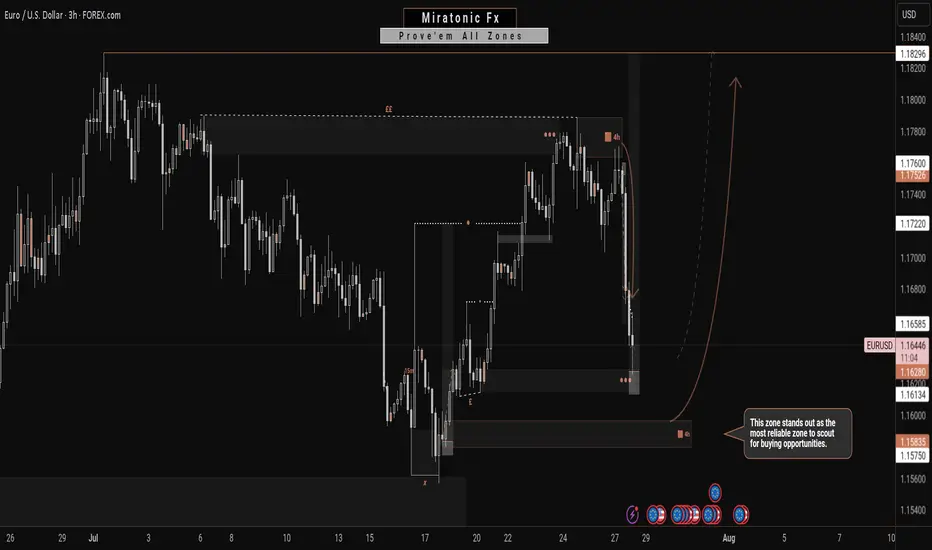
Potentially, A Safer Way To Long The EURUSDIn contrast to my previous outlook, the current price action suggests an increased probability of a deeper bearish move—potentially invalidating the buy zone marked out in the previous analysis. This sudden change is largely driven by the prospect of untapped liquidity residing beneath that zone, reinforcing the well-known market principle that price seeks out liquidity before committing to directional moves.
Given this development, the newly identified zone on the chart emerges as a more technically sound and reliable area from which to anticipate bullish interest. It aligns better with the broader liquidity profile and offers a stronger base for accumulation. Traders may opt to wait for confirmations within this zone or, depending on their risk appetite, consider executing buy positions upon price entry.
As always, patience and clarity are key as we allow price to reveal its intention.
Fingers crossed 🤞
Wishing you all a focused and profitable trading week.
Catch you on the next one. 🫡
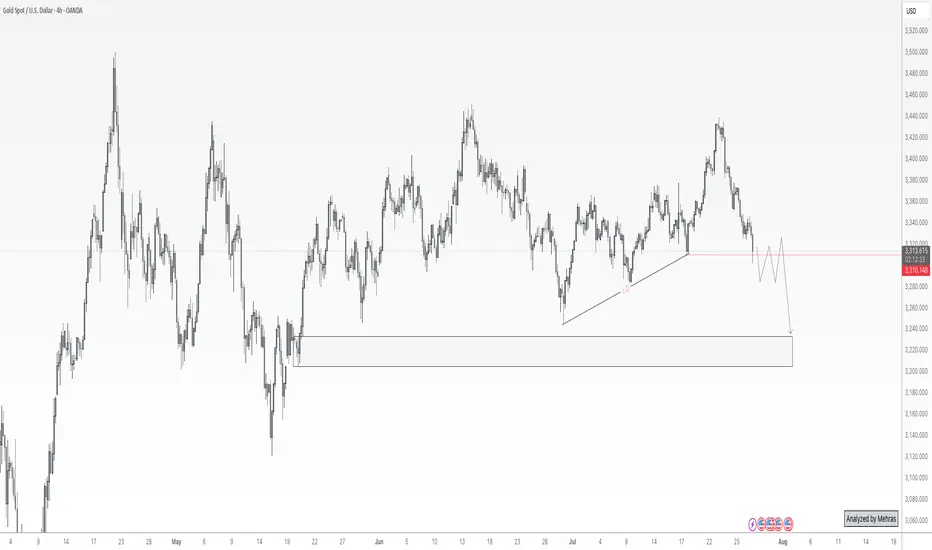
Gold at a Crossroads: $100 Drop Ahead or New All-Time High?Gold is now sitting at a critical decision zone near the $3300 level — a key bank-level area. If we see a daily candle close below this level, I anticipate a minimum drop of 1,000 pips, with the first major support around the $3220–$3200 range. The $3200 level is extremely significant, and I’ll discuss its importance more in future updates if necessary.
On the flip side, if buyers step in and we get a daily close above $3300, I still believe it’s too early to jump into longs. The selling pressure remains quite obvious, and we’ve already seen multiple failed attempts to push beyond this level toward the $3500 all-time high. That tells me the orders at this level might be exhausted.
Personally, I’ll only consider a long position if we get at least a clean 4-hour candle close above $3350.
It’s going to be an exciting week ahead with high-impact data releases including ADP, Core PCE, the Federal Funds Rate — and most importantly, Friday’s NFP.
📌 Stay tuned for updates throughout the week!
Disclaimer: This is not financial advice. Just my personal opinion!!!
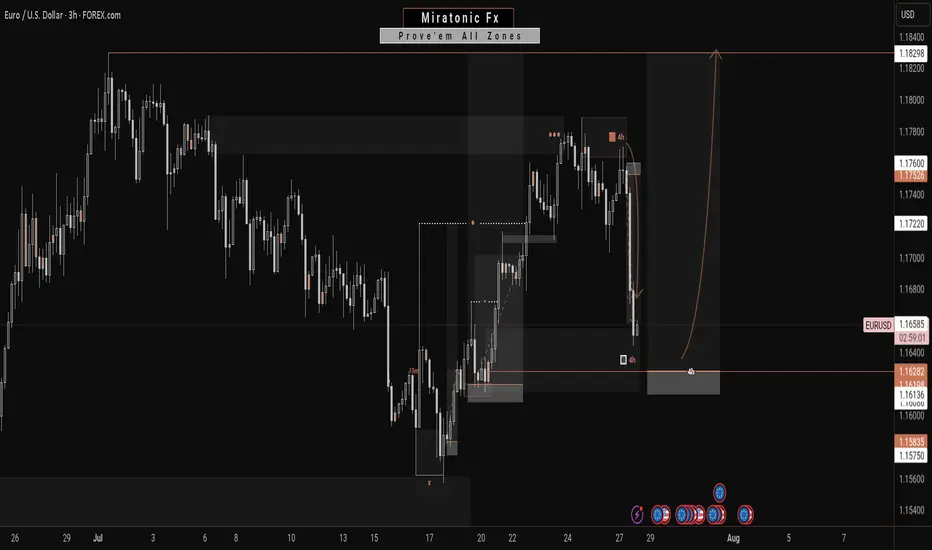
Next Move On EURUSD: A Bullish ContinuationWith this 4H bearish impulsive move, it’s easy to assume a reversal is underway to break the previous daily swing low. However, this appears more like a liquidity grab—fueling the next leg to the upside.
Price has retraced into a key zone that previously performed a strong liquidation. With significant liquidity already swept and clean inducements now resting above, this level becomes crucial.
This zone is the last stand: a break downward may target the daily swing low, while a hold and reaction could propel price toward the swing high.
Fingers crossed 🤞 as we watch price play out.
Have a great trading week, traders.
Catch you in the next one. 🫡
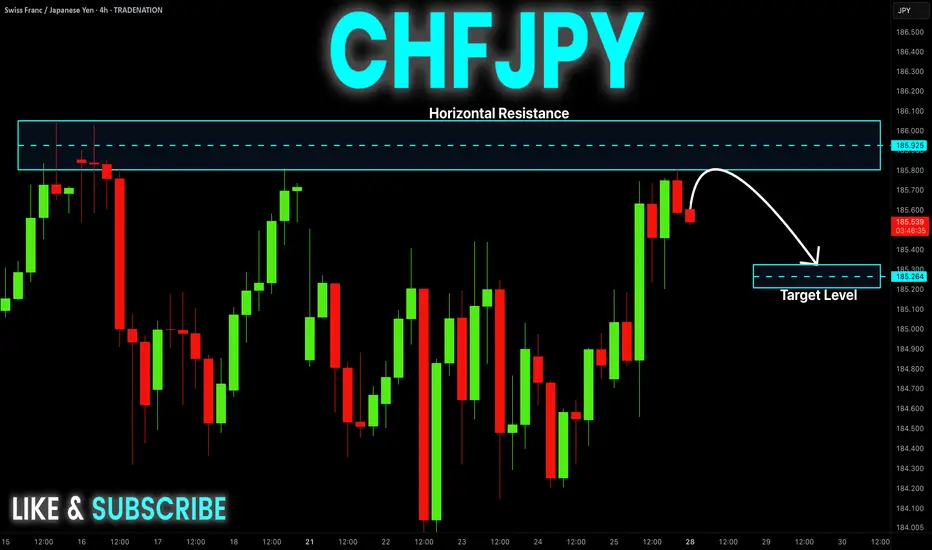
CHF-JPY Short From Resistance! Sell!
Hello,Traders!
CHF-JPY keeps trading in
An uptrend and the pair
Is locally overbought so after
The pair hits the horizontal
Resistance level of 186.000
We will be expecting a local
Bearish correction
Sell!
Comment and subscribe to help us grow!
Check out other forecasts below too!
Disclosure: I am part of Trade Nation's Influencer program and receive a monthly fee for using their TradingView charts in my analysis.
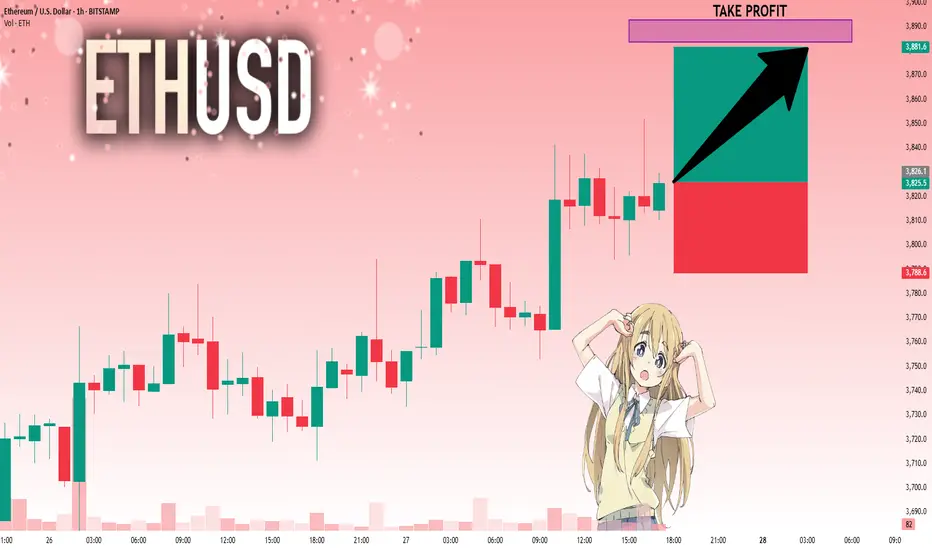
ETHUSD: Strong Bullish Sentiment! Long!
My dear friends,
Today we will analyse ETHUSD together☺️
The recent price action suggests a shift in mid-term momentum. A break above the current local range around 3,826.1 will confirm the new direction upwards with the target being the next key level of 3,883.6 and a reconvened placement of a stop-loss beyond the range.
❤️Sending you lots of Love and Hugs❤️
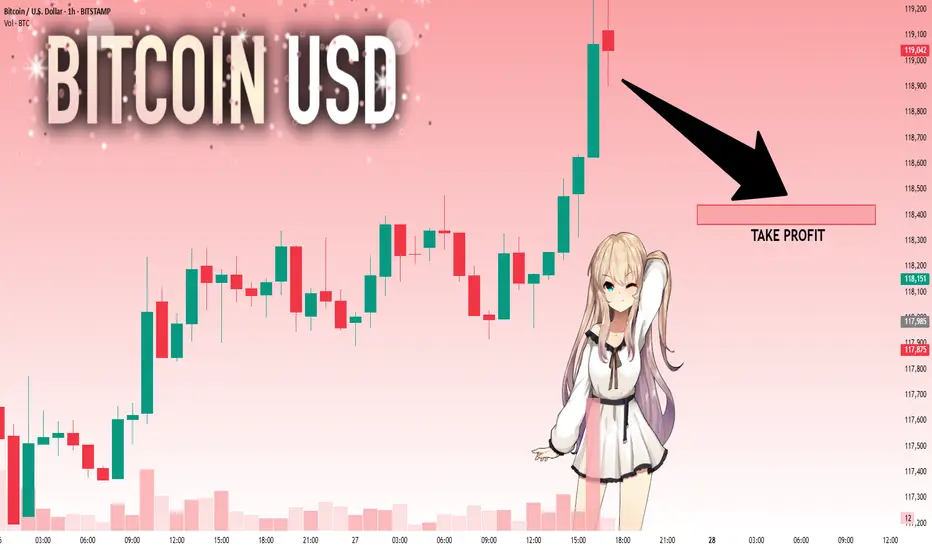
BTCUSD: Bears Are Winning! Short!
My dear friends,
Today we will analyse BTCUSD together☺️
The in-trend continuation seems likely as the current long-term trend appears to be strong, and price is holding below a key level of 118,973 So a bearish continuation seems plausible, targeting the next low. We should enter on confirmation, and place a stop-loss beyond the recent swing level.
❤️Sending you lots of Love and Hugs❤️
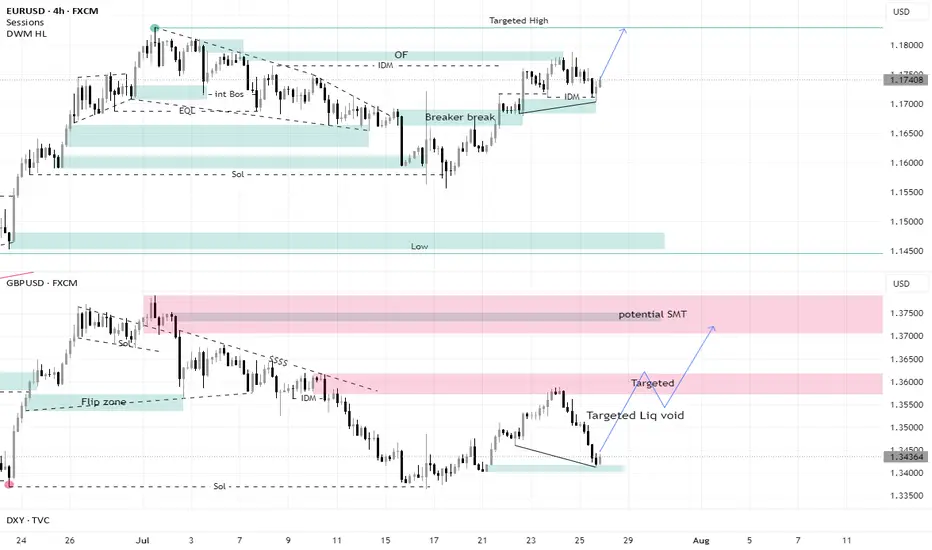
SMT in EU and GU + Targeting Liquidity voidI did not expect the GBPUSD to fall with all this force, but the EURUSD’s refusal to fall with it all these points indicates the strength of the current Low from which it rebounded, and it is expected that this bottom will hold
It is clear that GBPUSD was looking for more liquidity and that is why it dropped all these points. With this drop, it created a liquidity void that allowed it to rise and take all these pips back.
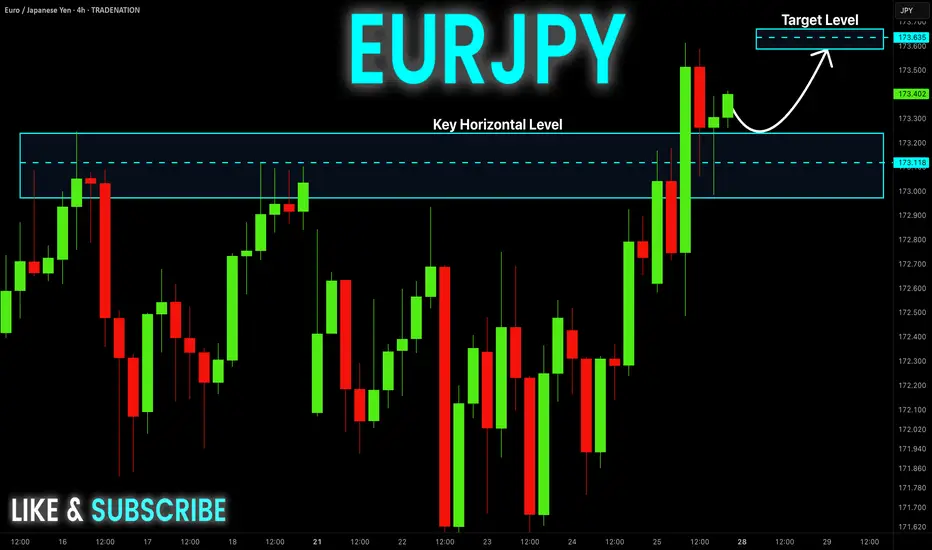
EUR-JPY Local Long! Buy!
Hello,Traders!
EUR-JPY is trading in an
Uptrend and the pair made
A breakout, a retest and
A bullish rebound from the
Horizontal support of 173.200
So we are bullish biased and
We will be expecting a
Further bullish move up
On Monday!
Buy!
Comment and subscribe to help us grow!
Check out other forecasts below too!
Disclosure: I am part of Trade Nation's Influencer program and receive a monthly fee for using their TradingView charts in my analysis.
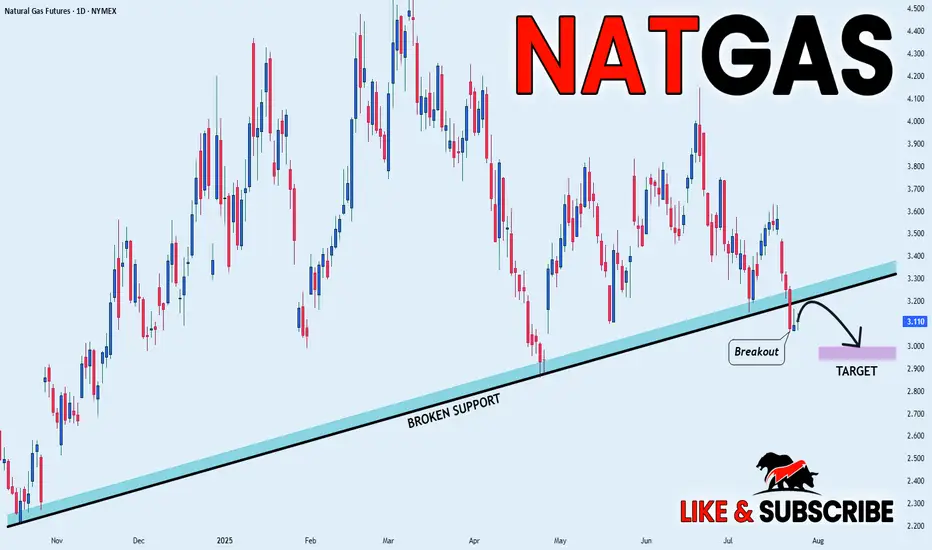
NATGAS BEARISH BREAKOUT|SHORT|
✅NATGAS broke the rising support
While trading in an local downtrend
Which makes me bearish
And I think that after the retest of the broken line is complete
A rebound and bearish continuation will follow
SHORT🔥
✅Like and subscribe to never miss a new idea!✅
Disclosure: I am part of Trade Nation's Influencer program and receive a monthly fee for using their TradingView charts in my analysis.
XAUUSD SNIPER OUTLOOK – JULY 28, 2025🔥 Macro & Sentiment
The dollar remains dominant — DXY holding above 105 keeps gold under pressure. No fundamental support for bullish continuation unless major macro shifts. Risk flows are defensive, not aggressive. FOMC and US GDP data remain key drivers for direction this week.
BIAS:
• Short-term bearish under 3350
• Market still in distribution mode — every bounce gets sold
• Real buy interest only deep below 3315
🔻 INTRADAY SUPPLY ZONES (Short Only With Rejection)
1. 3382–3370 (H1/M30 Premium Supply)
🔹 H1 order block, FVG alignment, EMA21/50/100 convergence
🔹 Liquidity inducement above → then rejection
📍 Short only if rejection shows via engulf / upper wick.
2. 3355–3340 (Decision Zone / Micro Supply)
🔹 EMA100/200 alignment, former support flipped resistance
🔹 M30 FVG fully filled, structure flip from mid-July
📍 Short bias below. Long only if reclaimed with H1 close above 3355.
🔵 NEUTRAL / PIVOT ZONE
3. 3338–3326 (Decision Band – M30/M15)
🔹 Consolidation area post-BOS, internal liquidity sweeps
🔹 EMA21 base on M15, no clear dominance
📍 Wait for clean reaction. Bullish engulf = scalp long to 3355. Failure = slide to demand.
🟢 DEMAND ZONES (Buy Only On Strong Reversal Confirmation)
4. 3314–3302 (M30/M15 Deep Demand)
🔹 H1 OB + hidden FVG + fib 38.2%
🔹 First real demand zone where buyers may engage
📍 Long only if strong M15 confirmation: engulf + RSI cross + EMA5/21 angle change.
5. 3289–3272 (True Reversal Demand – H1/M30)
🔹 Full NY reversal origin (July 18), major FVG left unfilled
🔹 Institutional volume + liquidity grab zone
📍 Buy only on full flush + fast snapback with BOS on M15/H1.
🧭 BIAS & EXECUTION BY TIMEFRAME
H4 Bias:
Bearish while below 3350. No valid supply above until 3370+. Avoid longs unless price sweeps 3314 or 3272 and confirms.
H1 Bias:
Sell clean rejection at 3355 or 3370–3382. Only flip long above 3355 with full-bodied close.
M30 Bias:
Watch decision zone 3338–3326 for direction. No-man’s land in between — don’t force trades.
M15 Bias:
Scalp long from 3314 or 3272 only on full confluence (OB + RSI + EMA realignment). Short only confirmed rejections above.
📊 FULL INTRADAY KEY LEVELS (Top → Bottom)
Level Context
3405 Fib ext. 127% (HTF sweep target only)
3385 OB
3375–3350 Valid Premium Supply (H1 shelf)
3350–3340 Micro Supply / Flip Zone
3338–3326 Decision Zone – watch reaction
3314–3302 Deep Demand (H1/M30 confluence)
3289–3272 Extreme Demand Base
3260 Fib 61.8% + HTF support
3250 Minor volume node
3240 Final structural floor
✅ EXECUTION NOTES
⛔ Avoid entering inside 3340–3326 → fakeout zone
✅ Play only clean sniper triggers with structure
⚠️ Wait for macro — FOMC / GDP releases may fake both sides
💡 Patience wins. Pick your zone, wait for setup, strike.
Which zone are you watching to strike? Drop your bias below.
📍 Like, comment & follow GoldFxMinds for the most precise sniper maps on TradingView.
Disclosure: This plan is based on the Trade Nation chart feed. I am part of their Influencer Program.

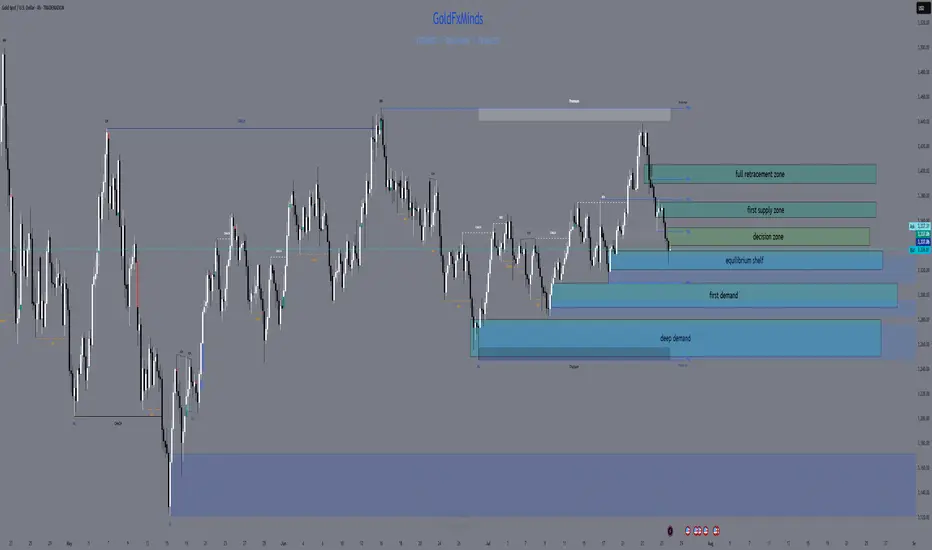
XAUUSD H4 Outlook – “Fed Week: Only the Real Zones”Hello, gold traders!
FOMC week is here, the dollar’s flexing, and gold is stuck under a fortress of supply. No fantasy, no overlaps, just your real, actionable H4 map—zones spaced, logic tight, and all fluff deleted.
⬜Bias:
Neutral to bearish while price is capped under 3,355 and the EMA cluster.
Only flip bullish if price closes and holds above 3,375 with strong confirmation after news.
Current Price: 3,336.81
Summary for your audience:
Neutral–bearish: All the EMAs (21/50/100/200) are overhead, and the primary supply and decision zones are blocking any upside.
No reason to flip bullish unless gold breaks out and holds above both the decision zone and the full supply ceiling after major news.
All bounces into supply are likely to get faded, unless the structure changes dramatically post-FOMC.
🟥 ULTRA SUPPLY ZONE: 3,390 – 3,405
127–161.8% Fib extension—liquidity grab and stop-hunt target for news-driven spikes
Only short if you see a monster upper wick and hard rejection
🟥 PRIMARY SUPPLY: 3,365 – 3,375
All EMAs (21/50/100/200) are stacked overhead; unfilled FVG at 3,370–3,375
Short on a clear rally rejection or bearish engulfing candle—this is where most breakouts get trapped
🔶 DECISION ZONE: 3,340 – 3,355
EMA100/200 straddle this level; small FVG at 3,350–3,352
Market “decides” here—fade unless price closes decisively above 3,355
🔵 EQUILIBRIUM SHELF: 3,320 – 3,335
50% Fib at 3,327; filled FVG at 3,325–3,330; SMA50 just below
Bounce/fake-break zone—wait for a clean H4 reversal, not a guess
🟢 FIRST DEMAND BASE: 3,290 – 3,310
H4 Order Block, hidden FVG (3,300–3,305), Fib 38.2% around 3,295
Longs only with strong pin-bar/engulf and quick EMA50 reclaim
🔵 DEEP PULLBACK BAY: 3,250 – 3,280
Weekly EMA21 and 61.8% Fib (~3,260), strong volume
Only consider a long on a panic flush and a powerful reversal wick
⚡️ MACRO CONTEXT
USD: On fire into ADP and FOMC; gold moves will be explosive, not logical
Events:
Tue: ADP
Wed: FOMC + Powell
Thu: Core PCE
Fri: NFP, ISM
Bias: Neutral-bearish under 3,355; only bullish if we close and hold above 3,375
EMAs: Clustered tightly overhead—bulls get no respect until this ceiling is crushed
🎯 TRADE LOGIC
Shorts:
3,390–3,405 (big wicks and clear rejection only)
3,365–3,375 (news spike or failed breakout with bearish candle)
Longs:
3,340–3,355 (only on a confirmed close above)
3,320–3,335 (strong reversal only—don’t front run)
3,290–3,310 (classic H4 pin-bar/engulf + EMA50 reclaim)
3,250–3,280 (deep panic flush and major reversal only)
NO TRADE: In the gaps—let the gamblers get chewed up, not you.
💬 Which zone will you snipe? Drop a comment and show you’re here for structure, not noise!
👍 Like & Follow for high-value, real-time sniper maps every day.
Disclosure: Chart via Trade Nation’s TradingView feed. Influencer Program participant.
GoldFxMinds 💛