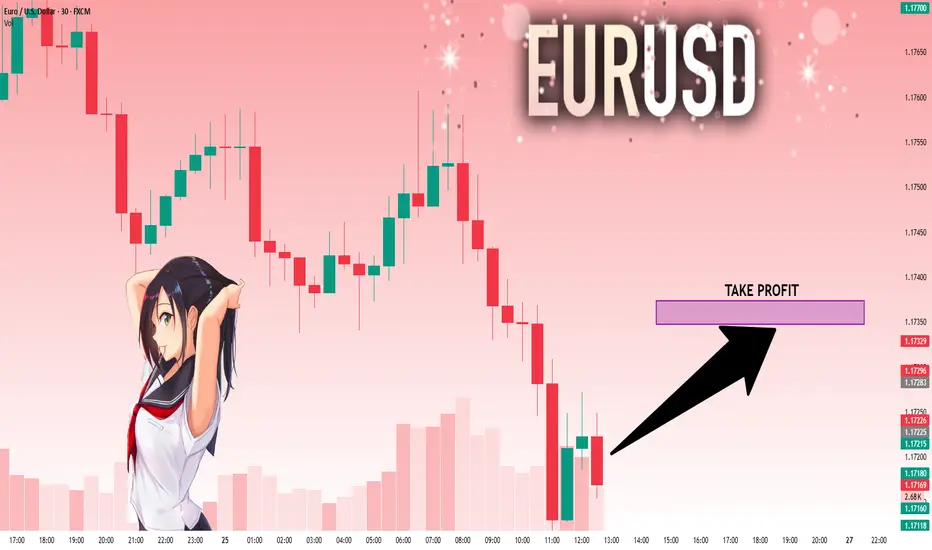
EURUSD: Will Go Up! Long!
My dear friends,
Today we will analyse EURUSD together☺️
The price is near a wide key level
and the pair is approaching a significant decision level of 1.17201 Therefore, a strong bullish reaction here could determine the next move up.We will watch for a confirmation candle, and then target the next key level of 1.17348.Recommend Stop-loss is beyond the current level.
❤️Sending you lots of Love and Hugs❤️
SMC
SILVER: The Market Is Looking Down! Short!
My dear friends,
Today we will analyse SILVER together☺️
The recent price action suggests a shift in mid-term momentum. A break below the current local range around 38.780 will confirm the new direction downwards with the target being the next key level of 38.635.and a reconvened placement of a stop-loss beyond the range.
❤️Sending you lots of Love and Hugs❤️

Will the low of this BTC zone be used as a buy point?We have an imbalance high being tested. We know that this also represents the consolidation range low where both TPs and long entries will be triggered.
Will this be enough to send us back bullish or will be need further correction of the imbalance? I think there's a high probability of this with DXY also running into it's daily bearish imbalance range.
Is the DOLLAR bullish? Look at the weekly support zone levelsI am trying to figure out what the recent bullish days mean within the overall range.
Please let me know what you think 🙏🏾

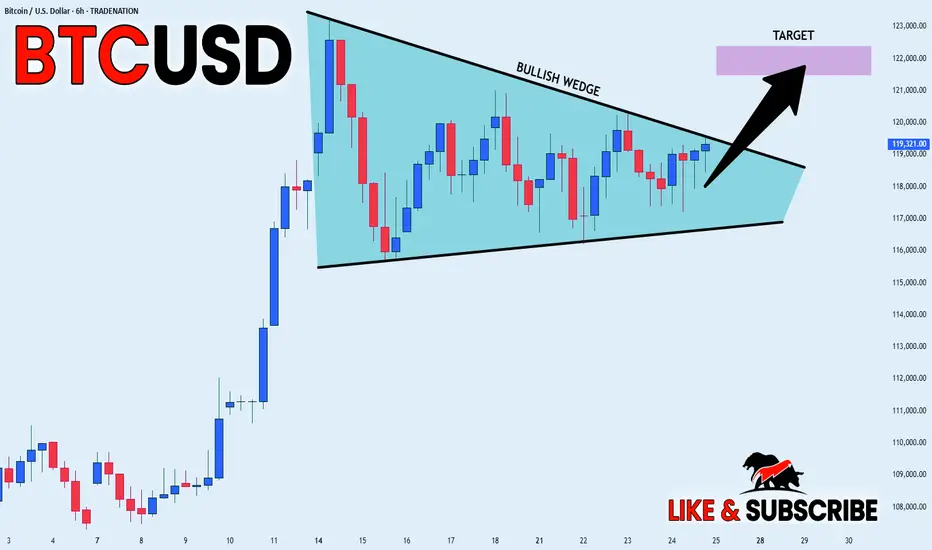
BITCOIN BULLISH WEDGE|LONG|
✅BITCOIN is trading in a
Strong uptrend and the coin
Has formed a massive bullish
Wedge pattern so we are
Bullish biased and IF we see
A bullish breakout we will
Be expecting a further
Bullish move up
LONG🚀
✅Like and subscribe to never miss a new idea!✅
Disclosure: I am part of Trade Nation's Influencer program and receive a monthly fee for using their TradingView charts in my analysis.
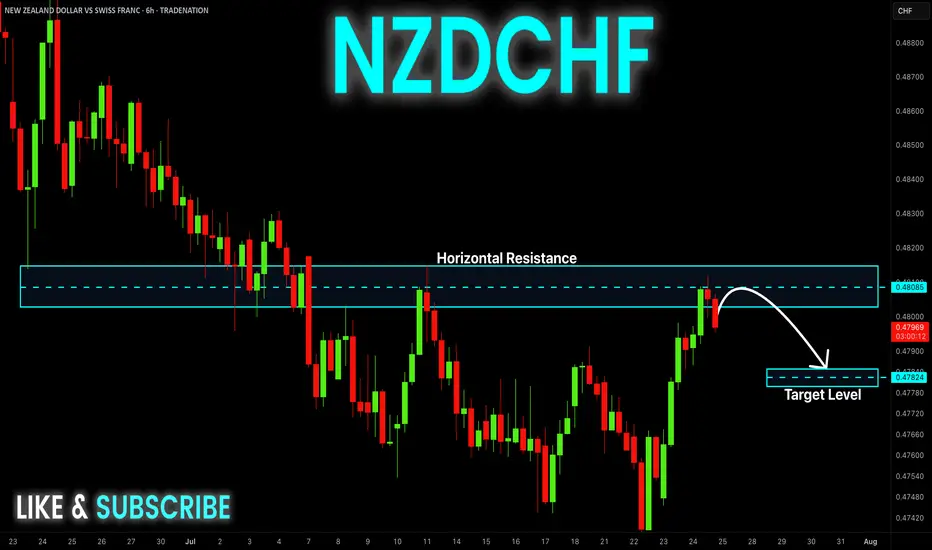
NZD-CHF Local Bearish Bias! Sell!
Hello,Traders!
NZD-CHF made a retest of
The horizontal resistance
of 0.4810 so we are locally
Bearish biased and we
Will be expecting a
Further bearish move down
Sell!
Comment and subscribe to help us grow!
Check out other forecasts below too!
Disclosure: I am part of Trade Nation's Influencer program and receive a monthly fee for using their TradingView charts in my analysis.
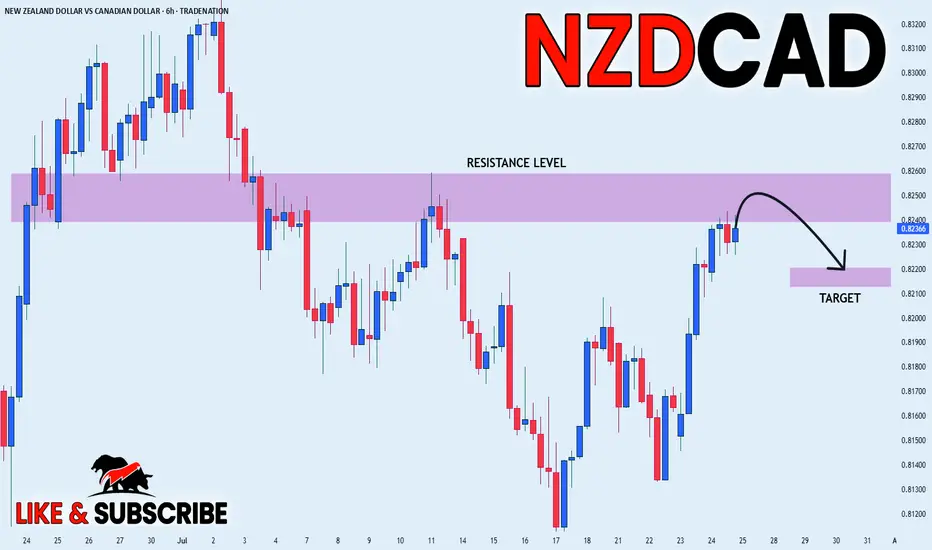
NZD_CAD POTENTIAL SHORT|
✅NZD_CAD has been growing recently
And the pair seems locally overbought
So as the pair is approaching
A horizontal resistance of 0.8260
Price decline is to be expected
SHORT🔥
✅Like and subscribe to never miss a new idea!✅
Disclosure: I am part of Trade Nation's Influencer program and receive a monthly fee for using their TradingView charts in my analysis.
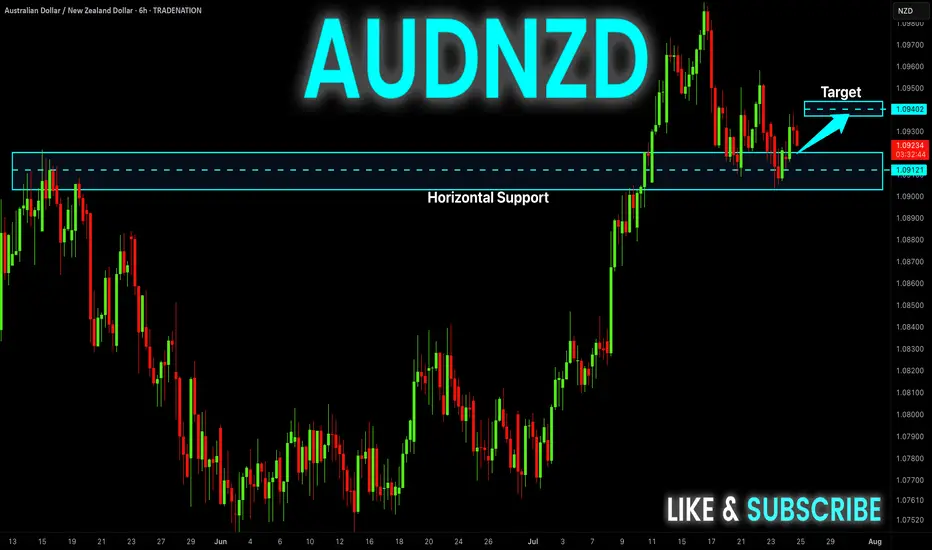
AUD-NZD Local Long! Buy!
Hello,Traders!
AUD-NZD is about to retest
A strong horizontal support
Level of 1.0912 and as we are
Bullish biased we will be expecting
A local bullish rebound
Buy!
Comment and subscribe to help us grow!
Check out other forecasts below too!
Disclosure: I am part of Trade Nation's Influencer program and receive a monthly fee for using their TradingView charts in my analysis.
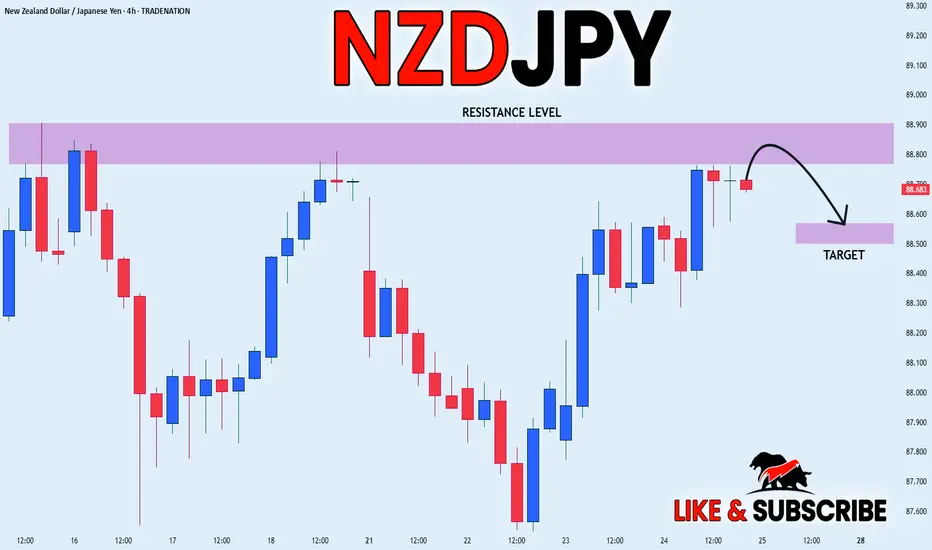
NZD_JPY SHORT FROM RESISTANCE|
✅NZD_JPY is going up now
But a strong resistance level is ahead at 88.900
Thus I am expecting a pullback
And a move down towards the target of 88.572
SHORT🔥
✅Like and subscribe to never miss a new idea!✅
Disclosure: I am part of Trade Nation's Influencer program and receive a monthly fee for using their TradingView charts in my analysis.
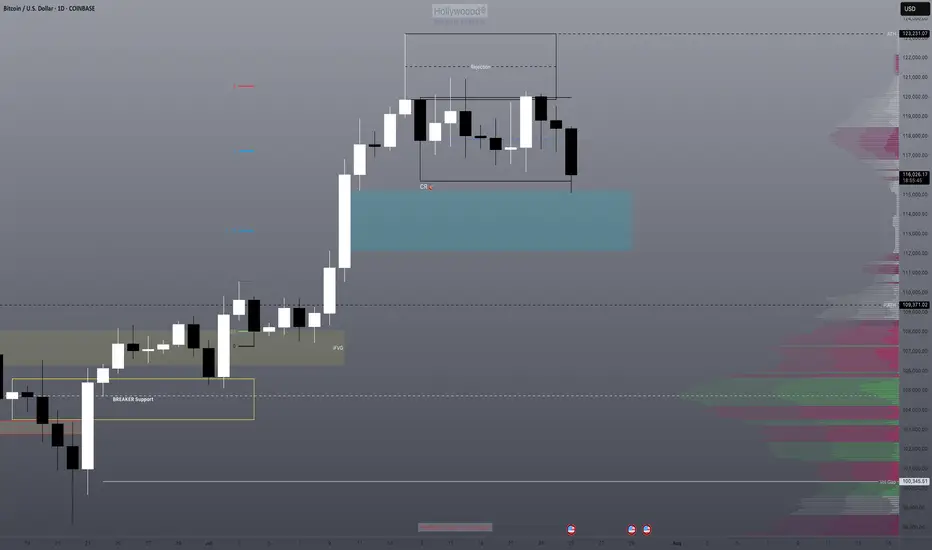
Bitcoin - Bullish Reversal PotentialBitcoin is currently consolidating within a well-defined range, with repeated rejections from the upper resistance zone and strong reactions from the support below. Price continues to respect both ends of the structure, suggesting that liquidity is being built up on both sides. Until a clear breakout occurs, we should expect more range-bound movement with sharp rejections near the boundaries.
Support Zone and Liquidity Engineering
The support zone beneath current price action has already held several times, showing clear buying interest. However, the lows around this area remain relatively clean. A sweep of those lows would not only engineer sell-side liquidity but also set the stage for a reversal if buyers step back in. This would align well with typical accumulation behavior seen during consolidation phases.
Rejections from Resistance and FVG Influence
Price has shown multiple rejections from the resistance zone, particularly inside the fair value gap that sits just above it. This confirms that the area is actively defended and will likely be the next upside target if price manages to bounce from support. The FVG itself acts as a magnet once price begins to trend again, especially if a strong displacement follows a sweep.
Expected Flow and Trade Opportunity
The anticipated scenario involves price dipping back into support, possibly sweeping the lows for inducement, and then bouncing with a shift in short-term structure. If that happens, we can expect a move back toward resistance, completing another rotation within the range. The sweep would offer an added layer of confirmation, giving a stronger reason to look for long setups.
Invalidation and Risk Perspective
If support fails to hold and price breaks beneath the range without immediate recovery, that would invalidate the bullish view and point to a potential shift in directional bias. As long as price stays inside the current consolidation, however, this remains a waiting game for either a clean reaction from support or a sweep followed by structure shift.
Conclusion
Bitcoin remains locked in a clear range, and until the breakout happens, the edges of that range offer the best trading opportunities. A sweep of the lows would act as a high-probability signal for a reversal back to the highs. Patience is key, wait for the sweep and confirmation before committing to the upside.
___________________________________
Thanks for your support!
If you found this idea helpful or learned something new, drop a like 👍 and leave a comment, I’d love to hear your thoughts! 🚀

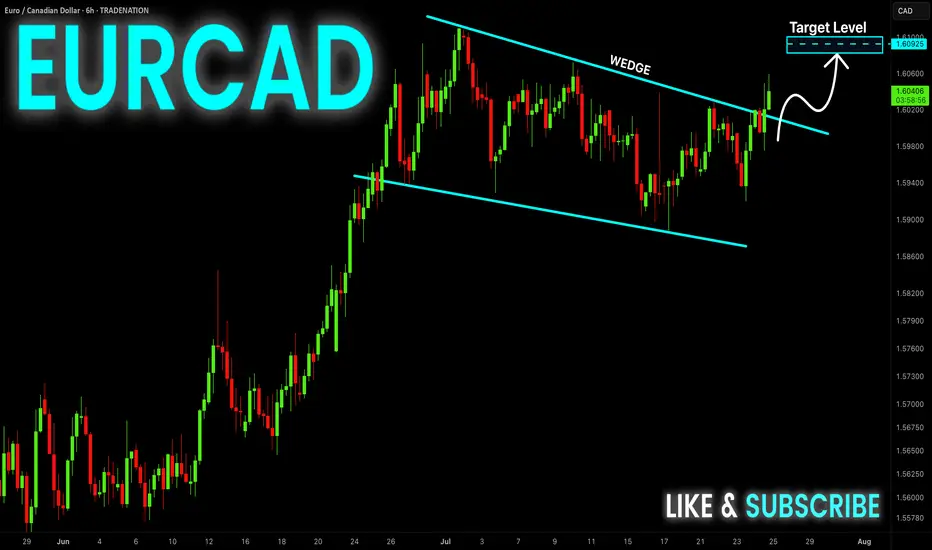
EUR-CAD Bullish Wedge! Buy!
Hello,Traders!
EUR-CAD is trading in an
Uptrend and the pair formed
A bullish wedge pattern and
Now we are seeing a bullish
Breakout from the wedge so
We are bullish biased and we
Will be expecting a further
Bullish move up
Buy!
Comment and subscribe to help us grow!
Check out other forecasts below too!
Disclosure: I am part of Trade Nation's Influencer program and receive a monthly fee for using their TradingView charts in my analysis.
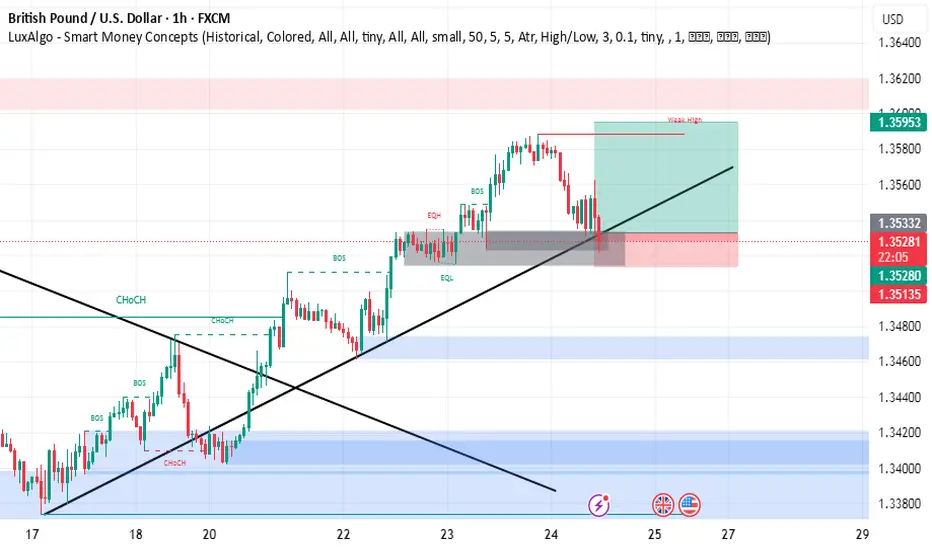
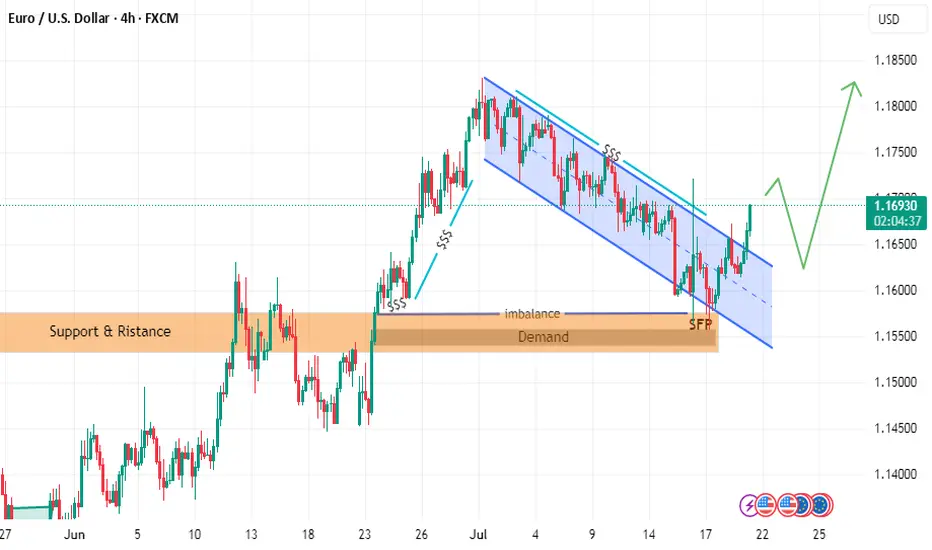
GBPUSD buy setupsimply
this is 6 deals after 5 CONSECUTIVE WINNING traders
we have demand
uptrend
the price can't make lower low
and make more candle in the area with more rejection
so the price will go up
be careful on your risk money management
BEST WISHES
DXY: Strong Bullish Sentiment! Long!
My dear friends,
Today we will analyse DXY together☺️
The in-trend continuation seems likely as the current long-term trend appears to be strong, and price is holding above a key level of 96.722 So a bullish continuation seems plausible, targeting the next high. We should enter on confirmation, and place a stop-loss beyond the recent swing level.
❤️Sending you lots of Love and Hugs❤️

SILVER: Bulls Are Winning! Long!
My dear friends,
Today we will analyse SILVER together☺️
The market is at an inflection zone and price has now reached an area around 39.025 where previous reversals or breakouts have occurred.And a price reaction that we are seeing on multiple timeframes here could signal the next move up so we can enter on confirmation, and target the next key level of 39.148.Stop-loss is recommended beyond the inflection zone.
❤️Sending you lots of Love and Hugs❤️

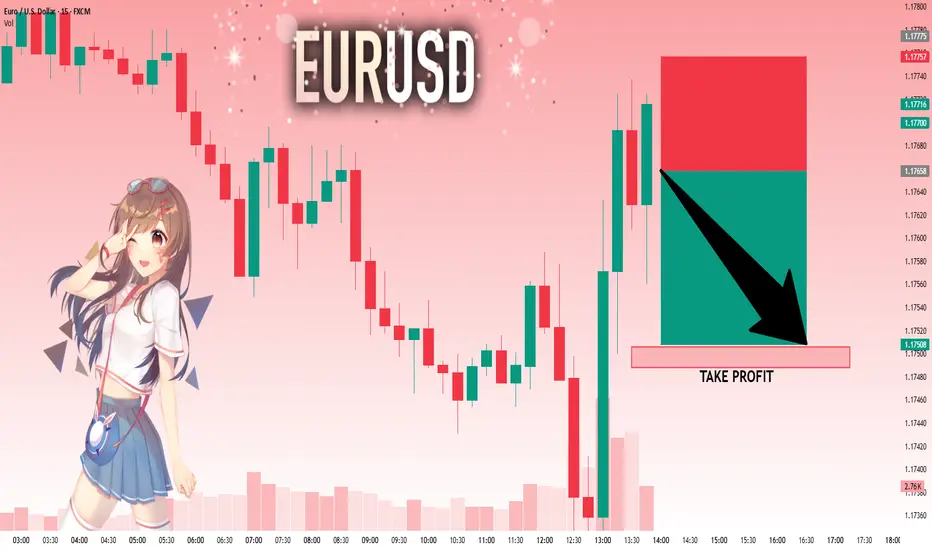
EURUSD: Next Move Is Down! Short!
My dear friends,
Today we will analyse EURUSD together☺️
The price is near a wide key level
and the pair is approaching a significant decision level of 1.17658 Therefore, a strong bearish reaction here could determine the next move down.We will watch for a confirmation candle, and then target the next key level of 1.17506..Recommend Stop-loss is beyond the current level.
❤️Sending you lots of Love and Hugs❤️
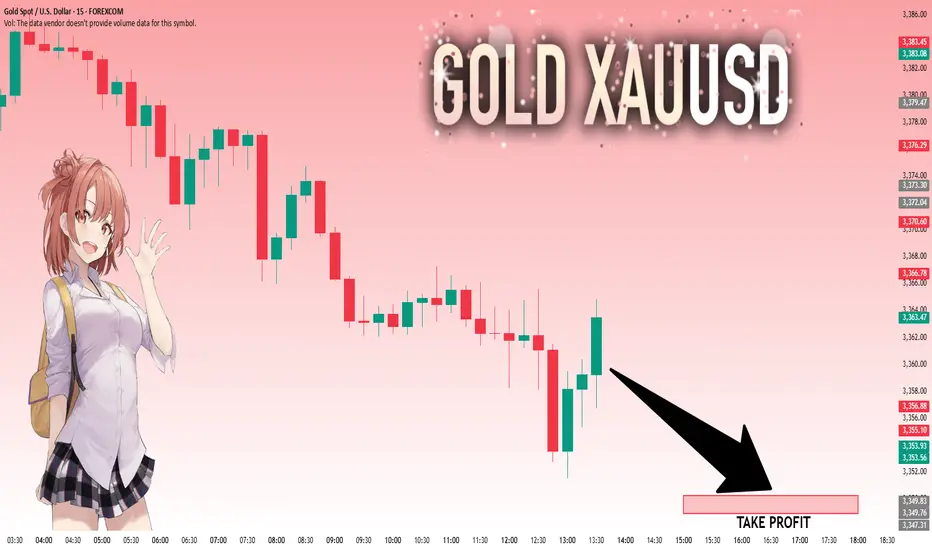
GOLD: Target Is Down! Short!
My dear friends,
Today we will analyse GOLD together☺️
The recent price action suggests a shift in mid-term momentum. A break below the current local range around 3,359.59 will confirm the new direction downwards with the target being the next key level of 3,350.22.and a reconvened placement of a stop-loss beyond the range.
❤️Sending you lots of Love and Hugs❤️
follow EURUSD LION & PLANE BUY SETUPTHE PRICE has moved as I explained in the last two posts
but we have some update to go along the way
the price could break failing channel
and withdrawal liquidity and filled imbalance
hence reflect from demand zone with zero reflection as i explained in last post with rock and plane
and it will go up to take liquidity in failing channel or downtrend
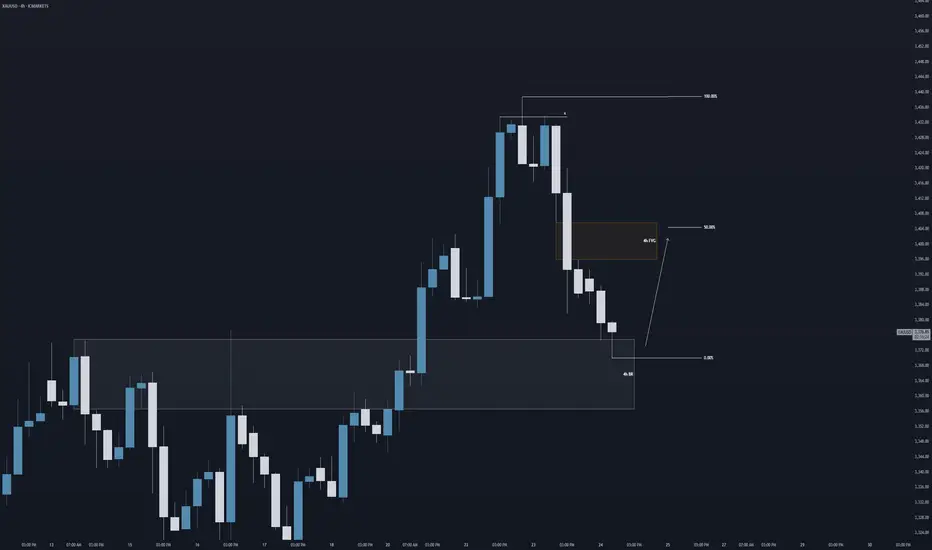
Bullish Leg on Gold? Good morning traders,
Here is my forecast on the 4h chart for Gold.
We could potentially see a bullish leg if this 4h breaker block price area holds as support. And could see a retracement towards buyside imbalance in the form of a 4h FVG (Fair Value Gap) at around equilibrium (50%) towards $3,400.
Regards,
Aman
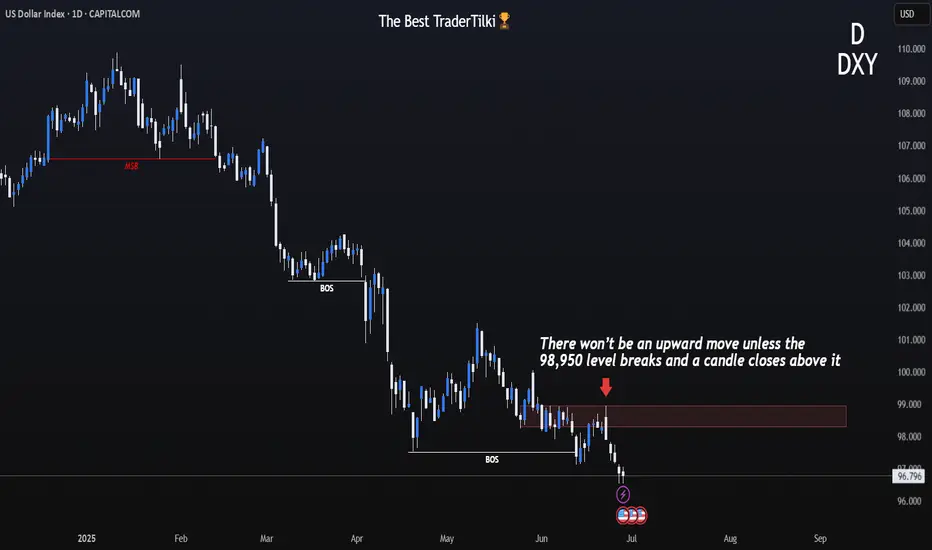
DXY 1D – Tipping Point: News or Price Action?Hey Guys,
The DXY index is currently moving within a downtrend. This trend is unlikely to reverse unless it breaks above the 98.950 level.
Sure, key fundamental data could shift the trend, but without those news catalysts, a reversal at this point doesn’t seem realistic.
Don’t forget—98.950 is a critical threshold for the DXY.
I meticulously prepare these analyses for you, and I sincerely appreciate your support through likes. Every like from you is my biggest motivation to continue sharing my analyses.
I’m truly grateful for each of you—love to all my followers💙💙💙
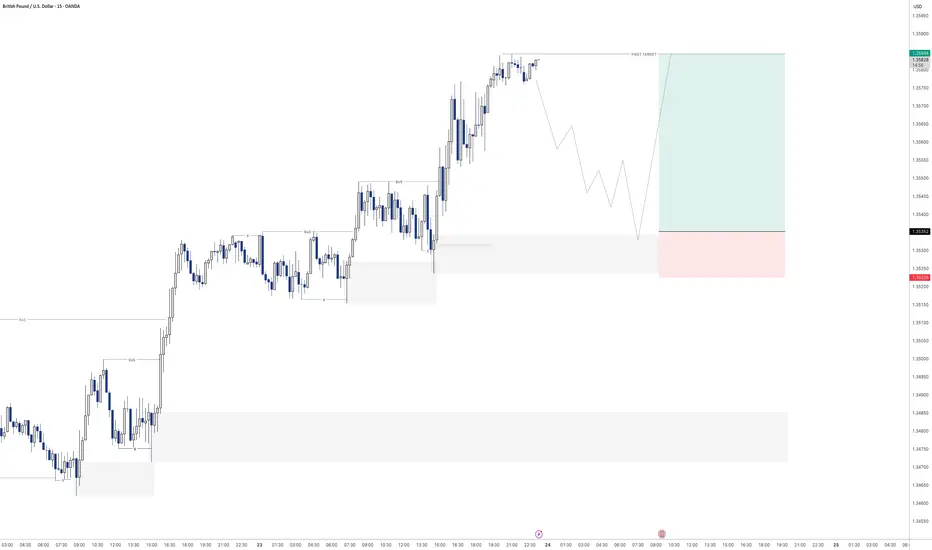
GBPUSD - Next buy from demandLooking here for potential further buying momentum to the upside.
Will see how this plays out tomorrow
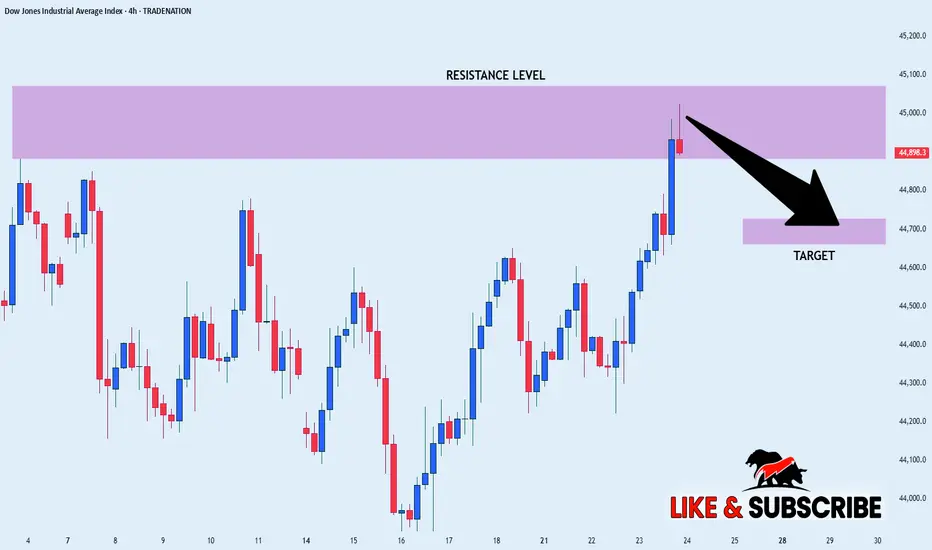
US30 SHORT FORM RESISTANCE|
✅DOW JONES index keeps
Growing in a strong uptrend
And we are bullish biased long-term
However the price has hit an all-time-high
Resistance level of 45,072(which can be seen
Further left you zoom out on higher TF)
So as we are already seeing a local
Bearish reaction we will be
Expecting a local bearish correction
SHORT🔥
✅Like and subscribe to never miss a new idea!✅
Disclosure: I am part of Trade Nation's Influencer program and receive a monthly fee for using their TradingView charts in my analysis.
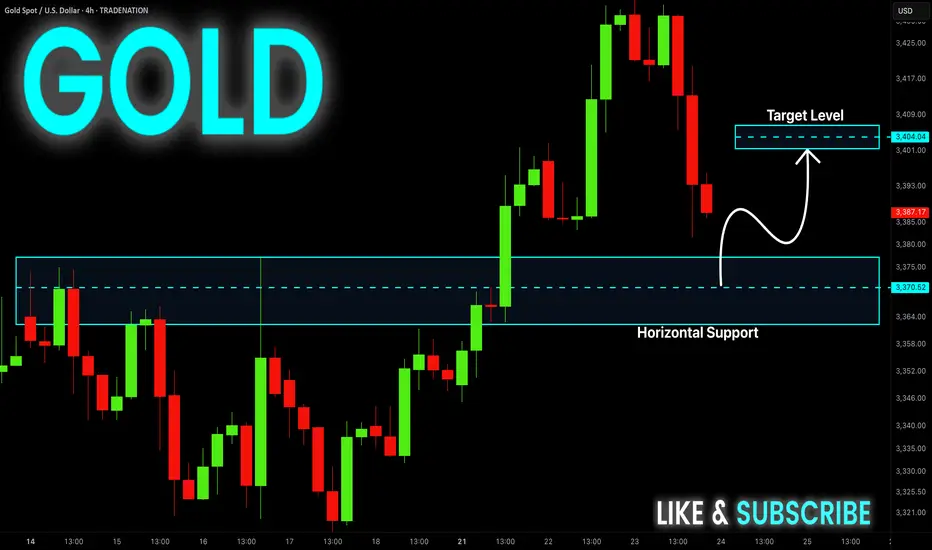
GOLD Rebound Ahead! Buy!
Hello,Traders!
GOLD is falling down now
But will soon hit a horizontal
Support level of 3375$
And as we are bullish biased
We will be expecting a rebound
And a local bullish correction
Buy!
Comment and subscribe to help us grow!
Check out other forecasts below too!
Disclosure: I am part of Trade Nation's Influencer program and receive a monthly fee for using their TradingView charts in my analysis.
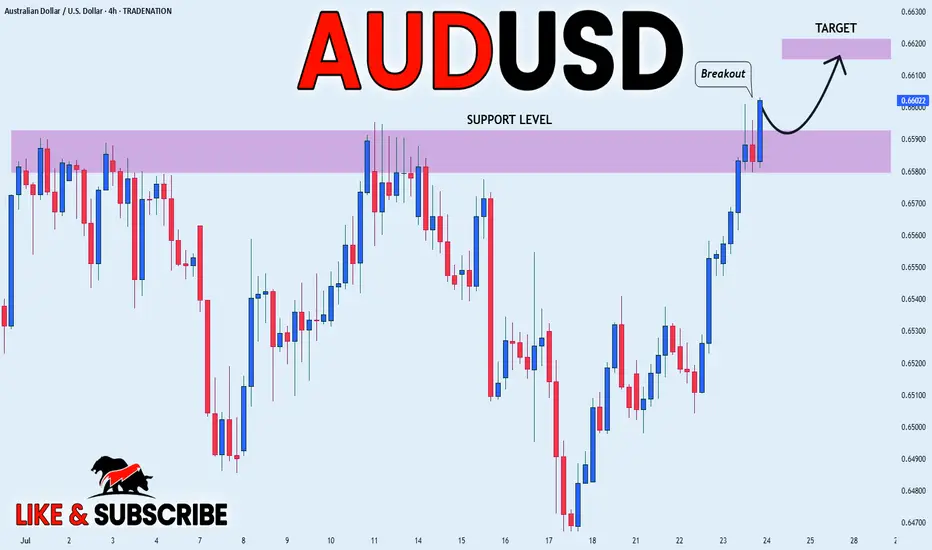
AUD_USD BULLISH BREAKOUT|LONG|
✅AUD_USD is going up
Now and the pair made a bullish
Breakout of the key horizontal
Level of 0.6590 and the breakout
Is confirmed so we are bullish
Biased and we will be expecting
A further bullish move up
LONG🚀
✅Like and subscribe to never miss a new idea!✅
Disclosure: I am part of Trade Nation's Influencer program and receive a monthly fee for using their TradingView charts in my analysis.