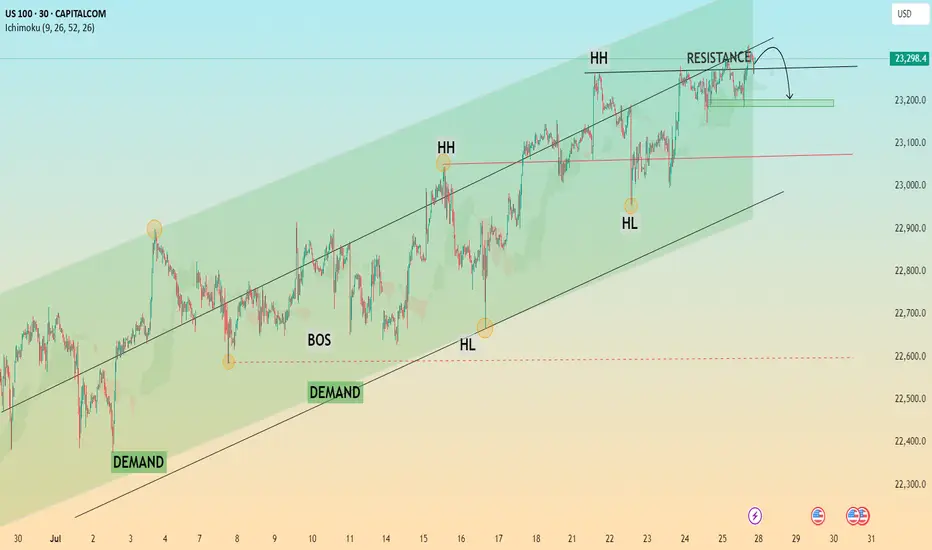
Trend Exhaustion Detected – Bearish Structure AheadUS100 (NASDAQ) 30-minute chart as of July 26, 2025, with technical insights based on the visible elements.
🔍 1. Trend Analysis
Primary Trend: Uptrend (bullish structure)
The price has been respecting a rising parallel channel, marked by:
Ascending support (lower boundary)
Ascending resistance (upper boundary)
Market structure shows:
Higher Highs (HH)
Higher Lows (HL)
✅ This indicates continuation of bullish momentum until structure breaks.
📐 2. Market Structure Elements
Structure Type Label on Chart Price Zone (approx.)
Break of Structure (BOS) BOS (center-left) ~22,950
Higher Low (HL) HL (2x) ~22,700 (1st), ~23,050 (2nd)
Higher High (HH) HH (2x) ~23,150 and ~23,300
Resistance Labelled ~23,300–23,320
Demand Zones Labelled ~22,450–22,700
🔁 Break of Structure (BOS)
The BOS occurred after a prior swing low was broken, followed by a new higher high, confirming a bullish shift.
🧱 3. Support / Resistance Analysis
🔼 Resistance Zone
The price is testing strong resistance around 23,300–23,320
Multiple rejections in this area
Trendline resistance also aligns here
A rejection arrow is drawn, indicating potential bearish reaction
🔽 Support Zone (Immediate)
23,180–23,220: highlighted green box is a local support block
If broken, likely to revisit 23,000–23,050, or even down to 22,900 range
🟩 4. Demand Zones
Zone 1:
22,450–22,600: Strong bullish reaction historically — likely to act as a key demand if a deeper pullback occurs
Zone 2:
22,850–22,950: Validated with prior accumulation & BOS event
🧠 5. Key Observations
Price is at a critical inflection zone:
Testing a resistance zone
At the upper trendline of an ascending channel
A bearish reaction is projected (black arrow)
Possibly targeting the green support zone around 23,180–23,220
If that fails, demand at ~23,000 will likely be tested
Ichimoku Cloud:
Currently price is above the cloud → still bullish
Cloud is thin → potential weakness or upcoming consolidation
⚠️ 6. Trading Bias & Setup Ideas
✅ Bullish Bias (if price holds above ~23,180)
Long entries can be considered on bullish reaction from support
Target: retest of 23,300–23,350 or even breakout continuation
❌ Bearish Bias (if breakdown below support)
Short entry valid below 23,180 with:
TP1: 23,050
TP2: 22,900
A breakdown from the ascending channel would signal trend exhaustion
🔚 Conclusion
Current Price: 23,298.4
Trend: Bullish, but at resistance
Next move: Watch for reaction at resistance and support box below
Bias: Neutral-to-bullish unless the structure breaks below ~23,180
Smcconcepts
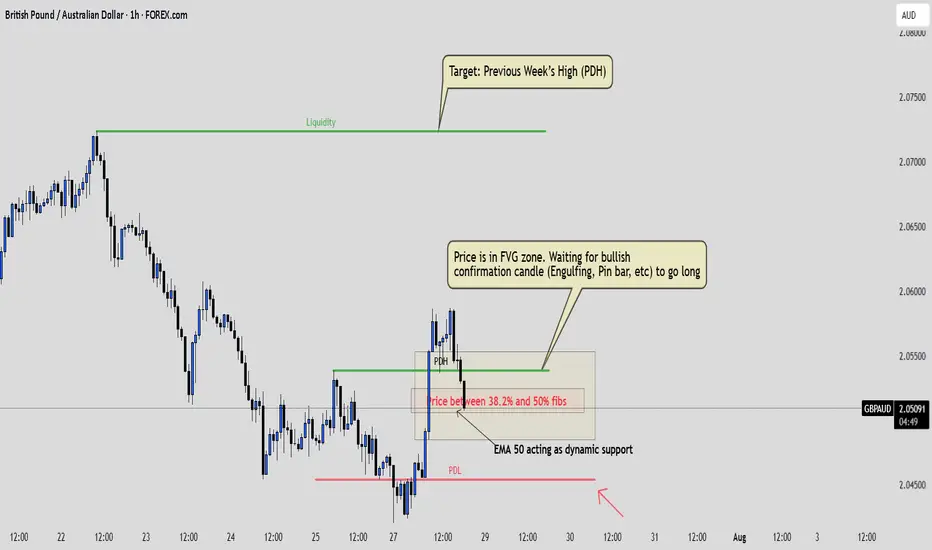
GBPAUD: Calm Before the ConfirmationPrice has swept liquidity below the previous week's low and broke structure to the upside. Now it’s retracing into a Fair Value Gap that aligns beautifully with the 38.2% to 50% Fibonacci zone.
I'm not in yet. I’m watching for a clean bullish confirmation, like an engulfing or strong rejection candle, before entering .
The 50 EMA supports the bias and helps confirm that I'm trading in the direction of the short-term momentum. If all aligns, I’ll be targeting the previous week’s high.
This is a reminder that being patient often protects your capital more than being early.
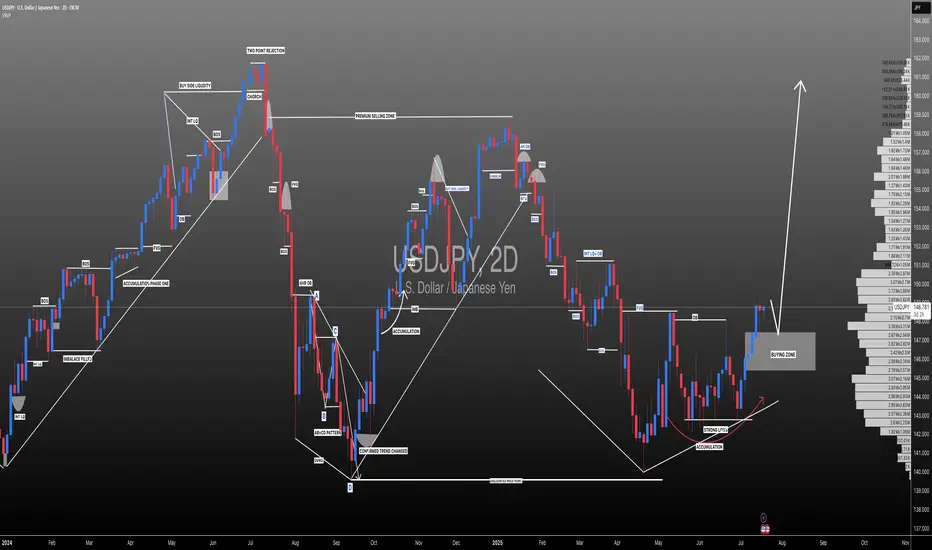
#USDJPY: Swing Buy Almost +2000 Pips! Dear Traders,
The USDJPY currency pair appears to be in an accumulation phase at the moment, as evidenced by the lack of significant price movement throughout the current week. Several factors contribute to this trend.
Firstly, several significant economic events are scheduled for this week, particularly tomorrow and Friday. These developments will have substantial implications for the future trajectory of the USDJPY pair. Consequently, there’s a possibility that the price may experience a decline before initiating a bullish trend. We’ve recently seen a strong bullish candle, which suggests a strong bullish move in the coming weeks. Additionally, the strong USD could continue rising, while the JPY is dropping.
Secondly, there are two primary areas where the price could reverse its course. The extent to which the USD reacts to the economic data will indicate potential reversal zones.
It’s crucial to conduct your own analysis before making any financial decisions. This chart should be used solely for educational purposes and does not guarantee any specific outcome.
Regarding the stop loss, as this is a swing trade, it’s advisable to employ a larger stop loss if the price reaches entry zones. The take profit level can be determined based on your entry type and analysis.
We wish you the best of luck in your trading endeavours and emphasise the importance of trading safely.
Please share this analysis with others through likes, comments, and social media platforms. If you have any questions or require further assistance, don’t hesitate to comment below. We’re here to provide support.
Team Setupsfx_
❤️🚀
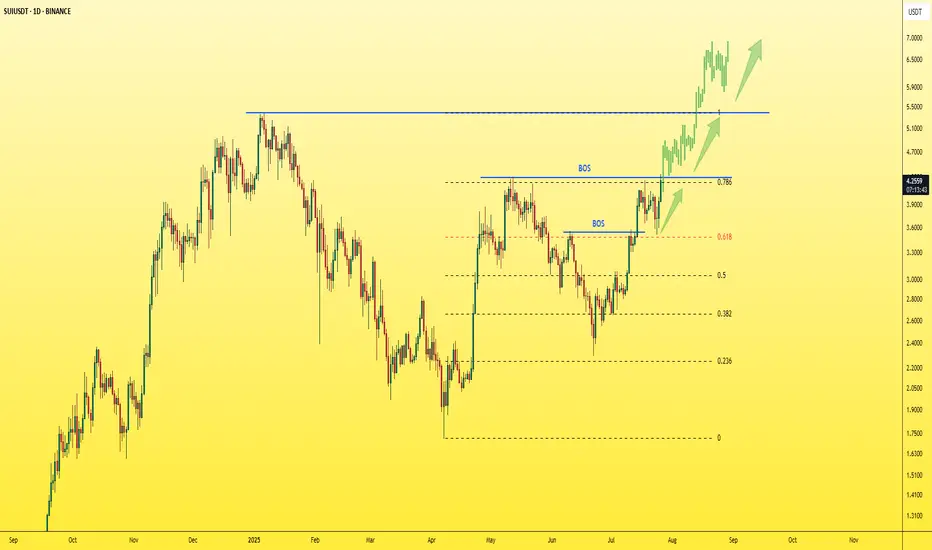
SUI - Just one step away from the explosion!The last candle on the daily chart just confirmed a BOS (Break of Structure) — a clear and strong sign of bullish continuation for the asset.
✅ This is a textbook entry for a long position.
🎯 Next target: $5 — and so far, no bearish signs in sight.
Best regards,
Ceciliones 🎯
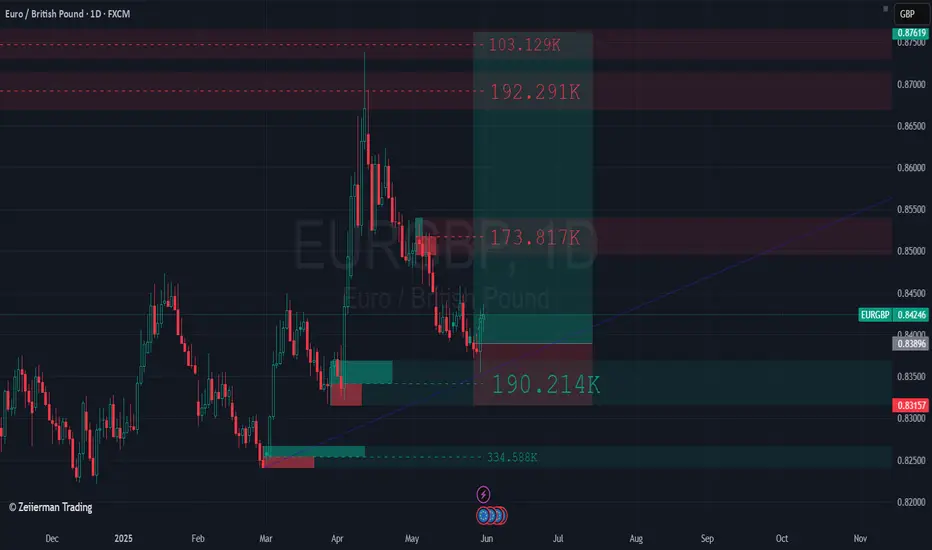
I'm currently long on EUR/GBPPrice is currently reacting to a retest of an order block located within the discount zone, following a Shift in Market Structure (SMS).
Additionally, on the weekly timeframe, price is also positioned in the discount zone, aligning with a weekly order block at the same level.
Disclaimer: This is not financial advice—just my personal analysis.
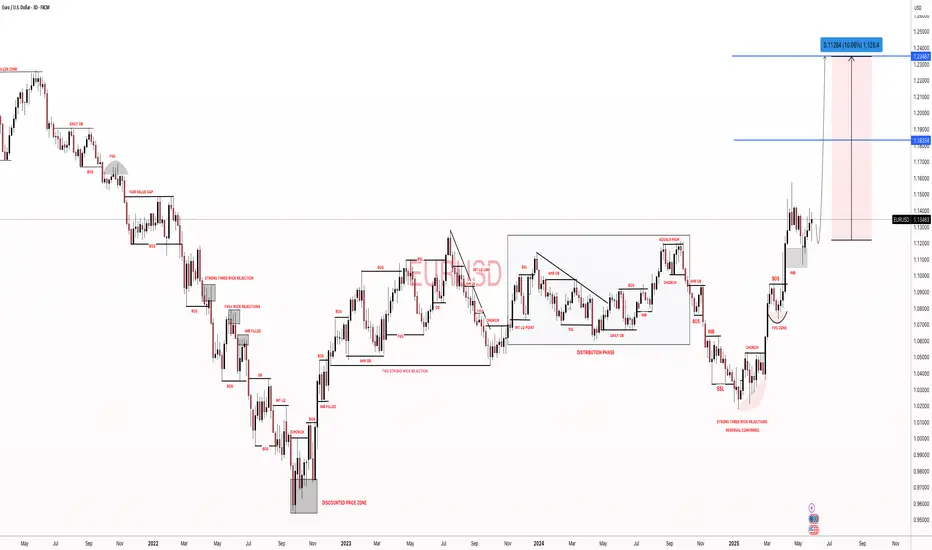
Week of 7/20/25: EURUSD AnalysisLast week's price action was bearish and has finally reached the extreme daily demand level and provided some reaction. Price has swept bulls and bears, so now we follow internal structure and wait to see where price actually wants to go. If internal 1h structure breaks bearish, we have confirmation to trade bearish until price goes deeper into the daily extreme zone.

Week of 7/20/25: AUDUSD AnalysisLast week's price action was bearish and this week I will follow bearish order flow unless internal 1h structure continues to be bullish. I'm going to look for shorts after 1h internal structure is broken as confirmation, then take trades down to the daily demand zone and then look for bullish signals.

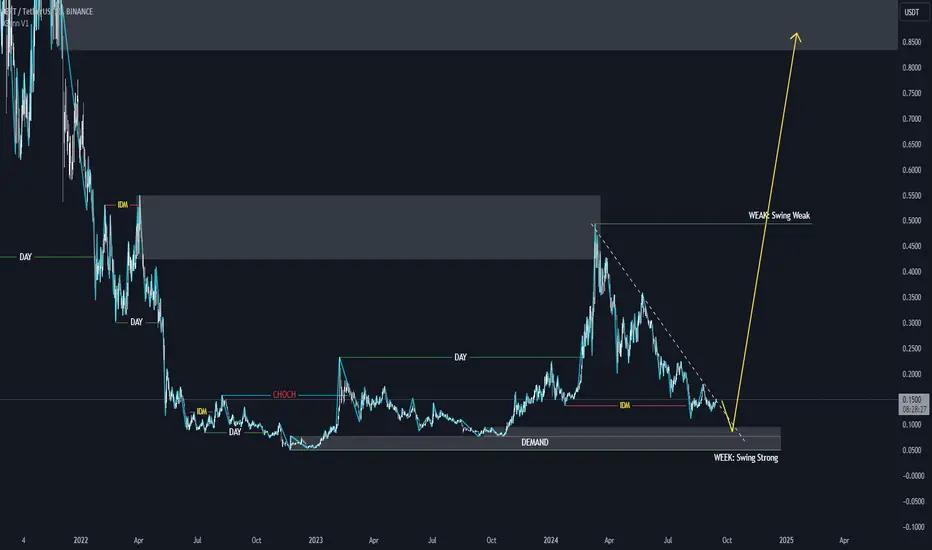
Wave structure of GRT coin in week time frame- Week is swing bullish => current is pullback.
- Day is swing bullish => current is pullback.
- We can look for buying opportunities when there is a reversal signal on the 4-hour time frame or the price reaches the demand zone of the daily frame.
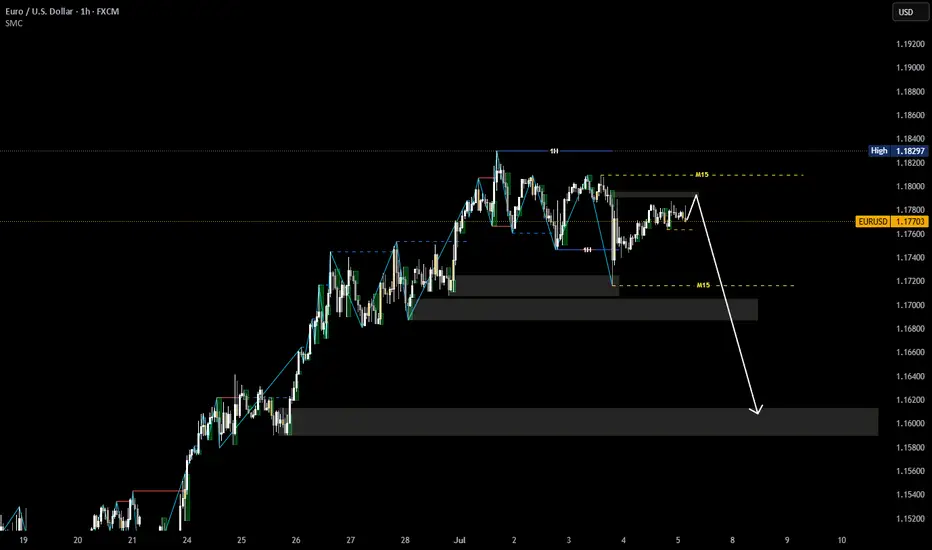
EURUSD structure analysis on M15 and H1- 4H swing is bullish, currently is pullback
- 1H, M15 swing is bearish, current is pullback.
- We can look for selling opportunities according to the wave configuration of H1 and M15 timeframes
Week of 7/13/25: EURUSD AnalysisLast week's candle was a bearish engulfing meaning that most likely price will continue lower this week as a daily trend retracement. Waiting for LTF bearish price action before entering.
Major News:
Tuesday - CPI
Wednesday - PPI
Thursday - Unemployment

Week of 7/13/25: AUDUSD AnalysisLast week pushed bullish and demand is still in control on all time frames, so we are going to follow bullish order flow.
Looking for bottom liquidity to be taken in the local range before getting in on a long.
Major News:
Tuesday - CPI
Wednesday - PPI
Thursday - Unemployment

XAUUSD structure analysis on M15 and H1- 4H swing is bearish => currently giving a top sweep signal.
- H1 swing is bearish
- M15 swing is bearish
- We can look for selling opportunities according to the down structure of the M15 timeframe

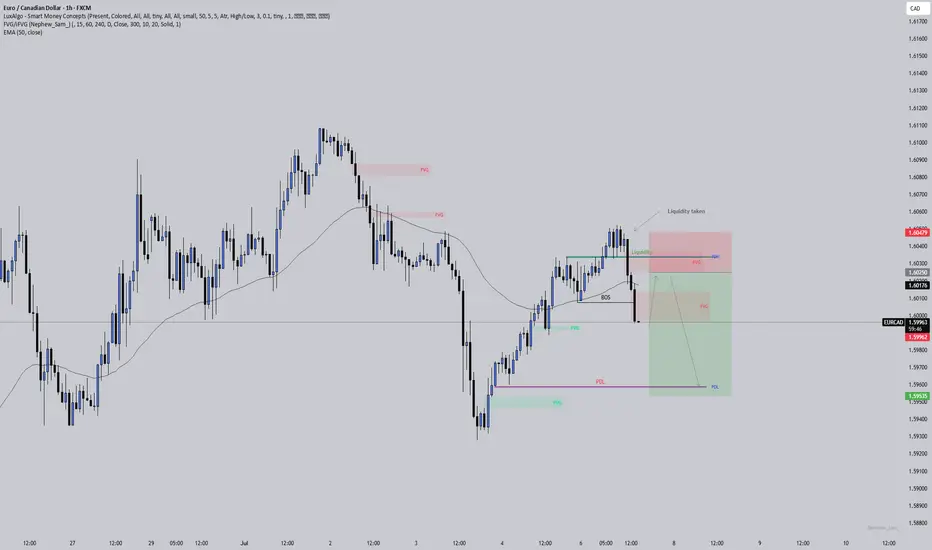
EURCAD: Liquidity taken, imbalance left behindPrice swept the liquidity above the previous day’s high and then broke structure to the downside. That’s often a sign that smart money was hunting stops before shifting direction. Now I’m watching for price to come back and fill the imbalance (FVG) it left after the break.
If that happens and price respects the FVG zone, we could see a continuation lower with the next target being the previous day’s low where more liquidity is likely sitting.
I’ve also added the 50 EMA here as confluence. It helps keep me trading in line with the broader market flow and stops me from fighting the trend.
This is one of those spots where patience is key . Let the market return to the zone on its own terms, wait for a reaction, and keep protecting your mindset just as carefully as your capital.
#EURUSD: Nothing to expect from DXY| View Changed Swing Trading|Hey there! So, we were previously thinking EURUSD was going to be bearish, but things have turned around and it’s looking bullish for now.
The extreme bearish pressure on USD has caused all the major USD pairs to be in a range. As the week goes on and we get the NFP data, the market will probably focus more on these economic indicators. So, it’s not surprising to see some market ranges during this time.
We’ll keep a close eye on the market, as there might be some manipulation going on this week.
We recommend waiting until Monday’s daily candle closes to see if the bullish trend is strong enough. Then, based on the price momentum, you can make your decisions.
We hope you have a great week and safe trading! If you like our work and analysis, please consider liking, commenting, and sharing our content.
Cheers,
Team Setupsfx
❤️🚀
skraaaaaa!!!check my previous post and you will see the before of this trade and a comprehensive explanation of my bias and analysis knowledge truly is power want learn SMC concept reach out to me and get a comprehensive understanding today
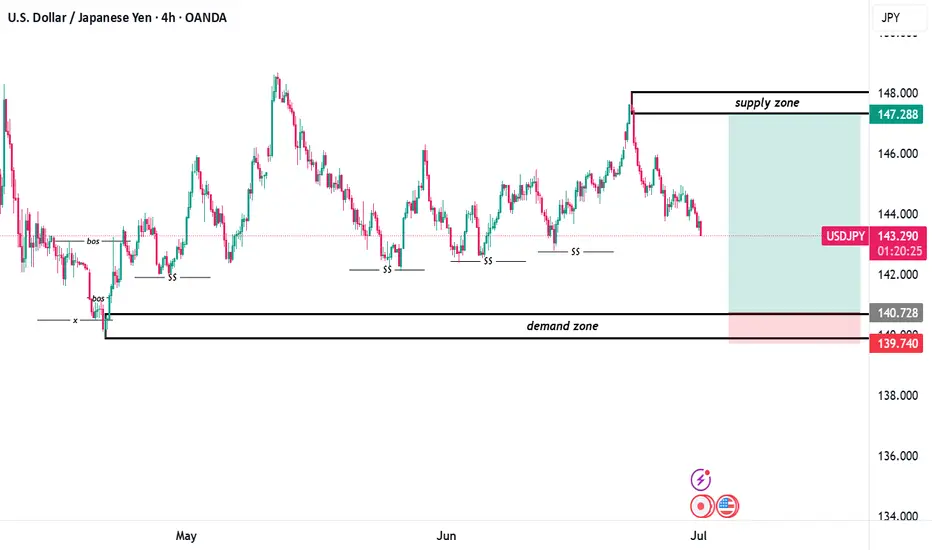
demand zone spotted... LET THE HUNTING BEGIN!!!📉 USD/JPY 4H Analysis – Demand Zone Revisit Expected
The pair is currently in a retracement phase after tapping into a higher-timeframe supply zone. Let's break down the structure and reasoning behind this setup:
1. Market Structure & Smart Money Footprints
• The chart begins with a clear Break of Structure (BOS) to the upside from a prior low, confirming a bullish shift.
• This upward move was supported by multiple Short-Term Supports (SS) that were respected throughout the bullish trend.
• Price has maintained a general uptrend structure, making higher lows and higher highs, but is now showing signs of a correction.
2. Supply and Demand Zones
• Supply Zone (147.288 – 148.000):
This is the last bearish zone before a sharp sell-off, indicating institutional selling pressure. Price tapped into this zone and has since reacted bearishly — a likely area where smart money took profits or initiated shorts.
• Demand Zone (139.740 – 140.728):
Marked from the origin of the bullish impulse and supported by a previous BOS, this is a critical area where institutional buying may resume. It also aligns with a liquidity sweep and previously unmitigated demand — a key confluence zone for potential longs.
3. Current Market Behavior
• Price is currently declining toward the demand zone, and based on structure, this is likely a healthy retracement.
• The chart suggests a buy limit setup at demand, with a tight stop just below 139.740 and a target near the previous supply reaction.
________________________________________
✅ Trade Idea
• Bias: Bullish from demand
• Entry: Around 140.728
• Stop Loss: Below 139.740
• Take Profit: 147.288 (just before the supply zone)
• Risk-to-Reward: Approx. 1:4
This setup assumes price will respect demand and continue the bullish structure, especially after multiple SS validations and a strong institutional reaction in the past.
🧠 Final Thoughts
This setup reflects classic Smart Money Concept principles:
• Structure shift via BOS
• Entry at unmitigated demand
• Exit just before major supply
• Strong confluence from price history and liquidity sweep zones
Wait for confirmation in the demand zone — a bullish engulfing, internal BOS, or FVG fill could give additional confidence to enter long.
NB: x represents previous liquidity sweep
$$ represents liquidity
bos represents break of structure
CHEERS TO WEALTH!!!
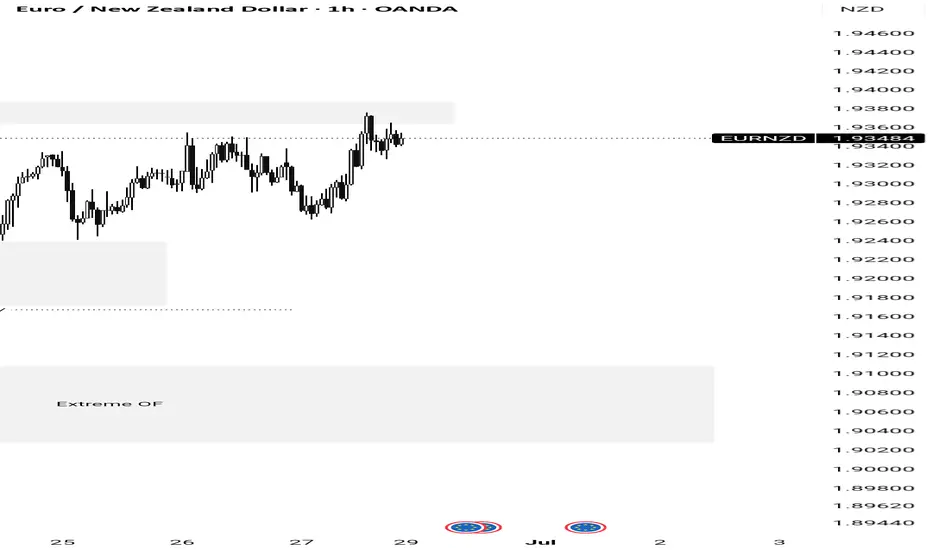
EuroNewzealand dollar.. a possible sell to Buy structure Price is still bullish from 4hr structure leg.. but I'll love to see a sell reaction come next week and here is why
From 4hr Timeframe, price has taken out the inducement and is respecting the structure demand level, but 1hr seems to 15min TF seems to be telling that price has invalidated a major bullish leg and will likely go the extreme of the structural leg before continuing the bullish trend
Whatever the price give come next week I'll react accordingly
#SMC concept
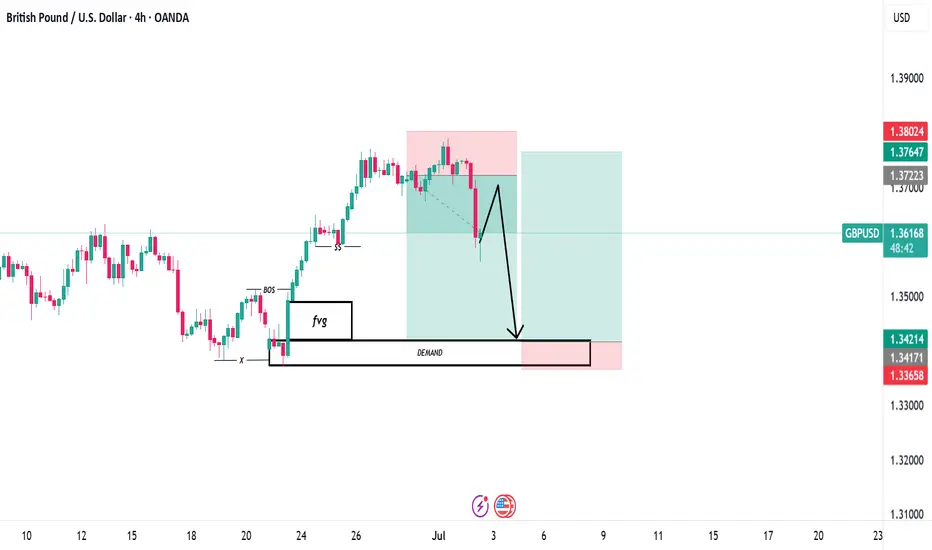
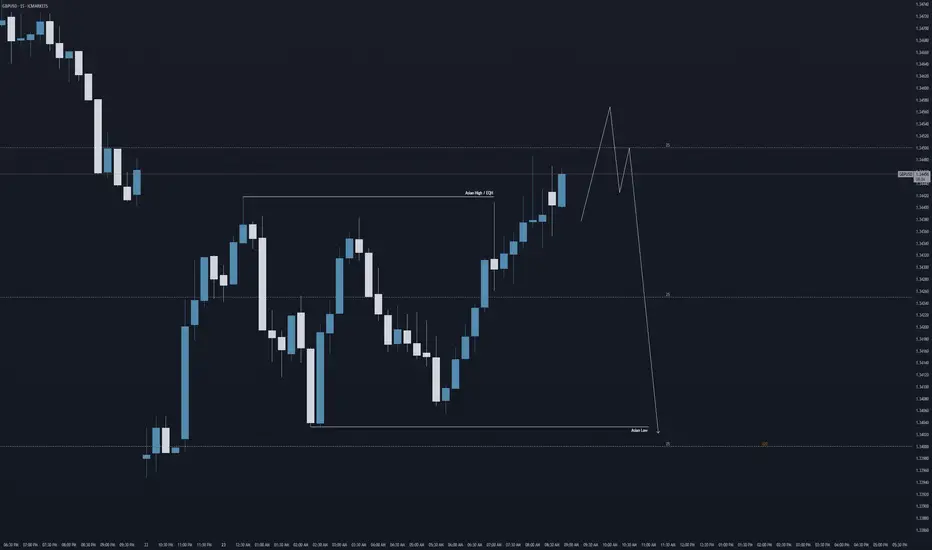
GU: Trading back towards 1.34 today?Hi everyone, hope you've all had a nice weekend.
Looking at GBP/USD this morning, keeping the forecast and analysis simple, but looking at a further bearish run today if we get the right lower time frame price action to confirm...
Looking at a sweep into 1.345 before trading lower, potentially towards 1.34.
Aman
Bearish Gold ideaThe idea is somehow risky due to geopolitical tensions in the middle east conflict, but it could still play out for short first then bullish to a new all time high.
Week of 6/15/25: AU AnalysisLast week took the prior week's high and showed large rejection. Expecting this week to take the weak low and liquidity from all the lows to at least the extreme of the daily swing.
Major news:
FOMC - Wednesday

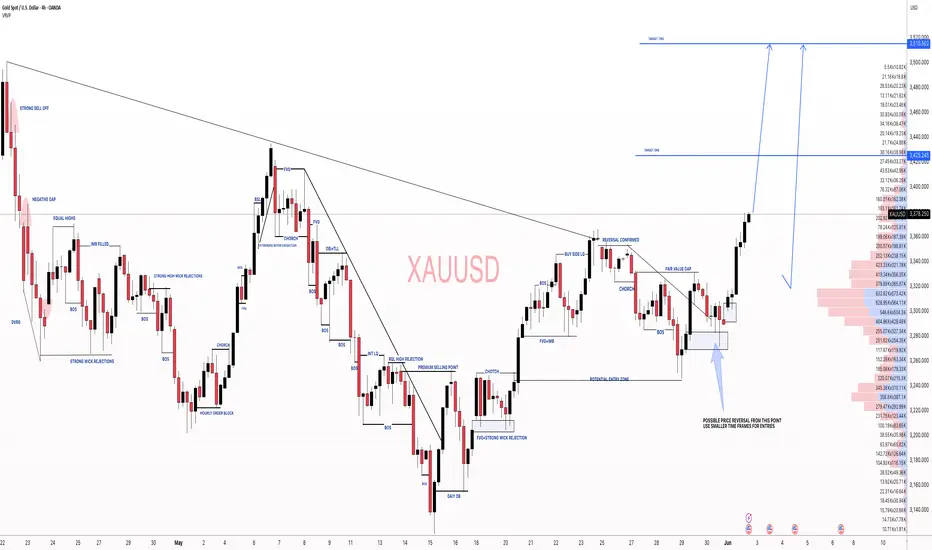
XAUUSD: +1500 TO +2200 PIPS Major Swing Move in Making, Two AreaThe first day of the trading week has seen Gold skyrocket, clearly indicating a bullish price direction. Our recent analyses had clearly shown this, and the volume confirms further bullish momentum. Additionally, the NFP news this Friday will be a trend changer, regardless of its positive or negative impact on the USD.
There are two potential take-profit targets. Before taking entry, please conduct your own analysis.
Good luck and trade safely,
Team Setupsfx_
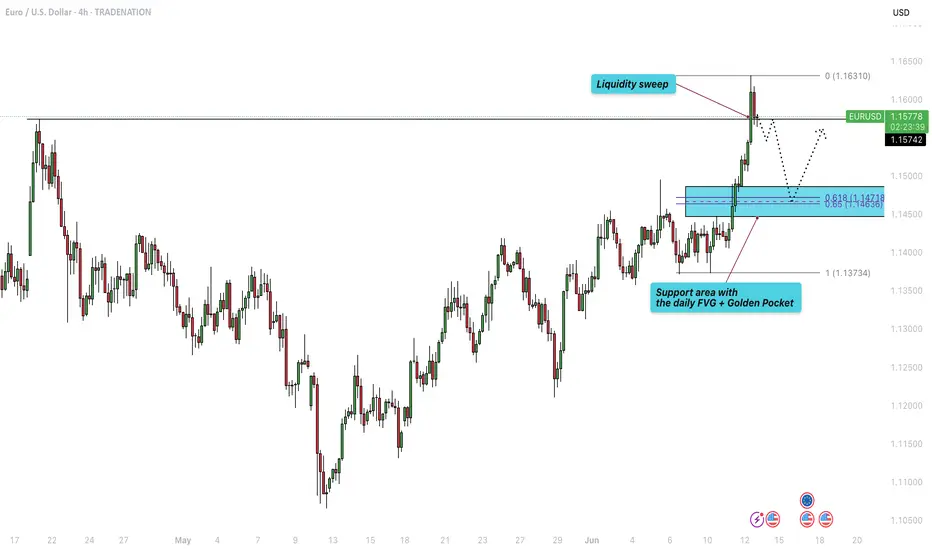
EUR/USD - Daily highs taken, now what?Introduction
The EUR/USD made a strong move higher today, establishing a clear uptrend on the 4-hour chart. With this latest push, it swept the daily liquidity above the previous high. The question now is whether the EUR/USD will continue moving higher or if there are opportunities for long entries at lower levels.
Liquidity Sweep
EUR/USD has taken out liquidity above the daily highs, where many stop losses are typically positioned. These stops have now been removed from the market. This area could potentially act as a support and resistance flip. However, if we see a 4-hour candle close below the previous daily high, further downside becomes likely.
Where Can We Look for Buys?
During the recent 4-hour move higher, significant progress was made. This upward movement created a daily Fair Value Gap (FVG) between $1.149 and $1.145. This FVG aligns perfectly with the golden pocket Fibonacci level, drawn from the swing low to the swing high. As a result, this zone forms a strong area of confluence for potential buy positions to target a retest of the highs.
Conclusion
Although we are currently breaking above the previous high, this move has yet to be confirmed as sustainable. Holding above this level is crucial. If a 4-hour candle closes below the previous high, it becomes likely that we will revisit the daily FVG and golden pocket Fibonacci zone.
Disclosure: I am part of Trade Nation's Influencer program and receive a monthly fee for using their TradingView charts in my analysis.
Thanks for your support.
- Make sure to follow me so you don't miss out on the next analysis!
- Drop a like and leave a comment!
Week of 6/8/25: EU AnalysisPrice has reached the extreme of daily bearish structure and we can see a rejection of the 4h latest push to make another high. We're following 1h internal bearish structure to at least take out the weak low, thus making 1h structure bearish and following that to the 4h extreme swing low.
Major news:
Core CPI - Wednesday
