WEEK OF 4/6/25: EURUSD AnalysisLast week ended bullish for the pair, but there is a correction occuring at the moment so we will follow the MTF internal structure (bearish) until it reaches the daily and 4h POI to look for bullish price action.
Internal MTF structure is always king and we will need that to shift before looking for longs.
Major news: Inflation - Thursday
Thanks for stopping by and goodluck!
Smctrading

WEEK OF 4/6/25: AUDUSDLast week was clearly bearish leading to all time frames being bearish.
Starting the week with a high probability POI to look for entry models from to take shorts to the next daily demand level.
Impactful news: Inflation 4/10
Thanks for stopping by and goodluck traders!

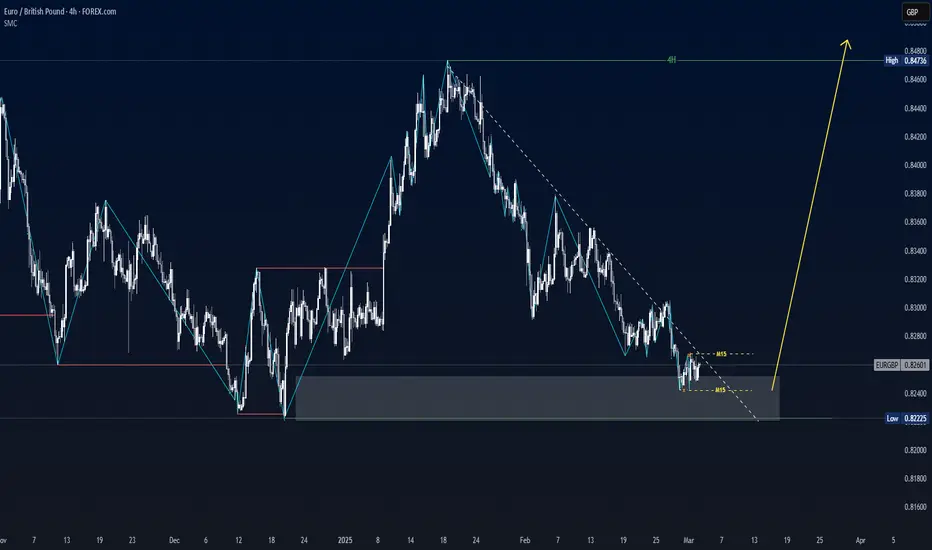
EURGBP Market Structure Analysis on 4 Hour Timeframe4H swing is bullish => current is pullback
M15 swing is bearish.
Currently giving CHoCH reversal signal.
We can look for buying opportunities in this area.
More carefully, we wait for the price to break the top to confirm the 15-minute reversal frame.
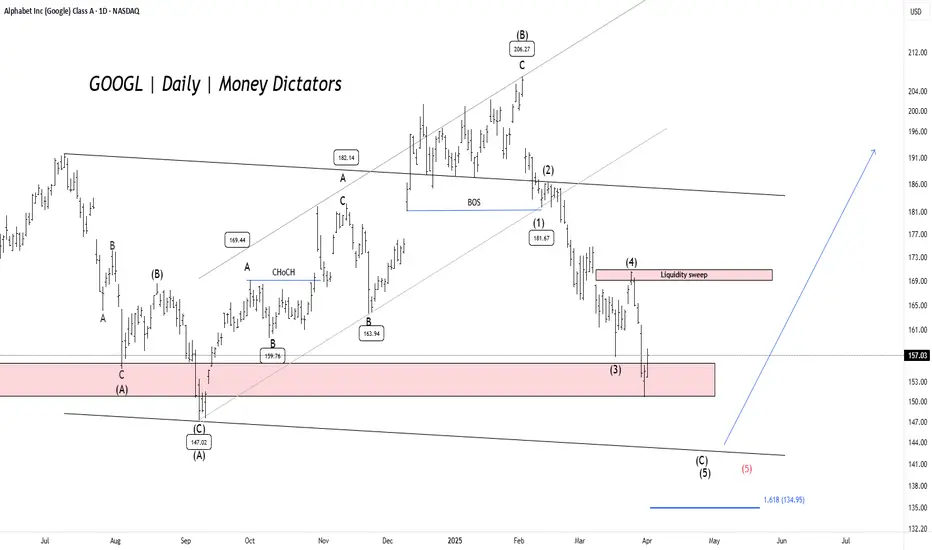
GOOGL - Elliott Wave Final ShowdownGOOGL has dropped over 27.28% , reaching a minor profit-booking zone. The $150 level serves as a key demand zone, where a potential price reversal could occur. The formation is either expanded flat or a running flat on the daily timeframe chart.
Confirmation is best observed near the lower trendline of the parallel channel. If bearish momentum persists, prices may decline further to the $142-$140 range before a strong rebound. Once the correction ends, the upside targets are $168, $180, and $195.
A new low will form if the previous low is breached. Further research will be uploaded soon.
ES1 2025-03-31 SPOOZ 15minOBHello everyone, I hope you won, stayed out, or learned something form the market today 😂.
Today was a easy grab.
Drawdown: 17. Tics
TP: 111. Tics Grabbed (out of 438)
Spooz Open Manipulation,
Broke near high,
Retraced to 15min Order Block,
TP Hit at 3 equal Highs (volume).
If you found this inciteful, join our group discussion! (link in bio)

Week of 3/30/25: EURUSD Weekly AnalysisEURUSD has healthy price action with the MTF switching to bullish, once MTF aligns with the daily, we're definitely good to go on longs. For now waiting for price action to show us that it wants to move higher.
Major news: NFP Friday
Thanks for coming, goodluck this week with your trades!

Week of 3/30/25: AUDUSD Weekly AnalysisWeekly analysis this week, price has been congesting and tightening the last 2 weeks, expecting hopefully a good move this week to breakout of consolidation.
Starting the week with a bearish bias.
Major News: NFP Friday
Thanks for stopping by, have a great trading week!

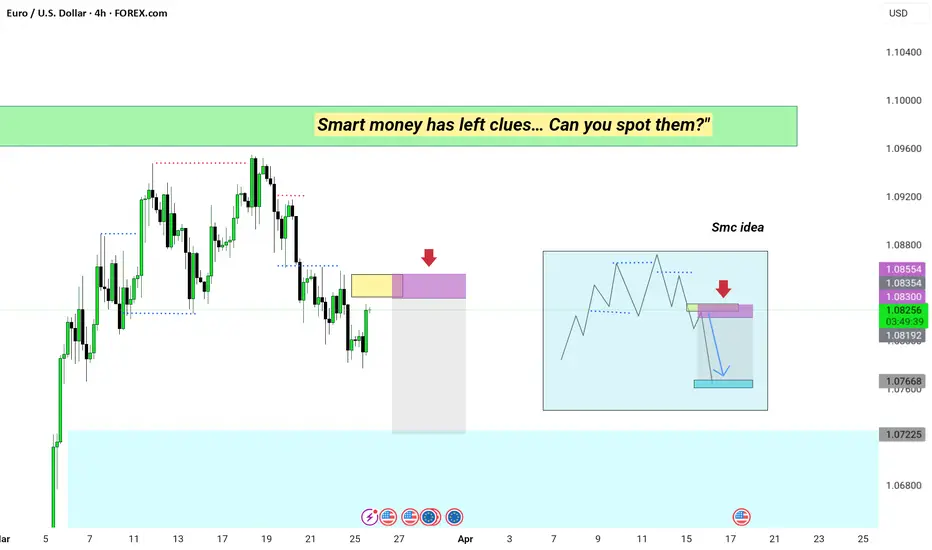
potential liquidity grab and sell-offEUR/USD Key Setup – Smart Money in Action! 🚀
The market is setting up for a potential liquidity grab and sell-off! 📉 Here’s the breakdown:
🔹 Price is approaching a key supply zone (highlighted in yellow & purple). A strong reaction here could indicate a short opportunity.
🔹 Invalidation level is clearly marked—if price breaks above, the setup is invalid.
🔹 Anticipated move: A rejection from the zone could lead to a drop towards the 1.07200-1.07600 demand area.
🔹 Confluence factors: Structure, liquidity, and institutional order flow align with this move.
📊 Trade Idea:
✅ Entry: Wait for a confirmation in the highlighted area
✅ Stop Loss: Above the invalidation level
✅ Take Profit: Lower demand zone
💡 Will this setup play out? Let’s see how the market reacts! Comment below with your thoughts! 🔥📉
#ForexTrading #EURUSD #SmartMoney #PriceAction #Liquidity #ForexSetup
Week of 3/23/25: EU AnalysisWeekly analysis of EU, my analysis shows bearish signals and where I am looking to trade from.
The chart looks very healthy for a daily retracement with the medium time frames aligning to it.
Only volatile news this week for me to watch out for is:
Unemployment Claims - Thursday
Let me know your thoughts, analysis, or what you'd like to see!
Thanks for watching, good luck this week, let's kill it.

Week of 3/23/25: AUDUSD AnalysisAnalysis of my main pair AUDUSD, last week resulted in the bears taking over and my analysis explains why my bias is bearish going into the new week.
Not much volatile news except for Unemployment Claims on Thursday.
Let me know what you guys think, your analysis, and if you want to see anything else!
Goodluck this week traders, let's kill it.

USDJPY Long SetupUSDJPY Looks Bullish, Previous Day Candle Has closed above Friday Candle and we still have a LTH not taken i think today we will be bullish we might have a correction drop down to 0.25 or 0.5 of the previous day and continue higher

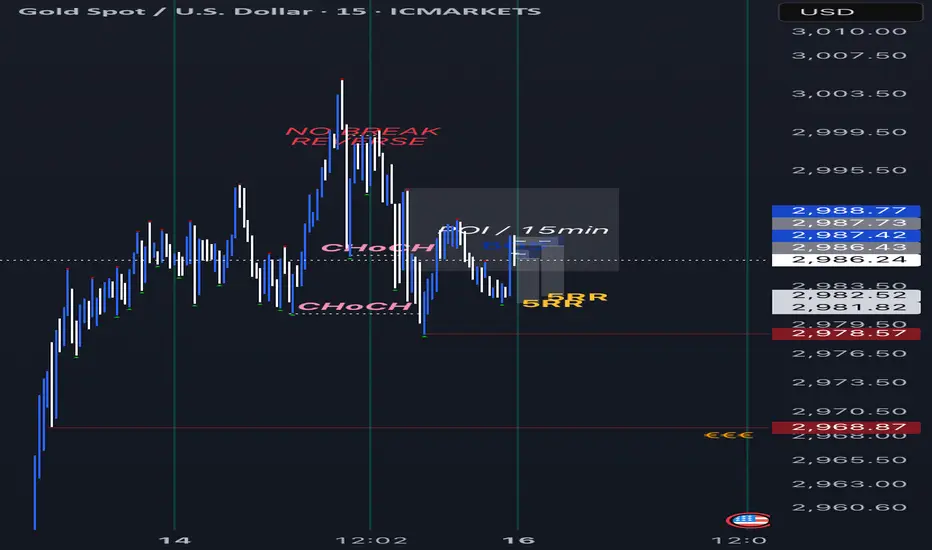
GOLD TRADE IDEA : SELL | SHORT (17/03)Gold is at a crossroads. After continuously breaking ATH records it is now looking tired. It has given me signs of a potential reversal. A break to the downside would confirm that. I have reason to believe that it’ll begin dumping the second smaller opens. Even then a break downwards would help us make a decision.
N.B.: This is not financial advice. Trade safely and with caution.
Week of 3/16/25: EURUSD Analysis FIRST VIDEO PUBLISH!First video publish, testing out my recording but also giving my insights for the week ahead. The candle color looks a bit off but hopefully it can be fixed for the next publish.
Pardon the background noise in the first few seconds of the video.
Let me know how the quality and your thoughts/analysis as well!
Happy trading and have a great week traders, let's win.

WHEAT Approaching Key Support - Will Price Rebound to 550$?PEPPERSTONE:WHEAT is approaching a key support level, an area where buyers have previously shown strong interest. The recent bearish movement suggests that price may soon be testing this level, potentially setting up for a rebound.
A bullish confirmation, such as a strong rejection pattern, bullish engulfing candles, or long lower wicks, would strengthen the case for a move higher. If buyers step in, the price could rally toward the 550$ target. However, a decisive breakdown below this support would invalidate the bullish scenario and could lead to further downside.
This is not financial advice but rather how I approach support/resistance zones. Remember, always wait for confirmation, like a rejection candle or volume spike before jumping in.
Best of luck , TrendDiva

USD | USD INDEX Weekly FOREX Forecast: March 10 - 14thIn this video, we will analyze the USD through the USD INDEX (DXY). We'll determine the bias for the upcoming week, and look for the best setups to take.
The USD is bearish, and there is plenty of economic news coming up this week. Should be plenty of opportunities from Tues through Friday.
Short term bullishness, in the form of a pullback, is potentially there. But longer term bearishness is likely to continue.
Enjoy!
May profits be upon you.
Leave any questions or comments in the comment section.
I appreciate any feedback from my viewers!
Like and/or subscribe if you want more accurate analysis.
Thank you so much!
Disclaimer:
I do not provide personal investment advice and I am not a qualified licensed investment advisor.
All information found here, including any ideas, opinions, views, predictions, forecasts, commentaries, suggestions, expressed or implied herein, are for informational, entertainment or educational purposes only and should not be construed as personal investment advice. While the information provided is believed to be accurate, it may include errors or inaccuracies.
I will not and cannot be held liable for any actions you take as a result of anything you read here.
Conduct your own due diligence, or consult a licensed financial advisor or broker before making any and all investment decisions. Any investments, trades, speculations, or decisions made on the basis of any information found on this channel, expressed or implied herein, are committed at your own risk, financial or otherwise.

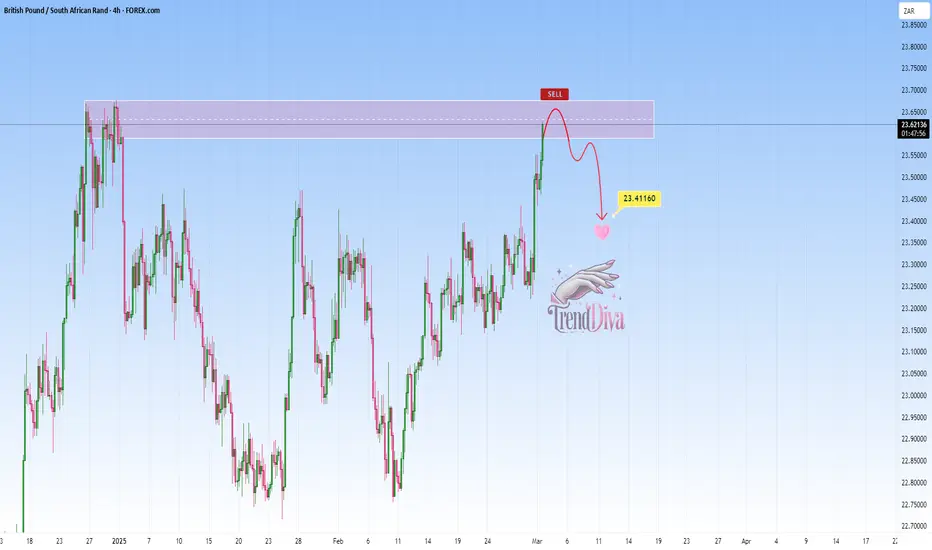
GBPZAR - Sell Setup at Key Resistance LevelOANDA:GBPZAR has reached a significant resistance zone, a level where sellers have consistently stepped in, leading to notable bearish reversals in the past. This area is marked by strong selling interest and historical price reactions, increasing the likelihood of a bearish move if sellers regain control.
The current price action suggests that if the pair confirms resistance through signals like bearish engulfing candles, long upper wicks, or increased selling volume, we could see a downward move toward 23.41160 — a logical target based on previous price behavior and market structure.
However, if the price breaks above this zone and sustains, the bearish outlook may be invalidated, opening the door for further upside.
Just my take on support and resistance zones—not financial advice. Always confirm your setups and trade with solid risk management.
Best of luck!
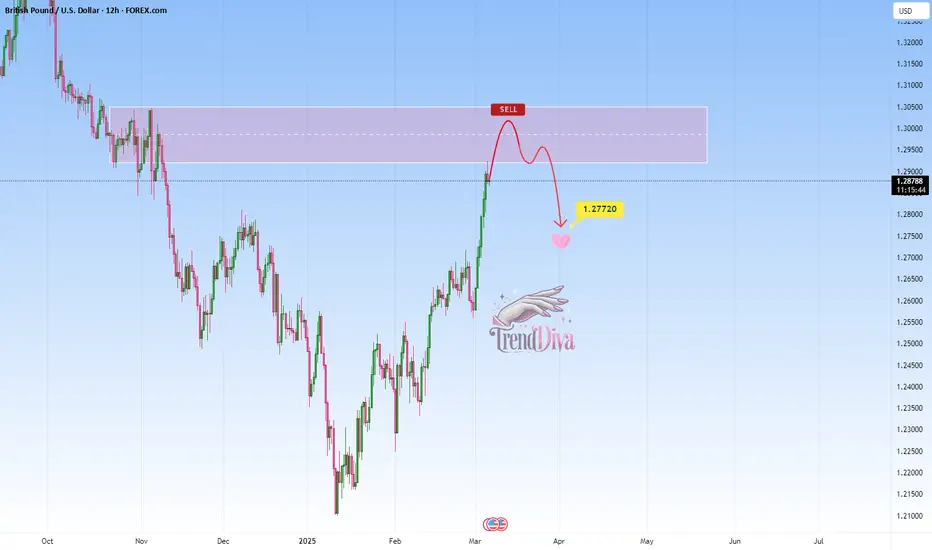
GBPUSD Approaching Key Resistance — Will It Drop to 1.27720?OANDA:GBPUSD is approaching a significant resistance zone, an area where sellers have previously stepped in to drive prices lower. This area has acted as a key supply zone, making it a level to watch for potential rejection.
If price struggles to break above and we see bearish confirmation, I anticipate a pullback toward the 1.27720 level.
However, a strong breakout and hold above resistance could invalidate the bearish outlook, potentially leading to further upside.
Just my take on support and resistance zones—not financial advice. Always confirm your setups and trade with solid risk management.
Best of luck!
EURJPY Approaching Major Support – Will Buyers Step In?OANDA:EURJPY is approaching a significant support zone, highlighted by previous price reactions and strong buying interest. This area has historically acted as a key demand zone, increasing the likelihood of a bounce if buyers step in.
The current market structure suggests that if the price confirms support within this zone, we could see a bullish reversal. A successful rebound could push the pair toward the 160.000 level, a logical target based on past price behavior and structural confluence.
Just my take on support and resistance zones—not financial advice. Always confirm your setups and trade with solid risk management.
Best of luck!

NICKEL — Sell Setup at Key Resistance ZonePEPPERSTONE:NICKEL has reached a significant resistance zone, marked by prior price rejections, suggesting strong selling interest. This area has previously acted as a key supply zone, increasing the likelihood of a bearish reversal if sellers step in.
If the price confirms resistance within this zone through bearish price action—such as wick rejections or lower timeframe weakness—we could see a move toward 15,804, which aligns with a logical target based on recent market structure.
However, if the price breaks and holds above this resistance area, the bearish outlook may be invalidated, potentially opening the door for further upside.
Just my take on support and resistance zones—not financial advice. Always confirm your setups and trade with solid risk management.
Best of luck!

Mastering ICT Concepts: The Ultimate Trading Strategy GuideA lot of people are drawn to ICT trading concepts because they offer a deep understanding of how the markets truly work. With this guide, I want to explain the most popular ICT strategies in a simple and detailed way to help traders navigate these concepts effectively. The Inner Circle Trader (ICT) methodology offers a suite of trading strategies that delve into market mechanics, focusing on institutional behaviors and liquidity dynamics. This guide explores five prominent ICT strategies: Fair Value Gaps (FVG), Power of Three (PO3), Inversion Fair Value Gaps (IFVG) with Liquidity Sweeps, Breaker Blocks, and the Silver Bullet Strategy. Each section provides an in-depth explanation, trading approach, key considerations, and designated spots for illustrative images.
🔍 1. Fair Value Gaps (FVG)
A Fair Value Gap (FVG) represents a price imbalance created when the market moves rapidly in one direction, leaving a gap between consecutive candlesticks. This gap signals inefficient pricing, which the market tends to revisit later to balance liquidity. Understanding FVGs is crucial as they reveal hidden institutional footprints.
How to Trade:
Identification: Spot an FVG when there is a three-candlestick formation where the second candle creates a gap between the high of the first candle and the low of the third candle.
Retracement Expectation: The market typically seeks to fill these gaps as it rebalances price inefficiencies.
Entry Strategy: Wait for price to return to the gap and enter in the direction of the initial impulse. Confirm the trade with market structure shifts or other confluence factors.
Targets: Use previous highs/lows, liquidity zones, or equilibrium levels (50% of the FVG) as potential targets.
Key Considerations:
Timeframes: Higher timeframes like 1-hour, 4-hour, and daily yield more reliable signals.
Volume Confirmation: High volume during the initial impulse strengthens the likelihood of a retracement.
Partial Fills: The market may not always fill the entire gap.
⚡ 2. Power of Three (PO3)
The Power of Three (PO3) describes how institutional players manipulate price action through three key phases: Accumulation, Manipulation, and Distribution. This strategy highlights how smart money engineers liquidity and misleads retail traders before delivering the intended price move.
How to Trade:
Accumulation Phase: Identify consolidation zones where price ranges sideways, often before major sessions (London or New York).
Manipulation Phase: Wait for false breakouts or stop hunts where price temporarily breaks out from the range before reversing.
Distribution Phase: Enter the trade in the opposite direction of the manipulation, targeting the liquidity created during the false move.
Entry Confirmation:
Market structure shifts after the manipulation phase.
Bullish or bearish order blocks aligning with the intended direction.
Fair Value Gaps in the distribution phase.
Key Considerations:
Patience: This strategy often requires waiting several hours for all three phases to complete.
Liquidity Zones: Look for equal highs or lows near the range to anticipate the manipulation move.
Time Windows: PO3 often plays out during high-volume sessions.
🔄 3. Inversion Fair Value Gaps (IFVG) with Liquidity Sweeps
Inversion Fair Value Gaps (IFVG) are advanced price inefficiencies that act as dynamic support or resistance zones. When price fills a traditional FVG, that zone can later serve as an IFVG—particularly when aligned with liquidity sweeps.
How to Trade:
Identify Original FVG: Locate an FVG that has already been filled.
Liquidity Sweep Trigger: Wait for price to sweep liquidity above or below a key level.
Inversion Zone: When price returns to the previous FVG, treat it as a new support or resistance zone.
Entry Confirmation: Watch for market structure shifts or rejection candles at the IFVG.
Key Considerations:
Confluence Zones: Combine IFVG with liquidity sweeps and order blocks.
Patience: Wait for price action confirmation before entering.
Stop Placement: Place stops below the IFVG in bullish setups or above in bearish setups.
🧱 4. Breaker Blocks
Breaker Blocks are zones where previous support or resistance levels are invalidated by a liquidity sweep, only to become reversal zones. They represent areas where smart money accumulates orders before delivering price in the opposite direction.
How to Trade:
Identify Liquidity Sweeps: Spot areas where price breaks above or below a key high/low before reversing.
Breaker Formation: The candle that invalidates the liquidity sweep forms the Breaker Block.
Entry Strategy: Wait for price to retrace into the Breaker Block and confirm the trade with rejection candles or market structure shifts.
Targets: Previous liquidity pools or opposing order blocks.
Key Considerations:
Higher Timeframes: Use 1-hour or 4-hour charts for the best results.
Volume Analysis: High volume during the breaker formation strengthens the signal.
Risk Management: Place stops beyond the breaker boundary.
🎯 5. Silver Bullet Strategy
The Silver Bullet Strategy is a time-based model designed to capitalize on institutional price delivery patterns during specific one-hour windows. This strategy focuses on liquidity sweeps and Fair Value Gaps within these timeframes.
How to Trade:
Time Windows: Target these key one-hour sessions:
London Open: 03:00 AM – 04:00 AM EST
New York AM Session: 10:00 AM – 11:00 AM EST
New York PM Session: 02:00 PM – 03:00 PM EST
Identify Liquidity Zones: Look for equal highs/lows or session highs/lows.
Execute Trades: Enter trades when price sweeps liquidity and rejects from an FVG or Breaker Block within the Silver Bullet window.
Targets: Use opposing liquidity pools or session extremes.
Key Considerations:
Strict Timing: Only trade within the designated time windows.
Confluence Factors: Combine with market structure shifts and order blocks.
Risk Management: Place stops beyond liquidity sweep wicks.
Conclusion
Mastering ICT trading strategies requires patience, precision, and continuous practice. These five strategies—FVG, PO3, IFVG with Liquidity Sweeps, Breaker Blocks, and the Silver Bullet—provide a comprehensive framework to align with institutional price delivery. Use confluence factors and practice in demo environments before applying these methods in live markets.
Happy Trading!
Note: This guide is for educational purposes only and not financial advice.
__________________________________________
Thanks for your support!
If you found this guide helpful or learned something new, drop a like 👍 and leave a comment, I’d love to hear your thoughts! 🚀
US30 Analysis: Demand Zone Rejection – Reversal Incoming? The Dow Jones (US30) is experiencing high volatility as investors digest recent economic data and Federal Reserve statements. The latest U.S. ISM Services PMI came in stronger than expected, signaling economic resilience 📊, but concerns remain about inflation and the Fed’s next move on interest rates 💰.
🔹 Key Market Drivers:
✅ Federal Reserve Rate Decision – Hawkish or Dovish? 🏦
✅ Upcoming NFP Data – Job growth impact on the index 📉📈
✅ Bond Yields & USD Strength – Affecting institutional risk appetite 💵
With economic uncertainty still in play, traders are looking for key structural levels to position themselves in the market.
🔍 Technical Analysis (1H Chart)
US30 is reacting from a strong demand zone (42,400 - 42,500), showing a possible reversal after a liquidity grab below recent lows.
📊 Key Observations:
🔹 Break of Structure (BoS) at the lows, signaling potential bullish momentum ✅
🔹 Change of Character (ChoCh) – Early signs of a shift from bearish to bullish 📈
🔹 Premium/Discount Zone – Price is in a discounted area, offering potential long entries 💰
🔹 Liquidity Sweep – Stops taken out before an impulsive move upward 🚀
🎯 Trade Setup & Targets:
📍 Bullish Bias: Looking for long entries from the 42,400 - 42,500 demand zone
🎯 First Target: 43,112 (mid-range resistance)
🎯 Second Target: 43,858 (supply zone)
🚨 Invalidation: Below 42,400 – If price breaks lower, expect further downside
💡 Confluence: The combination of smart money concepts (BoS, ChoCh, liquidity grab) and fundamental factors supports a potential bullish reversal. Traders should watch price action closely and confirm momentum before entering.
👀 Final Thoughts
US30 is showing signs of demand zone strength, but macroeconomic risks remain. Traders should stay cautious and monitor how price reacts at key levels. A confirmed break above 43,112 could fuel a rally toward 43,858 and beyond.
📊 How are you trading US30 this week? Bullish or Bearish? Let’s discuss below! ⬇️🔥

EURAUD Bullish Momentum in Play — Targeting 1.69500OANDA:EURAUD is trading within a well-defined ascending channel, with price action respecting both the upper and lower boundaries. The recent bounce off the midline suggests buyers are maintaining control, supporting a potential continuation of the uptrend.
As long as the price remains above the support level and the channel's lower boundary holds, the bullish structure remains intact.
A potential upside target is 1.69500, aligning with the upper boundary of the channel. A break and close above this level could signal further bullish momentum.
However, a breakdown below the green support zone would invalidate the bullish scenario and may open the door for a deeper pullback.
Remember, always confirm your setups and trade with solid risk management.
Best of luck!
