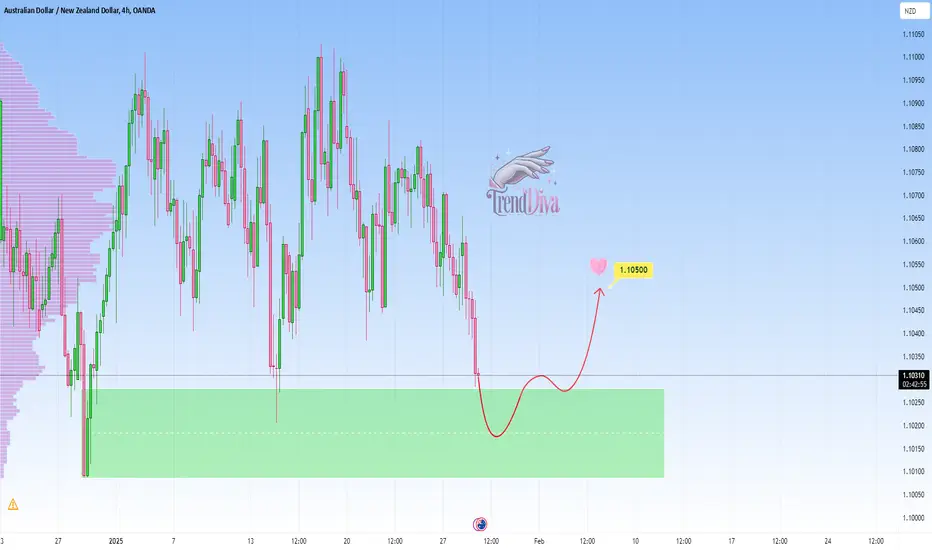
AUDNZD – Potential Long from Key Support ZoneOANDA:AUDNZD is approaching a key demand zone, which has previously led to bullish reversals. The recent downward move brings price into this support area, signaling a potential opportunity for buyers to step in.
A bullish confirmation, such as a strong rejection pattern, bullish engulfing candle, or long lower wick, would support the likelihood of an upward move. If buyers regain control, the price could rally toward 1.10500.
This is not financial advice but rather how I approach support/resistance zones. Remember, always wait for confirmation, like a rejection candle or volume spike before jumping in.
Please boost this post, every like and comment drives me to bring you more ideas! I’d love to hear your perspective in the comments.
Best of luck , TrendDiva
Smctrading
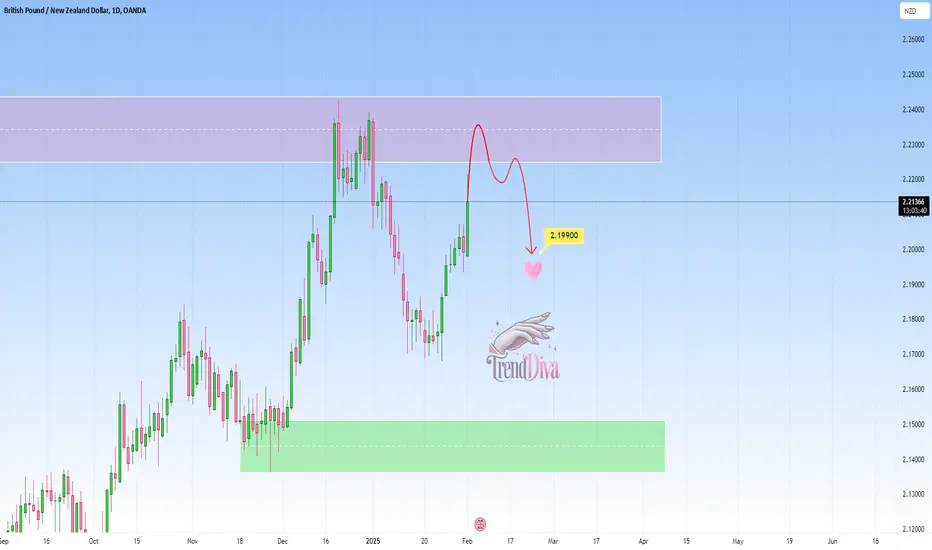
GBPNZD Approaching Key Resistance – Potential Sell SetupOANDA:GBPNZD is approaching a critical resistance zone that has previously attracted strong selling interest, making it a key level to watch.
If rejection signals appear, such as bearish engulfing candles or increased selling volume, I anticipate a move toward 2.19900. However, if the resistance fails to hold, it may open the door for further upside.
This is not financial advice but rather how I approach support/resistance zones. Remember, always wait for confirmation, like a rejection candle or volume spike before jumping in.
Please boost this post, every like and comment drives me to bring you more ideas! I’d love to hear your perspective in the comments.
Best of luck , TrendDiva
NZDHUF – Potential Long from Key Support ZonePEPPERSTONE:NZDHUF has reached a key support level, which has historically acted as a strong demand zone, leading to bullish reversals. The recent decline into this area suggests a potential opportunity for buyers to regain control and push prices higher.
A bullish confirmation, such as a strong rejection pattern, bullish engulfing candle, or long lower wick, would strengthen the case for an upward move. If buyers step in, price could rally toward 222.600. This setup aligns with a short-term bullish outlook within the broader market structure.
This is not financial advice but rather how I approach support/resistance zones. Remember, always wait for confirmation, like a rejection candle or volume spike before jumping in.
Please boost this post, every like and comment drives me to bring you more ideas! I’d love to hear your perspective in the comments.
Best of luck , TrendDiva

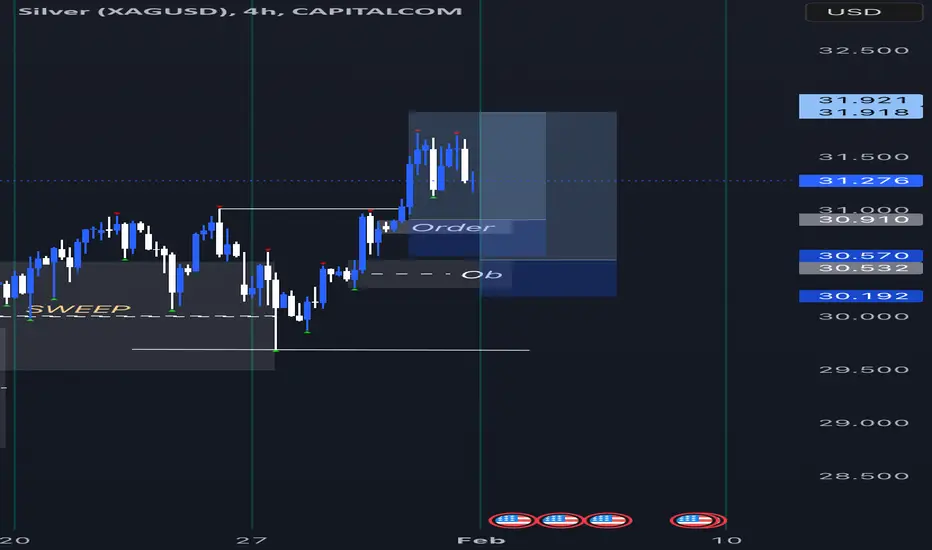
SILVER TRADE IDEA: LONG | BUY (03/02)Clear bias being shown. Price rallied up only to pull back. Last order lock is so clear
RR1: 2.96
RR2: 4.09
Realistically you can let it go too. There’s better TP prospects.
N.B.: This is not financial advice. Trade safely and with caution.
CADJPY - Buy Setup at Clear Support LevelOANDA:CADJPY is approaching a strong support zone, an area that has previously attracted buyers. The recent bearish momentum has pushed price closer to this zone, making it a key level to watch for potential buying interest.
If buyers step in and confirm the support with bullish price action—such as rejection wicks, bullish engulfing candles, or increasing buying volume—I anticipate a move toward 107.710. However, if price breaks below this level, it could signal further downside and invalidate the bullish outlook.
This is not financial advice but rather how I approach support/resistance zones. Remember, always wait for confirmation, whether it’s a strong rejection candle or a spike in volume, before making a move.
Your support means the world! Every like and comment motivates me to share more insights. Also, let me know your thoughts in the comments—I’d love to hear your perspective!
Best of luck , TrendDiva

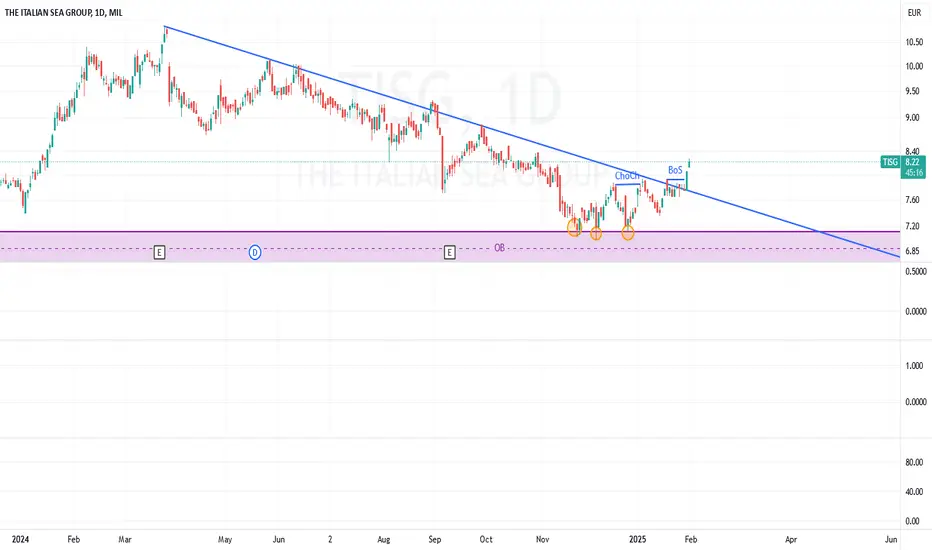
TISGReversal from a downtrend to an uptrend, bullish ChoCh, BOS, buy signal on weekly data from MACD.
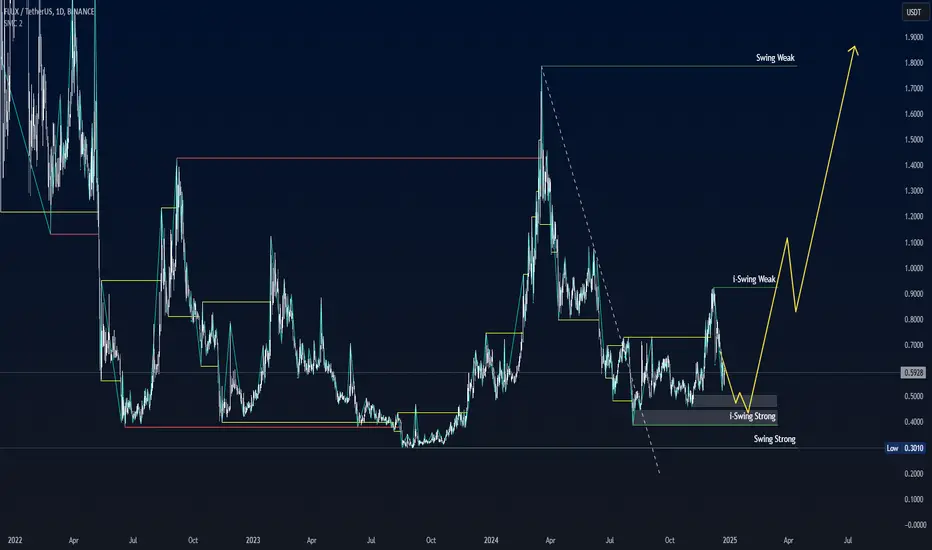
FLUXUSD wave structure analysis on daily time frameDay swing is bullish => currently is pullback.
Internal structure of daily time frame gives bullish reversal signal.
We can look for investment opportunities in this same bridge
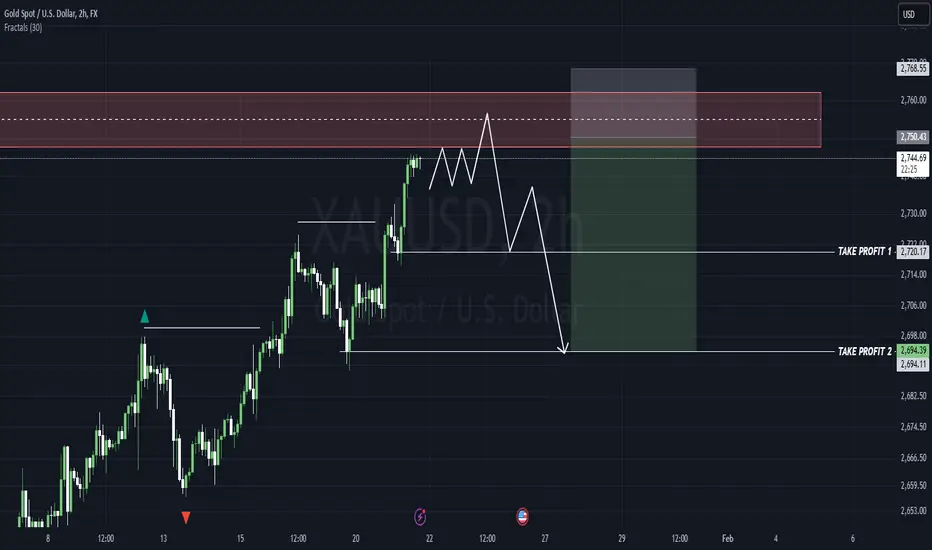
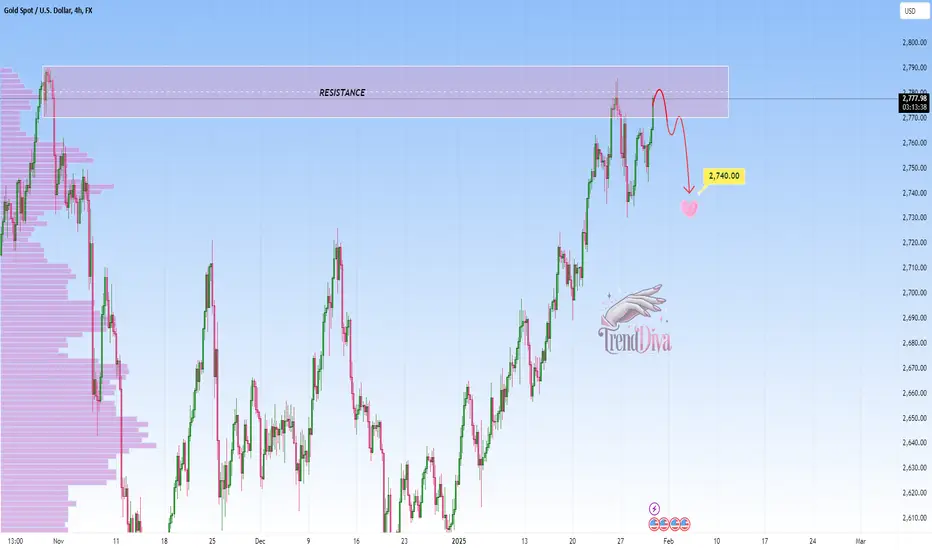
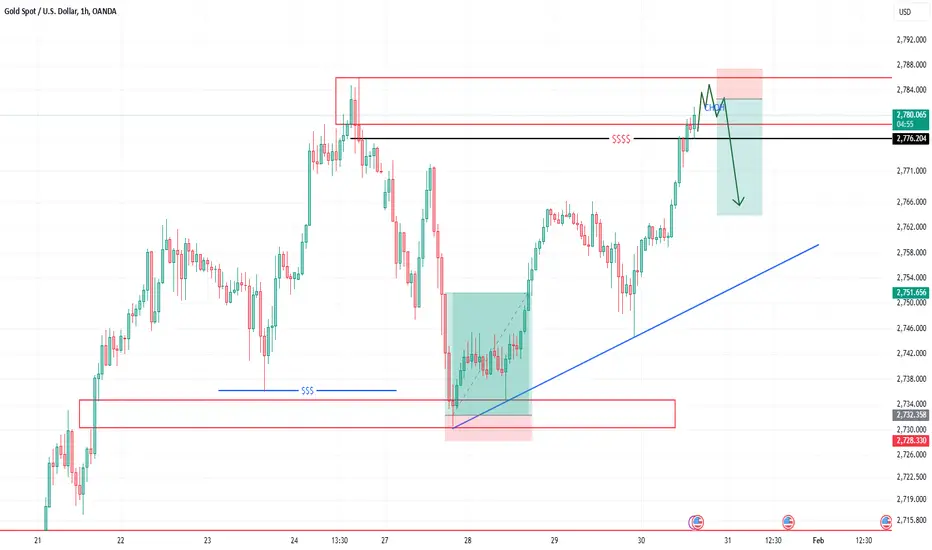
GOLD at Critical Resistance – Reversal Incoming?OANDA:XAUUSD is trading at a key resistance zone, a level where sellers have previously taken control. If buyers fail to break through, we could see a rejection that sends the price lower toward $2,740.
I anticipate a move downward if we get bearish confirmation—such as rejection wicks, a bearish engulfing candle, or weakening buying pressure. However, a strong breakout and sustained hold above this zone could invalidate the setup, shifting momentum bullish and opening the door for new highs.
This is not financial advice but rather how I approach support/resistance zones. Remember, always wait for confirmation, like a rejection candle or volume spike before jumping in.
Please boost this post, every like and comment drives me to bring you more ideas! I’d love to hear your perspective in the comments.
Best of luck , TrendDiva
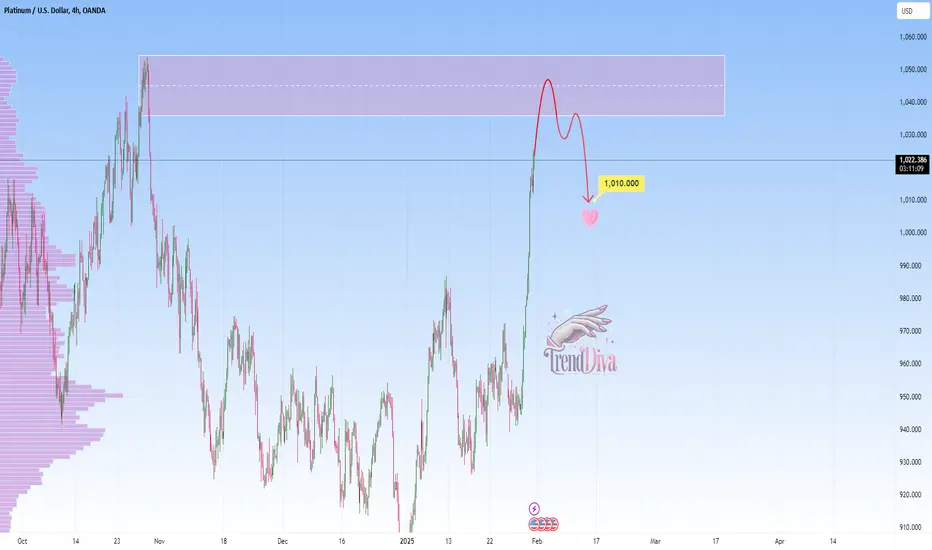
Platinum Approaching Key Resistance — Will It Drop to 1,010$?OANDA:XPTUSD is approaching a significant resistance zone, an area where sellers have previously stepped in to drive prices lower. This area has historically acted as a supply zone, making it a key level to watch for potential rejection.
If price struggles to break above and we see bearish confirmation—such as rejection wicks, a bearish engulfing candle, or weakening bullish momentum—I anticipate a pullback toward the $1,010 level. However, a strong breakout and hold above resistance could invalidate the bearish outlook, potentially opening the door for further upside.
This is not financial advice but rather how I approach support/resistance zones. Remember, always wait for confirmation, like a rejection candle or volume spike before jumping in.
Please boost this post, every like and comment drives me to bring you more ideas! I’d love to hear your perspective in the comments.
Best of luck , TrendDiva
Bullish Setup on CHFJPY — Watching for Confirmation!OANDA:CHFJPY has reached a critical demand area where buyers have previously stepped in, leading to strong bullish momentum. This zone has historically provided a solid base for upward momentum, making it a key level to watch.
If we see bullish confirmation—such as rejection wicks, bullish engulfing candles, or a surge in buying volume—I anticipate a move toward 171.180, aligning with previous market structure. However, a decisive breakdown below this zone could weaken the bullish outlook and shift momentum downward.
This is not financial advice but rather how I approach support/resistance zones. Remember, always wait for confirmation, like a rejection candle or volume spike before jumping in.
Please boost this post, every like and comment drives me to bring you more ideas! I’d love to hear your perspective in the comments.
Best of luck , TrendDiva

GOLD ANALYSIShi guys
If you look carefully, there is a liquidity line right next to our OB, which means that the price is MOST likely (90%) to react to the area.
Considering that the general structure of the market is bullish,A bearish position is high risk, that's why I am waiting for the confirmation of the fall, which in fact is a CHOH that i show in chart.
this is just a analyse and The final decision of the position is yours and find entry points according to your own strategy
EURGBP - Bearish Setup at Key ResistanceThe EURGBP pair is approaching a notable supply zone, where sellers have previously regained control and driven prices lower. This area has historically acted as resistance, suggesting the potential for bearish continuation.
A confirmation of selling pressure, such as a bearish engulfing pattern or multiple rejection wicks at the resistance level, would increase the likelihood of a downward move. If the selling momentum materializes, the price could target the 0.83586 level.
What are your thoughts on this outlook?

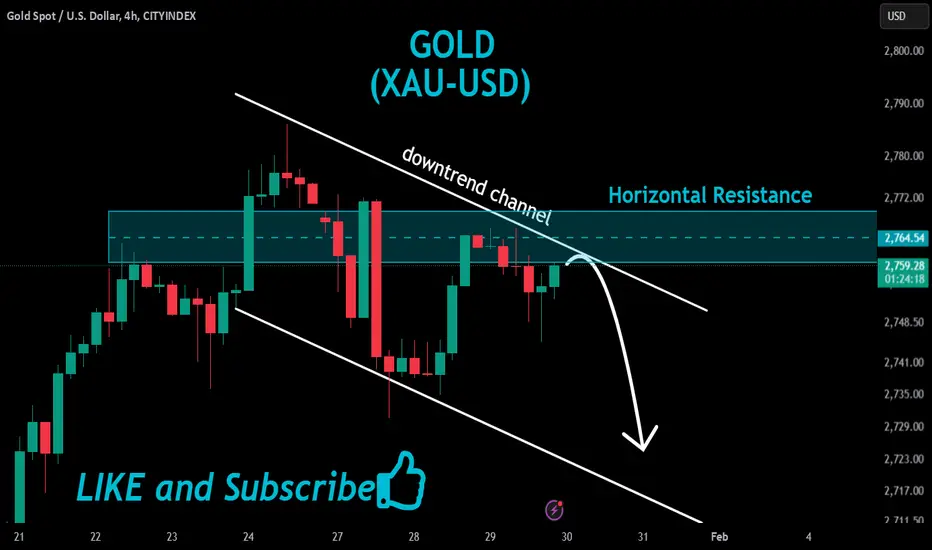
GOLD Resistance Ahead!
HI,Traders !
GOLD is trading in an uptrend but
over the medium term it has formed
a downtrend channel But hit a horizontal
Supply level of 2764.54
From where a local bearish
Correction is to be expected !
Comment and subscribe to help us grow !
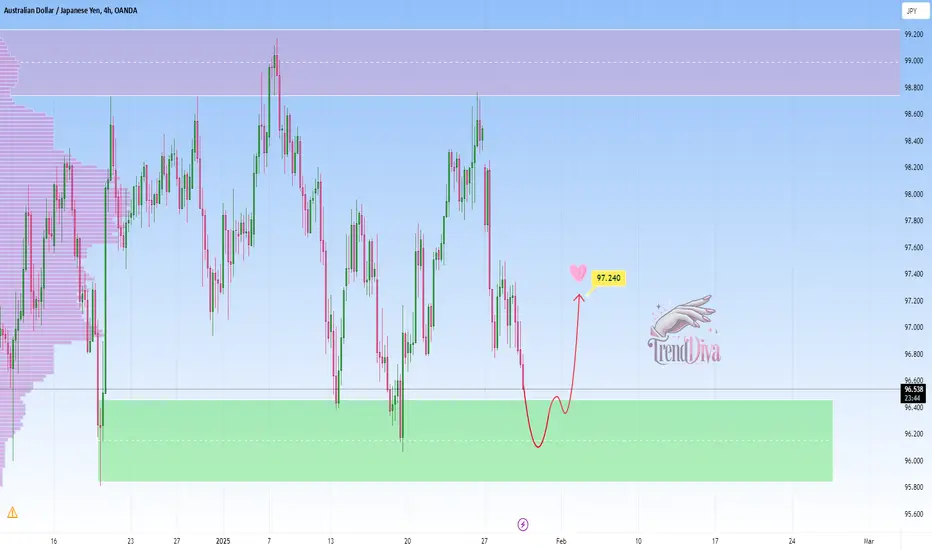
AUDJPY - Buy Opportunity at Key Support LevelOANDA:AUDJPY is approaching a significant support zone, where buyers have previously stepped in, leading to strong bullish reactions. The recent decline suggests a potential buying opportunity if the price shows signs of reversal.
A bullish confirmation, such as a strong rejection candle or a bounce from support, could indicate a move toward 97.240. However, a break below the support zone could invalidate this setup, signaling further downside.
This is not financial advice but rather how I approach support/resistance zones. Remember, always wait for confirmation, like a rejection candle or volume spike before jumping in.
Please boost this post, every like and comment drives me to bring you more ideas! I’d love to hear your perspective in the comments.
Best of luck , TrendDiva
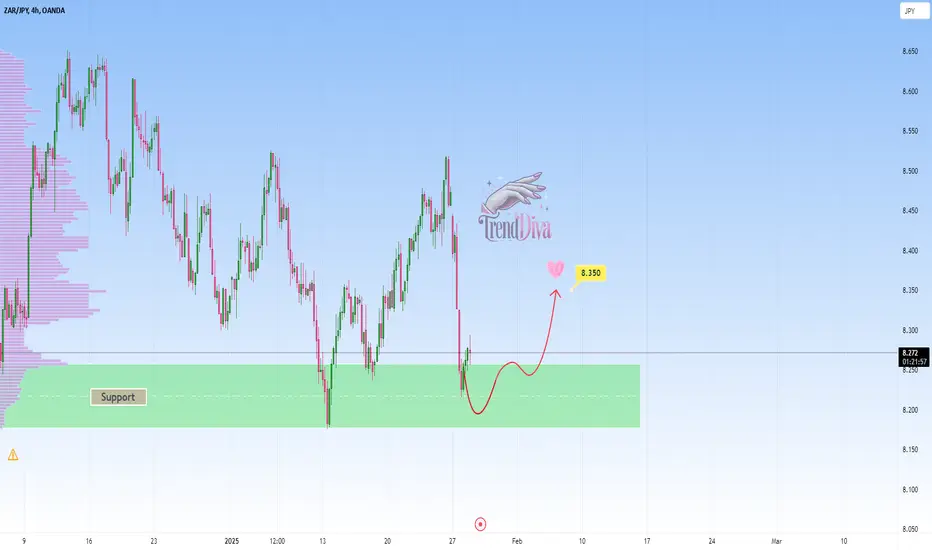
ZARJPY - Potential Long from Key Support ZoneOANDA:ZARJPY is currently testing a significant support zone. The recent decline into this zone suggests a potential for buyers to regain control and push prices higher.
A bullish confirmation, such as a strong rejection pattern, bullish engulfing candles, or long lower wicks, would indicate an increased likelihood of a move upward. If this scenario unfolds, the price may head toward the 8.350 level.
This setup aligns with a potential short-term rebound within the broader market structure.
This is not financial advice but rather how I approach support/resistance zones. Remember, always wait for confirmation, like a rejection candle or volume spike before jumping in.
Please boost this post, every like and comment drives me to bring you more ideas! I’d love to hear your perspective in the comments.
Best of luck , TrendDiva
NZDSGD - Potential Long from Key Support ZoneOANDA:NZDSGD is approaching a key support level that has previously acted as a strong demand zone, leading to bullish momentum. The recent decline into this area suggests a potential opportunity for buyers to step in and push prices higher.
A bullish confirmation, such as a strong rejection pattern, bullish engulfing candle, or long lower wick, would increase the likelihood of an upward move. If buyers regain control, the price may head toward the 0.76630 level. This setup indicates a potential short-term rebound within the broader market structure
This is not financial advice but rather how I approach support/resistance zones. Remember, always wait for confirmation, like a rejection candle or volume spike before jumping in.
Please boost this post, every like and comment drives me to bring you more ideas! I’d love to hear your perspective in the comments.
Best of luck , TrendDiva

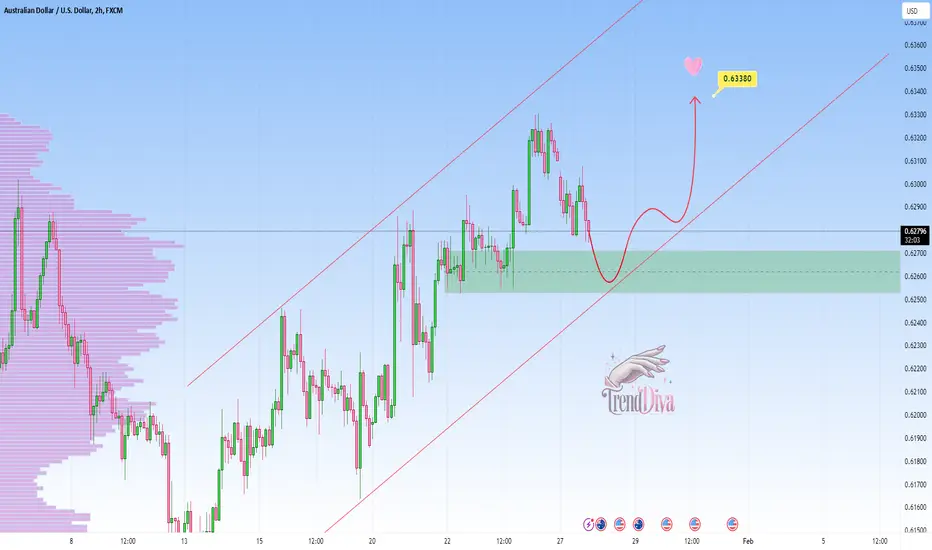
AUDUSD - Potential Bullish Continuation SetupOANDA:AUDUSD is currently trading within a well-defined ascending channel, reflecting a strong bullish market structure. The price is approaching a key support zone, which aligns with the lower boundary of the channel.
If the price holds at this support and buyers step in, a bullish continuation toward the 0.63380 level is likely, making it a reasonable target for an upward move.
Trade Considerations:
Wait for confirmation of buying pressure before entering a position.
Monitor for invalidation if the price breaks below the demand zone and the channel boundary, as this would signal potential downside momentum.
This is not financial advice but rather how I approach support/resistance zones. Remember, always wait for confirmation, like a rejection candle or volume spike before jumping in.
Please boost this post, every like and comment drives me to bring you more ideas! I’d love to hear your perspective in the comments.
Best of luck , TrendDiva
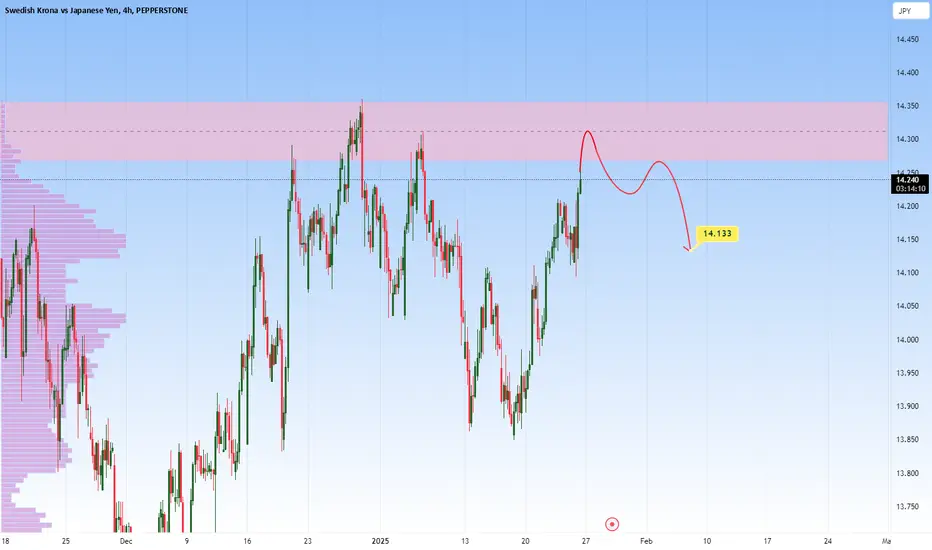
SEKJPY at Major Resistance - Could it Reach 14.133?SAXO:SEKJPY is approaching a key resistance level that has previously triggered bearish reversals. While current bullish momentum has driven the price into this zone, it could present an opportunity for sellers to step in.
If bearish signals such as rejection wicks or bearish engulfing candles appear, a move toward 14.133 could follow. On the other hand, a breakout above this resistance would invalidate the bearish bias and signal potential for further upside.
Key Takeaway: Wait for clear rejection patterns before considering short positions.
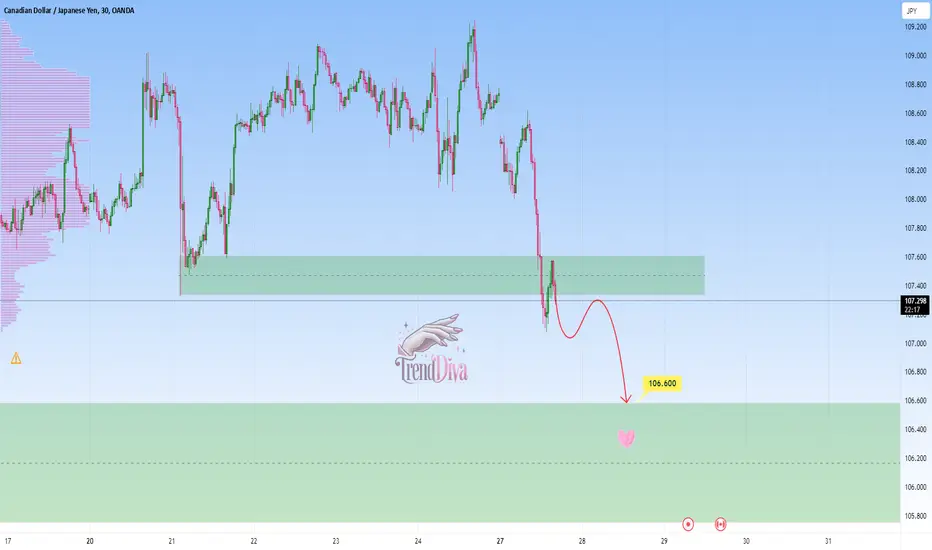
CADJPY - Bearish Continuation After Support BreakOANDA:CADJPY has broken through a key support level and is now retesting this level as resistance. If the resistance holds, it could pave the way for a deeper move downward, with the 106.600 level emerging as the next major area of interest. This level also aligns with a significant support zone, making it a critical area where buyers may attempt to regain control.
Traders are advised to monitor for bearish confirmation signals, such as bearish engulfing candlestick patterns, rejection wicks, or strong selling volume at the retested resistance level. Such signals would reinforce the probability of a continuation to the downside. However, a decisive break back above the resistance zone would invalidate the bearish scenario
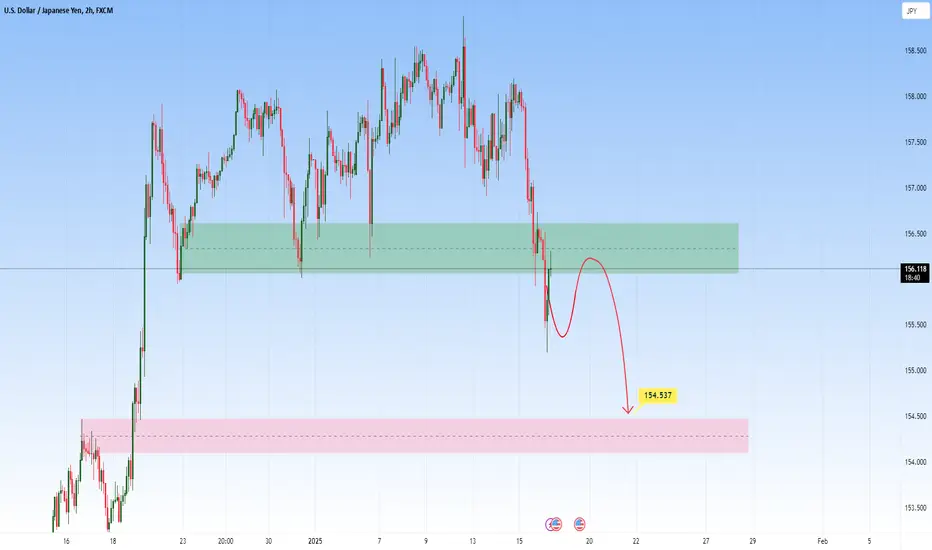
USDJPY – Break & Retest Short SetupThe USDJPY pair has recently broken below a key support level. This area could potentially act as resistance, presenting a classic break-and-retest scenario.
A bearish confirmation, such as rejection wicks, bearish engulfing candles, or strong selling pressure, would validate the potential for a short setup. If sellers step in at this level, the next downside target could be the 154.537 zone.
Traders should monitor the retest closely for clear signs of rejection before committing to short positions.
GBPCAD - Bearish Momentum Expected from Resistance ZoneOANDA:GBPCAD is currently testing a significant resistance zone. This level has previously acted as resistance, leading to a bearish reversal. The recent upward momentum into this zone suggests a potential for sellers to regain control and push prices lower.
A bearish confirmation, such as a rejection candle, bearish engulfing pattern, or signs of fading bullish momentum, would indicate an increased likelihood of a move downward. If this scenario unfolds, the price could head toward the 1.78220 level.
This setup aligns with a potential short-term correction after an impulsive move. Traders should wait for confirmation of selling pressure before considering short positions.
This is not financial advice but rather how I approach support/resistance zones. Always wait for confirmation, like a rejection candle or volume spike before jumping in. And let me know what you think of this setup in the comments!

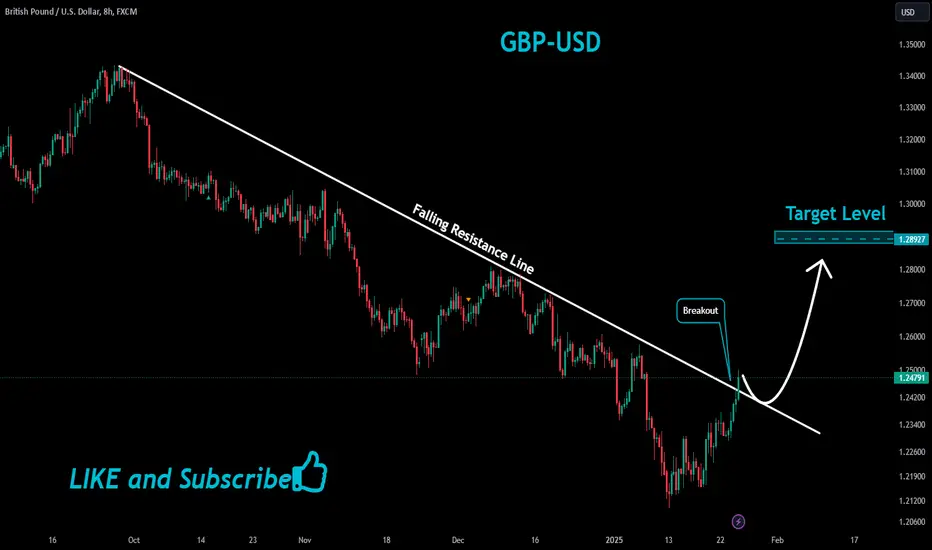
GBPUSD Bullish Breakout!
HI,Traders !
GBP-USD was trading
Beneath the falling resistance
Line but now we are seeing a
Bullish breakout so we are
Now locally bullish biased
And we will be expecting a
Further bullish move up !
Comment and subscribe to help us grow!
GOLD TODAY'S EXPECTED MOVEIn this analysis we are focusing on 2H time frame for finding the upcoming moves and changes in Gold price. So let's see what's happens and which opportunity market will give us.
Make sure Bearish confirmation must important, when you execute your trade.
Always use stoploss for your trade.
Always use proper money management and proper risk to reward ratio.
This is just my analysis or prediction.
Feel free to share your thoughts on this in the comments below. I’d love to hear your reflections.
#XAUUSD 2H Technical Analysis Expected Move.