Smctrading
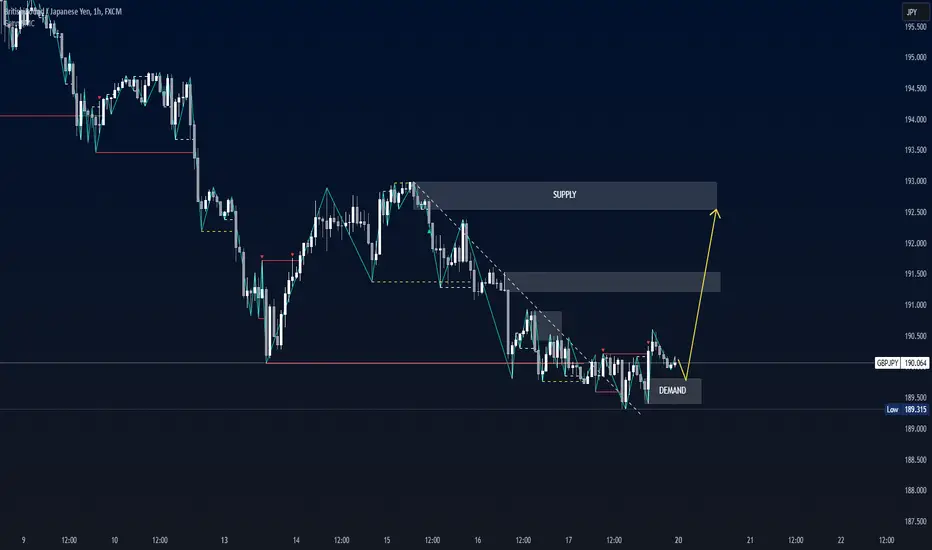
GBPJPY Market Structure Analysis on 1 Hour Timeframe1H swing is bullish => current is pullback
We can look for buying opportunities when the price reaches the demand zone
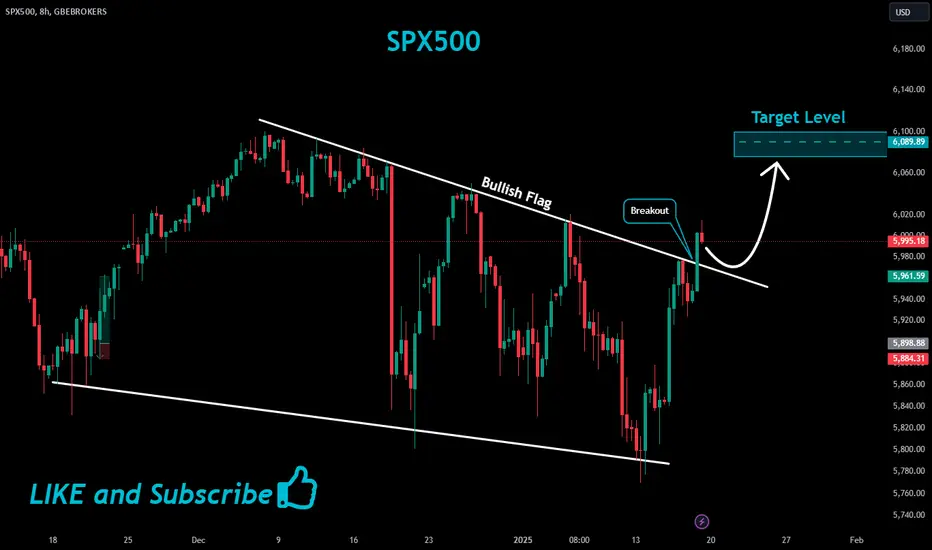
SPX500 Bullish Bias!
HI,Traders !
SPX500 is trading in an
Uptrend and the Indice has
Formed a bullish flag
Pattern so as the Indice
Is breaking out we
Are bullish biased
And we will be expecting
A further move up!
Comment and subscribe to help us grow!
SP500 market structure analysis on 4h and M15 timeframes- 4H swing is bearish => Current is pullback.
- M15 swing is bearish
High probability of price decrease following the main trend of 4H timeframe.
We can look for selling opportunities in the supply zone of 15min timeframe

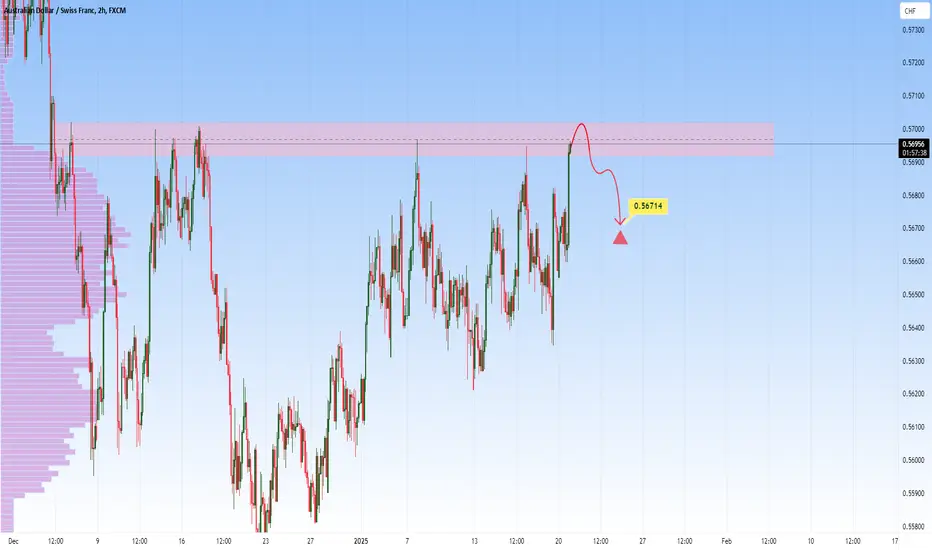
AUDCHF at Key Resistance: Will It Drop To 0.56714?OANDA:AUDCHF is at a significant resistance area that has consistently acted as a barrier for bullish momentum. The recent price action suggests a potential for sellers to step in and drive prices lower from this zone.
If rejection signals, such as bearish engulfing candles or upper wicks, appear, I expect a move toward 0.56714. A break above this resistance, however, could indicate a shift in market sentiment.
Traders should wait for confirmation before entering short positions and ensure proper risk management. If you have any thoughts or agree with this analysis, I’d love to hear your perspective in the comments!
Platinum – Potential Short Setup with RetestPlatinum is currently trading below a key resistance zone, following a breakdown from the ascending channel. The recent bearish momentum indicates the potential for a continuation lower if the price fails to reclaim the resistance zone.
If the price retests this zone and shows rejection signals—such as bearish wicks, engulfing candles, or decreased buying pressure—it would strengthen the case for a short trade. In this scenario, the next target for sellers would be the $926.94 support zone, where buying interest may re-emerge.
This setup aligns with the broader bearish structure following the channel breakdown. Traders should monitor price action closely at the resistance level for confirmation of rejection before entering short positions.

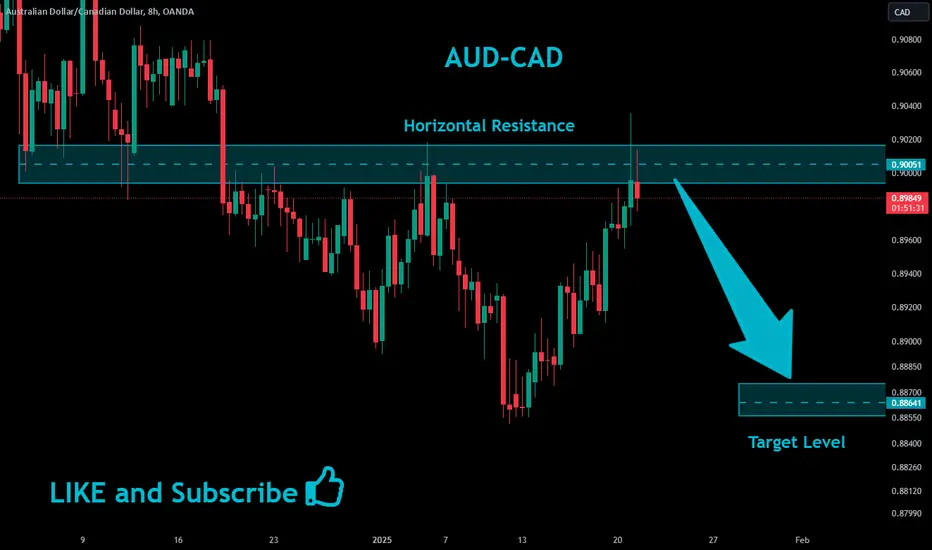
AUDCAD Will Fall!
HI,Traders !
AUD-CAD made a retest
Of the horizontal resistance
Level of 0.90051 and we are
Already seeing a local
Bearish reaction so
We will be expecting a
Further move down!
Comment and subscribe to help us grow!
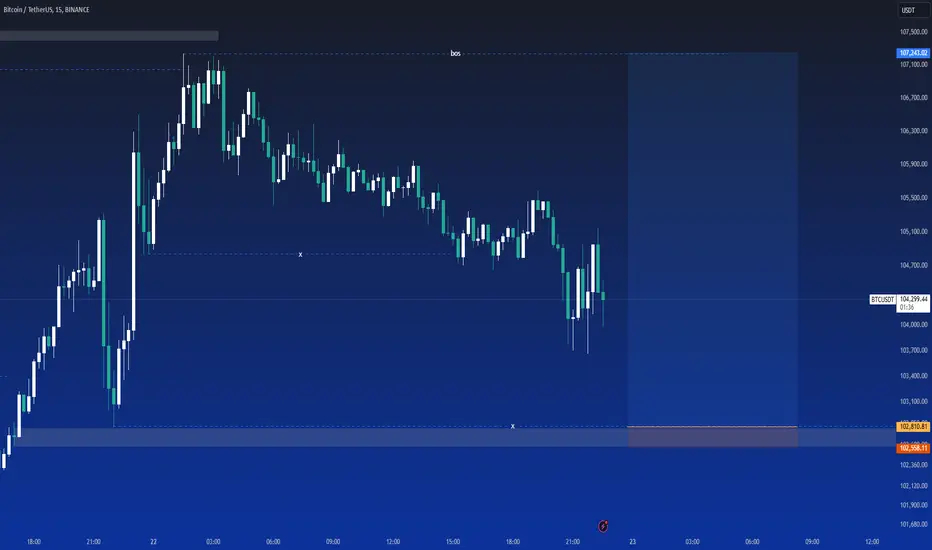
Nasdaq on 15 minute to take sellside and then move on buyside.The Nasdaq analysis on 15 minute chart shows, price moving lower to take Minor Sellside Liquidity and engage the clustering of NWOGs . After that we could expect price reaching up to the Minor Buyside Liquiidty and Primary Buyside Liquidity considering we broke structure on the Daily Timeframe and Trump becoming the president of the US. 🚀
Please take this as just an idea :) ✅

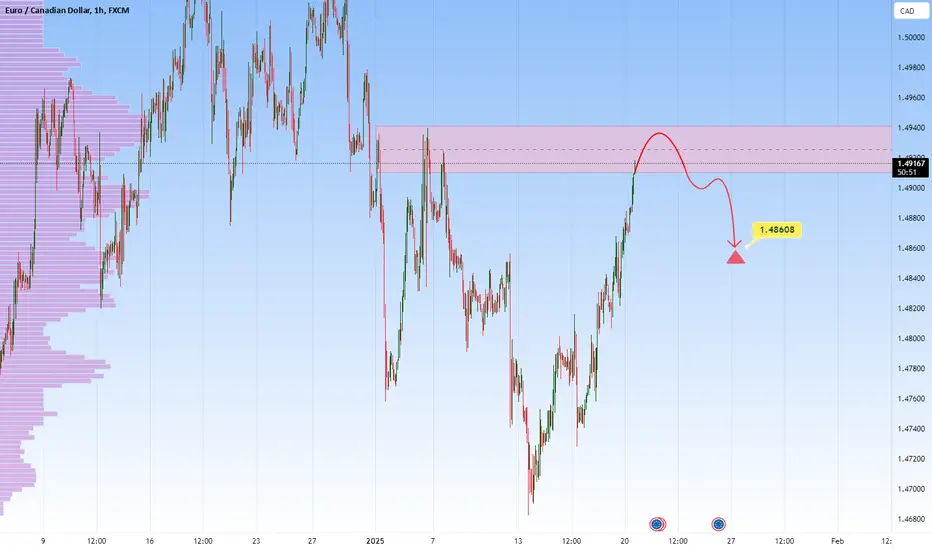
EURCAD - Potential Sell From Resistance ZoneEURCAD is testing a major resistance zone that has previously led to significant bearish reversals. The recent bullish momentum into this area increases the likelihood of seller interest.
If bearish confirmation emerges, such as rejection wicks, bearish engulfing candles, or increased selling volume, I anticipate a move toward 1.48608. However, a breakout above this resistance could signal further bullish continuation.
Traders should remain cautious and wait for clear signals of rejection before taking positions. Agree with this analysis? Let’s discuss further in the comments section!
CADCHF - Short Setup at Key ResistanceThe CADCHF pair just entered a notable resistance zone that has times before acted as a supply zone, leading to bearish movements. A confirmation of selling pressure, such as a bearish engulfing pattern or multiple rejection wicks at the resistance level, would increase the likelihood of a downward move.
If sellers take control at this level, the pair could move downward, with a target around the 0.63230 level.

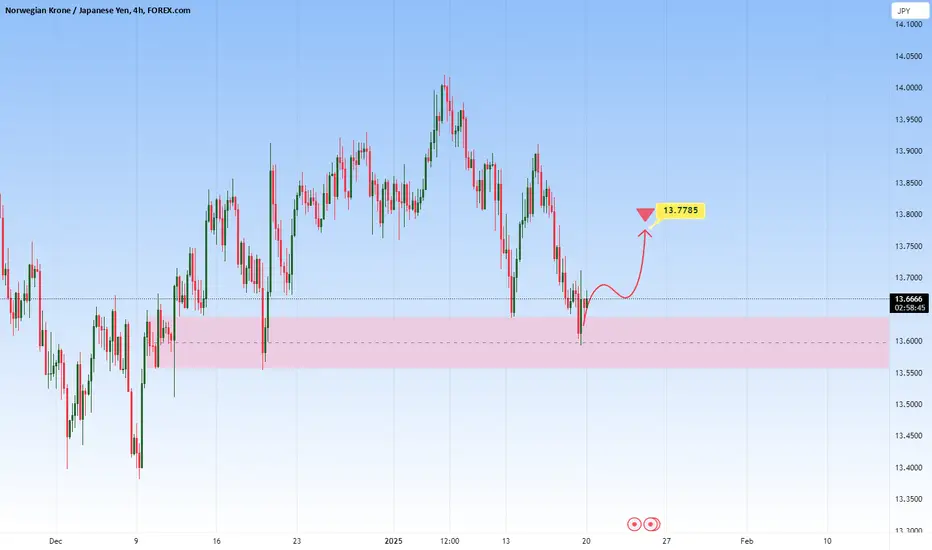
NOKJPY - Buy Setup from Key SupportFOREXCOM:NOKJPY is currently at a significant demand zone that has historically attracted buyers, triggering bullish reversals. This support level has been pivotal in past price actions, forming a solid base for potential upward momentum.
The appearance of a strong bullish candle reinforces the setup, suggesting the likelihood of an upward movement, with a target around 13.7785. However, if the support level is breached, the bullish sentiment could fade, allowing for a possible decline.
Traders should remain alert in this zone for signs of buyer strength before taking long positions. Proper risk management is critical to mitigate the risk of losses.
EURSD wave structure analysis on 1H timeframeH4 swing is bearish.
H1 swing is bearish => Currently is pullback.
We can look for buying opportunities in the demand zone of the 1H timeframe.

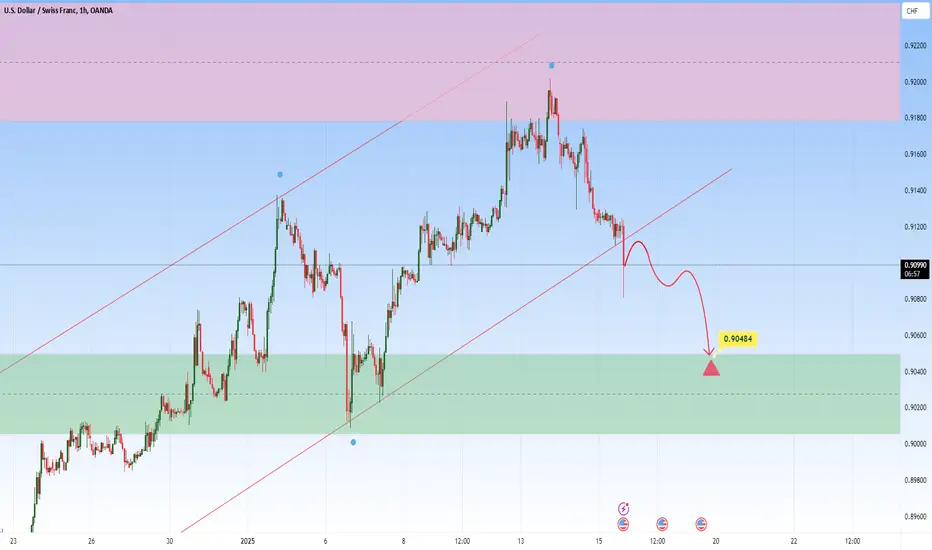
USDCHF – Potential Bearish Continuation Toward SupportThe USDCHF pair has broken below a key ascending trendline, signaling a potential shift in momentum. This move aligns with a bearish bias, suggesting that price action may now head lower.
If the price retraces back to the broken trendline or nearby resistance levels and forms bearish confirmations—such as rejection patterns, bearish engulfing candles, or long upper wicks, it could reinforce the likelihood of further downside movement.
Should this scenario materialize, sellers may target the 0.90484 level as the next area of interest. A sustained breakdown below this support zone could pave the way for continued bearish pressure.
However, traders should remain cautious. A break back above the resistance zone or strong bullish momentum could invalidate this outlook.
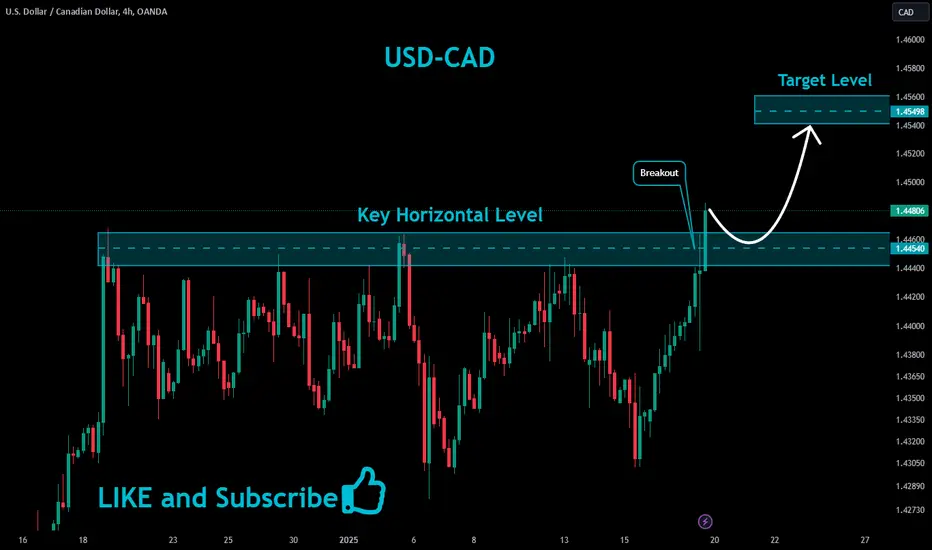
USDCAD Will Keep Growing!
HI,Traders !
USD-CAD is trading in an
Uptrend and the pair just
Made a strong bullish
Breakout so we are
Bullish biased now and
We will be expecting a
Further bullish move up!
Comment and subscribe to help us grow!
Analyze the market structure of SKLUSDT coin in the daily frameDay swing is bullish => Currently is pullback
The internal structure gives bullish reversal signal.
We can look for buying opportunities in this demand zone to invest

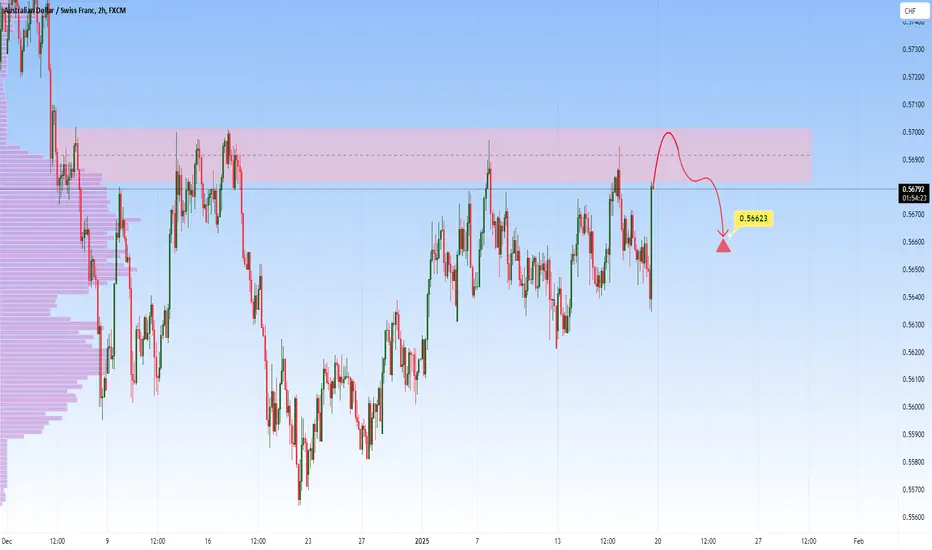
AUDCHF - Potential Short Opportunity from Key ResistanceOANDA:AUDCHF is currently testing a significant resistance zone. Historically, this area has seen strong selling pressure, leading to notable bearish moves. The recent bullish push into this resistance zone suggests a potential for sellers to regain control.
A bearish confirmation, such as rejection candles, bearish engulfing patterns, or long upper wicks, would increase the probability of a downward move. If this scenario unfolds, the price could head toward the 0.56623 level.
Traders should remain cautious and wait for clear signs of selling pressure before considering short positions. Proper risk management is essential, given the possibility of a break above the resistance zone.
What are your thoughts on this setup?
AUDJPY: Potential Long from Key Support ZoneOANDA:AUDJPY is currently trading near a significant support zone which previously led to bullish reversals. The recent bearish move into this zone suggests a potential for buyers to step in and drive prices higher.
A bullish confirmation, such as rejection patterns, bullish engulfing candles, or long lower wicks, would increase the likelihood of a rebound. If buyers regain control, the price may rise toward the 96.650 level, where sellers could potentially re-emerge.
This setup aligns with a possible short-term recovery within the broader bearish trend. Traders should wait for confirmation of buying pressure before considering long positions.

GOLD - Potential Bearish Rejection at ResistanceGold is approaching a key resistance zone, which aligns with the upper boundary of the ascending channel. This area has the potential to act as a strong barrier, leading to a bearish pullback if sellers regain control.
A rejection at this resistance could push the price back toward the $2,698-$2,700 level. If this level holds, it may provide a base for buyers to attempt another rally.
However, a failure to hold above the $2,698 level could signal further bearish momentum, potentially targeting lower areas within the channel. Traders should watch for confirmation, such as bearish candlestick patterns or strong rejection wicks, at the resistance zone.

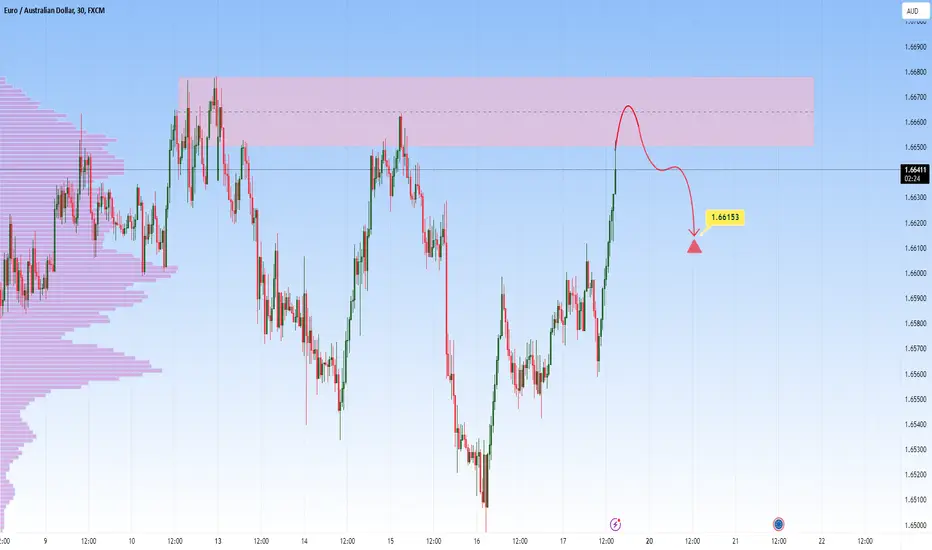
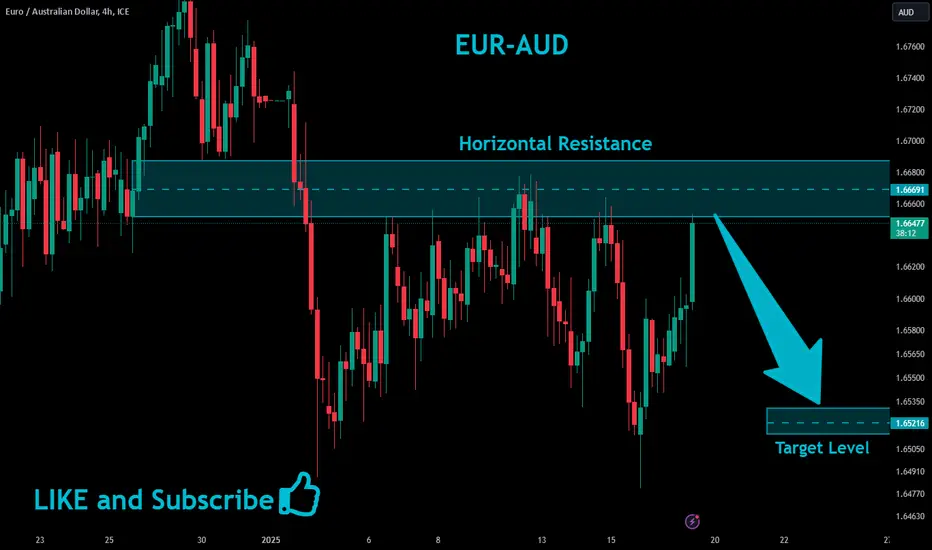
EURAUD - Potential Short from Resistance ZoneThe EURAUD pair is approaching a significant resistance zone. The current bullish momentum into this area may provide an opportunity for sellers to regain control.
A bearish confirmation, such as rejection patterns, bearish engulfing candles, or signs of slowing momentum, would increase the likelihood of a pullback. If the resistance holds, the price could target the 1.66150 level.
Traders should monitor for confirmation of selling pressure before initiating short positions. This setup aligns with a potential corrective move within the broader market structure.
USDCAD - Potential Short from Key Resistance ZoneThe USDCAD pair is testing a significant supply zone, a level that has consistently acted as resistance in the past. The strong upward momentum approaching this area may lead to a reversal as sellers look to regain control.
A bearish confirmation, such as rejection candles (e.g., shooting stars), bearish engulfing patterns, or long upper wicks, would strengthen the case for a short position. If this setup plays out, the price could head toward the 1.43928 level.
Traders should monitor price action closely for signs of selling pressure before entering short positions.

EURAUD Locally Overbought!
HI,Traders !
EURAUD is trading in a
Strong uptrend but the
Pair is locally overbought so
After the retest of the
Horizontal resistance level
Of 1.66691 from where
We will be expecting a
Local bearish correction !
Comment and subscribe to help us grow!
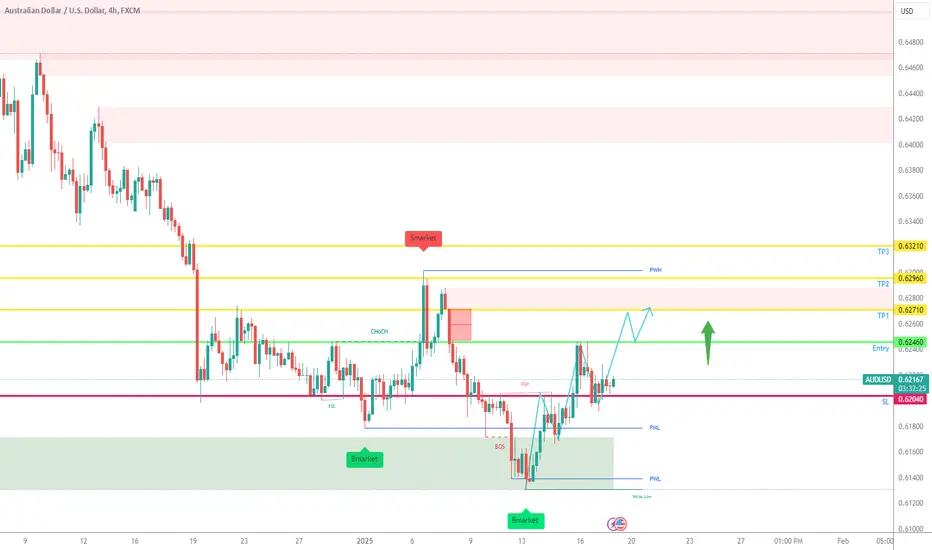
AUDUSD potential buyWith the recent push down of the US index there is a high probably of buying momentum in the Aussie dollar due to weaker US data yesterday.
With the SMC indicator in the 4hr time frame we can see a rejection of price to the downside while breaking thought the PML.
In my opinion it will race towards TP1 which is a good place to exit since there is an orderblock at that level. If it breaks through that Orderblock you could wait for a pullback & enter to play for TP2 & TP3 or simply just trailstop each time it breaks past a TP level till you get stopped out.
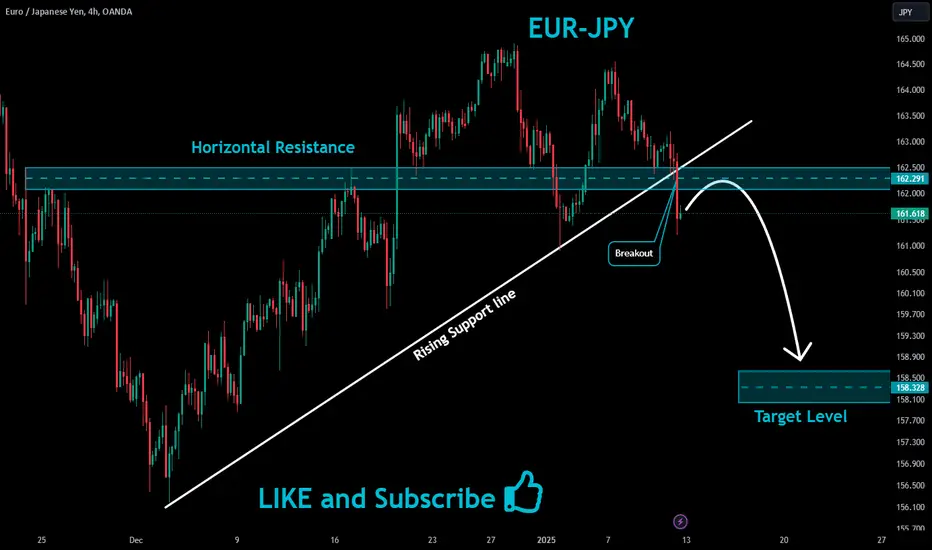
EURJPY Bearish Breakout!
HI,Traders !
EUR-JPY broke the rising
Support line and the breakout
Is confirmed So after the retest strong horizontal
Resistance is ahead at 162.291 we will so we are
Bearish biased and we Will be expecting a
Further move down !
Comment and subscribe to help us grow!