SNAP INC – Snapchathers on the way up (Continuation)Welcome to our Academy. We’re here to help you achieve what you have been looking for.
Use our free analysis where you have everything you need for potencial trade ideas and profit.
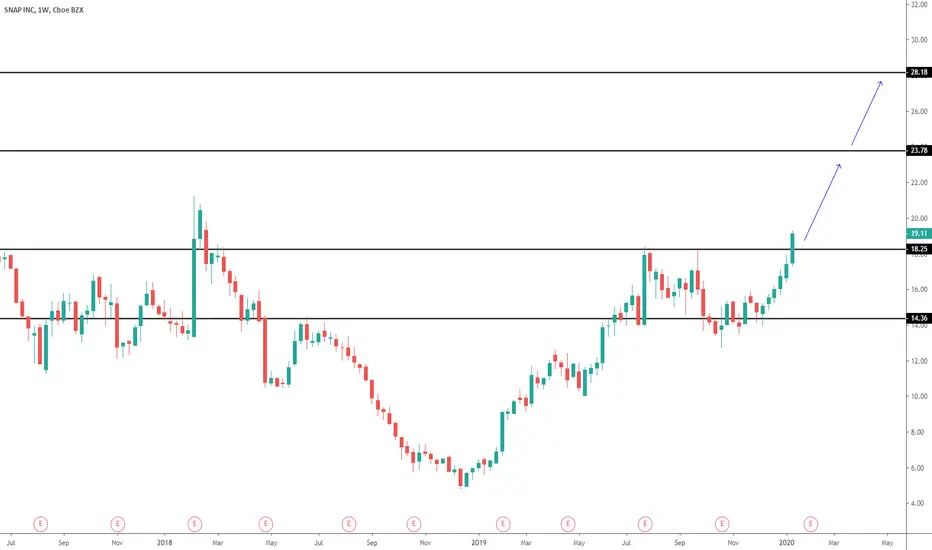
SNAP INC – Snapchathers on the way up (Trend Continuation)
Trend: Strong Buy
Support/Resistance:
R2: 28.18
R1: 23.78
S1: 18.25
S2: 14.36
Price action:
Overall bullish flow is very strong. Snapchat trending is in very good continuation shape. The only way to get higher at this trending idea is following potencial bull targets. If the price get denied at straight away move up, then first buyers support to prove non-faker pattern is at 18.25 level.
Potencial trade idea:
Bulls targets:
T1: 23.78
T2: 28.18
NOTE – We are trading SNAP INC via the preferred trading setups by EliteFxAcademy
Disclaimer: Martin’s views on the Chart analysis is ment as a trading advice for education terms; Education terms include: trading consistency to everyone who is reading this blog; for every advance student and for every Elite student who is using this analysis for managing his equity by Elite strategy and custom indicator. This analysis is understandable and transparent for all Elite students. This is a free content which is based from Academy in term of transparency to support and following progress to everyone. We know that there is always possible way that market can pull you out even when you follow our analysis blog and advice for a trade. We don’t publish where you have to have your risk management – Stop Loss, because, it would not be fair to Elite members, who learned this techniques in our Elite course.
Keywords:
Elite strategy, Custom Indicator, Fundamental Analysis , Tehnical analysis, Price action, Advanced strategies, Trading Education
Good trading!
Elitefxacademy
Snapchat
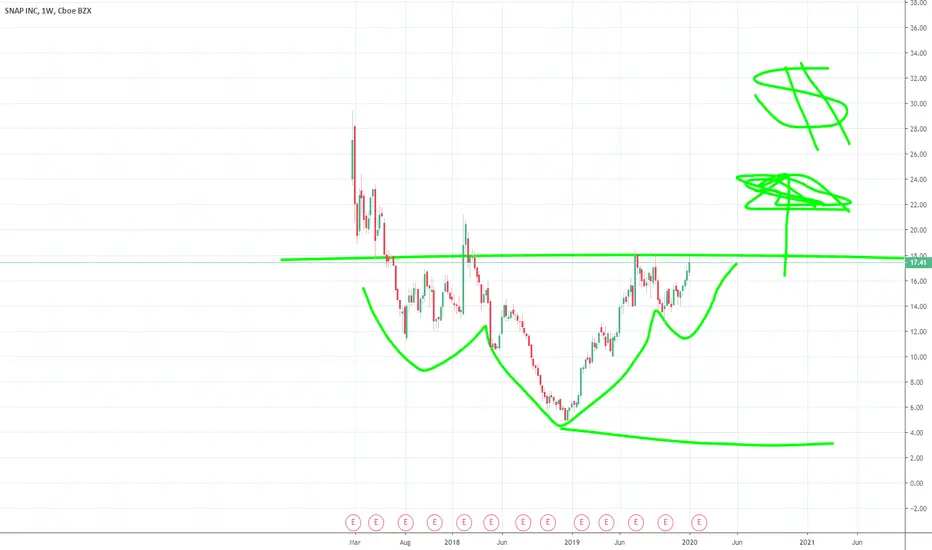
SNAP's C&H or H&SNot really sure if Head and Shoulder or Cup and Handle. But likely to be a positive outlook for SNAP. Could make a small correction before going up. Although, may not get to $26 until second half of the year.

Hopefully this chart isnt too complex for yall. boolish af i saw my first titties on snap chat
if this shit doesnt moon then ill be virgin 4 lyfe
i might still be even if it doesnt moon, ha
it looks like a persons head and their shoulders, but kind of upside down
once break that necc, ew it gon be nastybooty
um, thats it
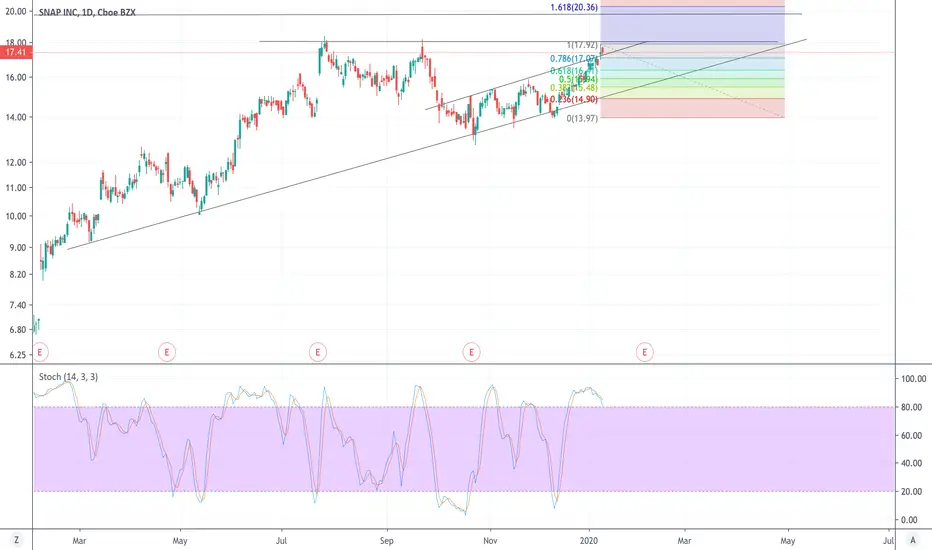
$SNAP: Breakout Past 18? or PullBack to $15.5?This is the 3rd time SNAP is testing the $18 range, if it fails I believe it will fall back into the channel I have charted before eventually testing $18 for a 4th time if necessary
Snap Short selling Lost the low before the high on Weekly time frame.
I would like to see a pullback up here and then a nice clean fall to hell...


$SNAP Snapchat EOY 2019, break-out incoming? $SNAPSnapchat inside a ascending triangle, close above $16 = $17
61.8 and 76.8 fib need to be touched.
$SNAP EOY 2019, break-out incoming?
$SNAP EOY 2019, break-out incoming?
____
$SNAP Q4 earnings
3 beats out of last 4
volatile day 100%
beat = +$20
Not financial advice

Oh SnapNote: All of what I claim below is simply the way I perceive the market. I am not certain nor do I suggest you take my advice without first taking into consideration what I have said. Whatever you do, be critical of what everyone claims. Those who claim certainty in these markets tend to get hurt the most.
Observations:
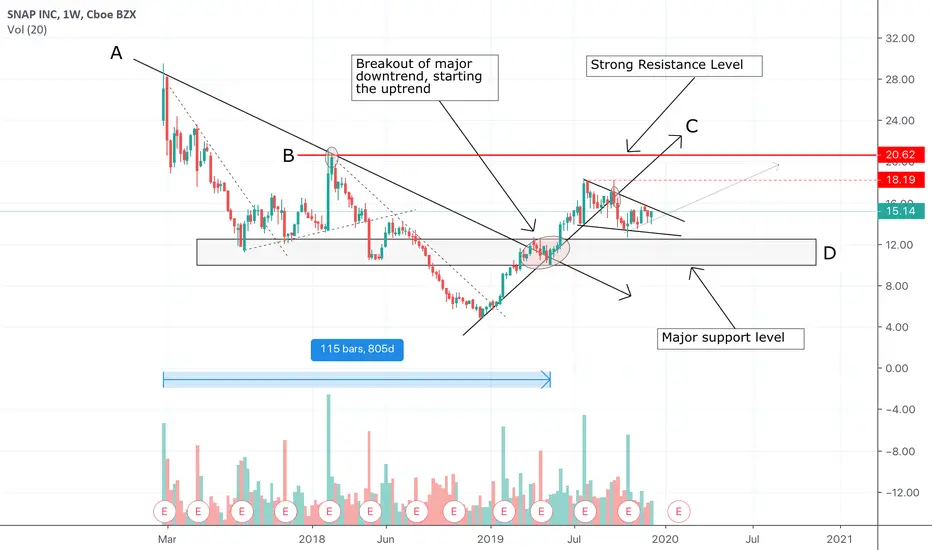
Snap was publically listed on the Cboe BZX exchange on February 27th, 2017. Since this time, the price has been on the decline. But on May 13th, 2019, price action broke above the major diagonal downward trendline A, suggesting that sentiment had reversed.
I believe Snap is currently in an overall uptrend until it breaks below the point in which it broke out of ($12.48 to be exact). Therefore, I have highlighted the major support level D as a region where if price reaches, may bounce off of.
If price breaks below this point, I can only imagine there will be more pain to come.
I personally believe that smaller trends can be found within larger trends. As you can see in the above image, Price broke out strongly from trendline A, forming the upward trendline C.
Now look at how the price broke below trendline C and began to form a falling wedge. I expect some more consolidation within this pattern and then a continuation up towards the resistance trendline B. I’ve chosen this spot as a target because price action resisted harshly from it once before.
Thank you for reading,
Have a nice day!


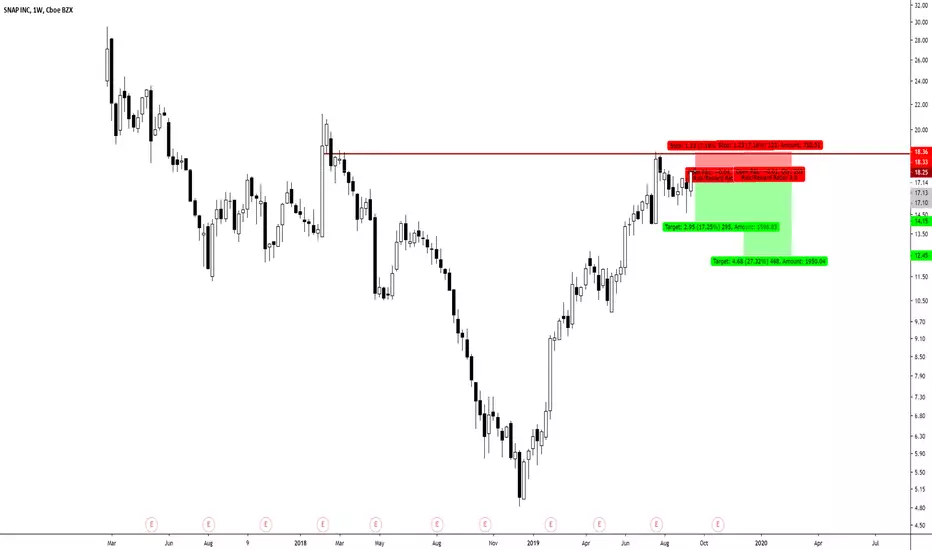
Snapchat bullishA pretty decent setup with this one. Looks like we might be chasing a bullish peak. Entry looks attractive and risk;reward is well established.
SNAP short idea by bluepipshort in levels to target ...
leave me your like and comment's about my analyze on the posts ....


Everyone is Laughing about Scammers Losing Money in the MarketIndeed! 100% ACCURACY since IPO a mathematical fact


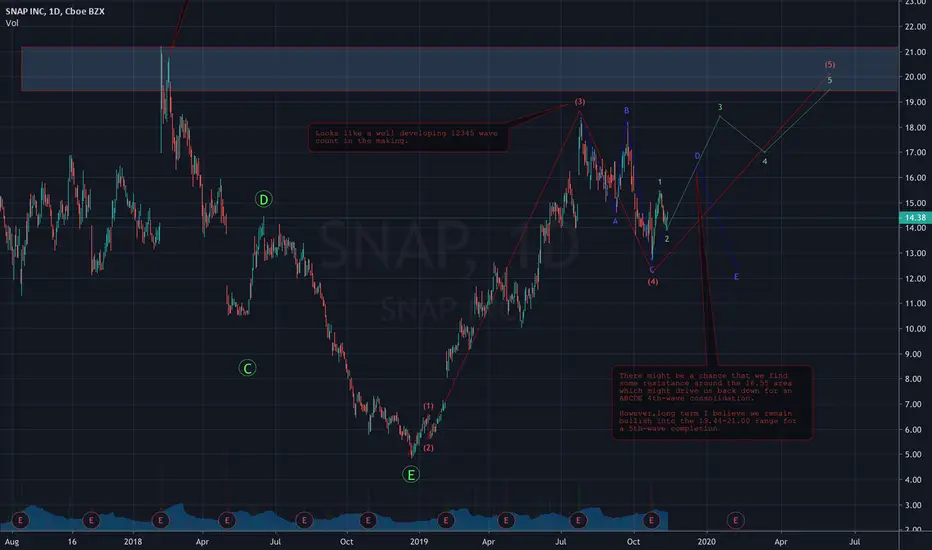
Snapchat end of wave 4Price almost at the low of wave 4, near the 61.8% fib level. If that level holds, then more probability for the surge up to wave 5.
Great risk-reward there. 200sma coming up from below as support as well. Targeting up above $20.
Good luck!

Snap long before further downsideNot really much to say here, pretty simple long playing the bounce in a very bearish looking chart. I would be surprised if there is no bounce off of the .5 fib to retest the .382 as resistance. Stop-loss is just under the previous wick, should be safely hidden. Overall still bearish on the weekly chart.
If you enjoyed this analysis, and or like cookies, be sure to like and follow for more content. :)

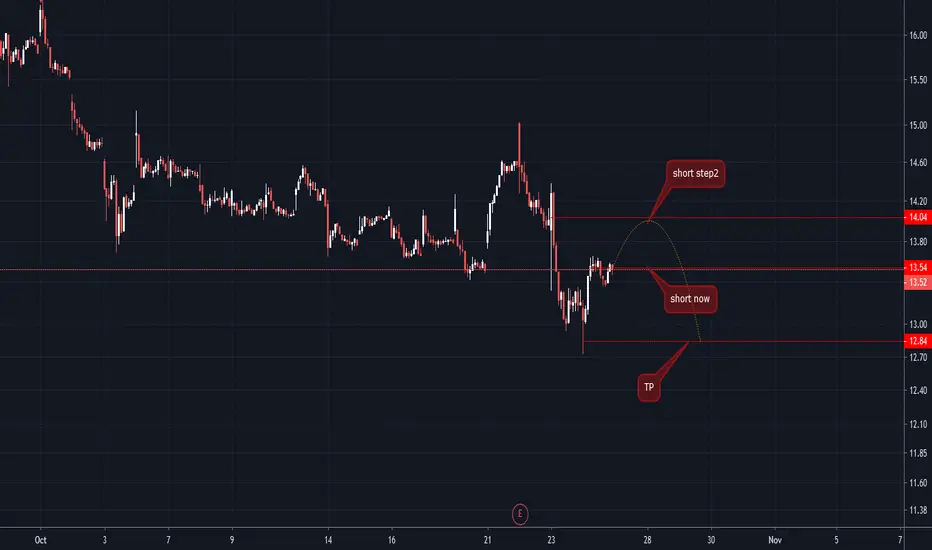
Snap Chat SNAP stock analysis and forecast. Short opportunitiesShort opportunities are being created on Snap Chat SNAP stock.
New weekly supply is being created on Snap Chat on the weekly timeframe around $16 per share. The stock has been doing nothing for a few weeks and it's now dropping strongly creating new weekly supply imbalance and lower timeframe imbalances. No longs are allowed. Price action and supply and demand
Weekly price action analysis is telling us than bearish impulses are stronger than bullish impulse so it would be suicidal to open short positions on Snap Chat stop. As per the supply and demand analysis, only shorts are possible, that is, selling the stock or use stock options to trade all the way down as there is a lot of room for price to drop with no important obstacles.


Autonomous AI Trading Sells Snapchat $18 Goldman Sachs UpgradesSnapchat was sold $18 as 95% of Wall Street raised price target to $24
Snapchat was upgraded to Strong-Buy at $5 when 100% of Wall Street had Strong Sell ratings
Refer to the previous chart