Synthetix Network Token (SNX) - June 17Hello?
Welcome, traders.
By "following", you can always get new information quickly.
Please also click "Like".
Have a good day.
-------------------------------------
(SNXUSD 1W Chart)
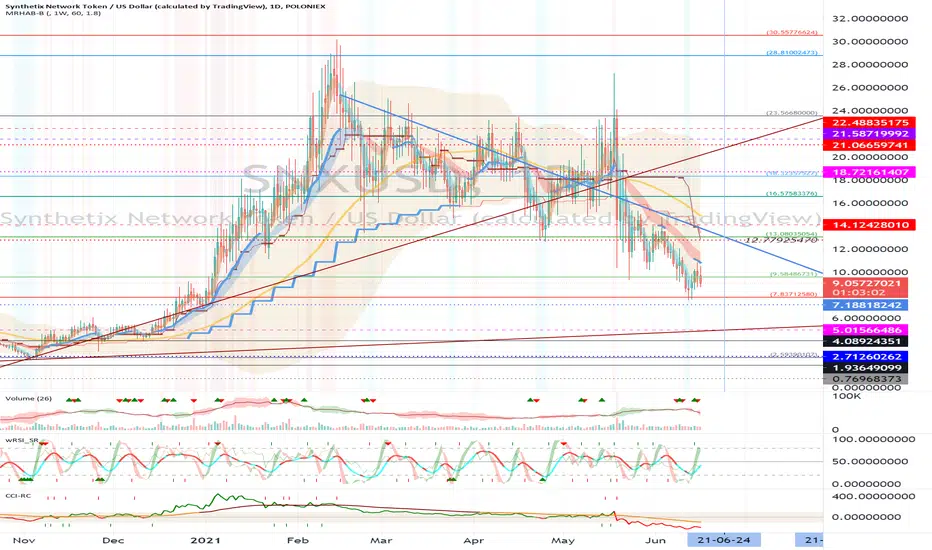
It remains to be seen if the price can sustain above the 7.18818242 point.
You need to trade cautiously before breaking out of the downtrend line.
(1D chart)
It remains to be seen if the 7.83712580-9.58486731 zone can find support and move up.
The price should remain in the range of 9.58486731-13.08035054 to convert into an uptrend.
If it falls from the 7.18818242 point, it may take a long time to rise as it enters the mid- to long-term investment area, so careful trading is required.
However, the 4.08924351-5.01566486 section may find strong support and move up along the uptrend line, so you should think about how to respond.
-------------------------------------
(SNXBTC 1W chart)
It remains to be seen if the 0.0002333-0.0002815 zone can find support and move up.
If the price holds above the 0.0002333-0.0002815 range, we expect the uptrend to continue.
A full-fledged uptrend is expected to begin only after breaking out of the downtrend line.
(1D chart)
It is important to have support in the range 0.0002166-0.0002625.
To convert into an uptrend, it needs to rise above the 0.0002815 point for support.
However, it should break out of the downtrend line to accelerate the uptrend.
------------------------------------------
We recommend that you trade with your average unit price.
This is because, if the price is below your average unit price, whether it is in an uptrend or in a downtrend, there is a high possibility that you will not be able to get a big profit due to the psychological burden.
The center of all trading starts with the average unit price at which you start trading.
If you ignore this, you may be trading in the wrong direction.
Therefore, it is important to find a way to lower the average unit price and adjust the proportion of the investment, ultimately allowing the funds corresponding to the profits to regenerate themselves.
------------------------------------------------------------ -----------------------------------------------------
** All indicators are lagging indicators.
Therefore, it is important to be aware that the indicator moves accordingly with the movement of price and volume.
However, for the sake of convenience, we are talking in reverse for the interpretation of the indicator.
** The wRSI_SR indicator is an indicator created by adding settings and options to the existing Stochastic RSI indicator.
Therefore, the interpretation is the same as the traditional Stochastic RSI indicator. (K, D line -> R, S line)
** The OBV indicator was re-created by applying a formula to the DepthHouse Trading indicator, an indicator disclosed by oh92. (Thanks for this.)
** See support, resistance, and abbreviation points.
** Support or resistance is based on the closing price of the 1D chart.
** All descriptions are for reference only and do not guarantee a profit or loss in investment.
Explanation of abbreviations displayed in the chart
R: A point or section of resistance that requires a response to preserve profits.
S-L: Stop Loss point or section
S: A point or section where you can buy to make a profit as a support point or section
(Short-term Stop Loss can be said to be a point where profit and loss can be preserved or additional entry can be made through split trading. It is a short-term investment perspective.)
GAP refers to the difference in prices that occurred when the stock market, CME, and BAKKT exchanges were closed because they are not traded 24 hours a day.
G1 : Closing price when closed
G2: Opening price
(Example) Gap (G1-G2)
SNXKRW
Synthetix Network Token (SNX) - March 24Hello?
Dear traders, nice to meet you.
By "following" you can always get new information quickly.
Please also click "Like".
Have a good day.
-------------------------------------------------- -----
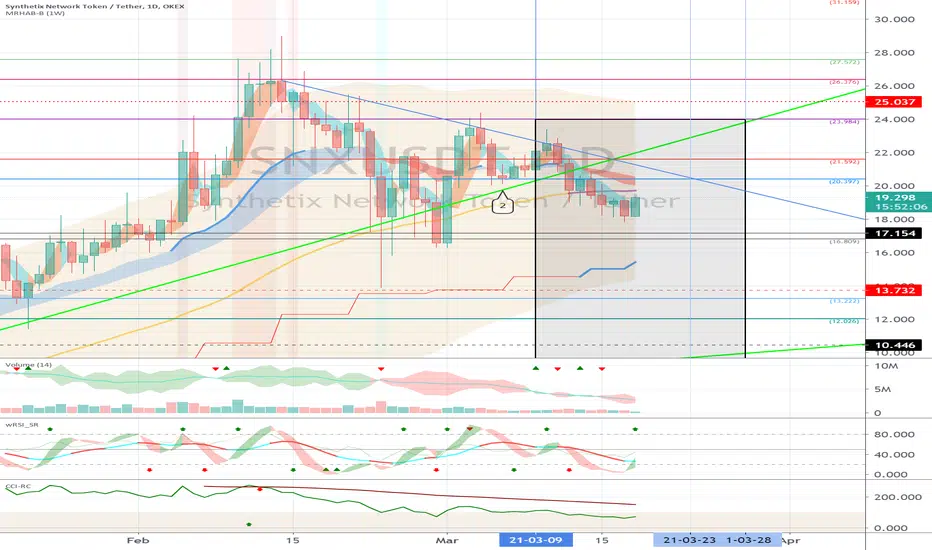
We have to see if we can get support and climb at 16.809.
As such, we need to see if there is any movement to move sideways at 16.809 or break off the downtrend line.
If you go down at 16.809, you can touch 13.222, so you need a Stop Loss to preserve profit or loss.
In order to turn to the uptrend line, it must rise to the 20.397-21.592 section and receive support.
As the OBV on the volume indicator increases green, it remains to be seen if the center line can rise.
It remains to be seen if the CCI line can rise above 100 on the CCI-RC indicator.
---------------------------------------
(SNXBTC 1D chart)
We need to see if it can rise along the uptrend line (1).
In particular, it remains to be seen if the volatility around March 26 could increase more than 3280 Satoshi.
In order to turn to an uptrend, you must get off the downtrend line.
-------------------------------------------------- -------------------------------------------
** All indicators are lagging indicators.
So, it's important to be aware that the indicator moves accordingly with the movement of price and volume.
Just for the sake of convenience, we are talking upside down for interpretation of the indicators.
** The wRSI_SR indicator is an indicator created by adding settings and options from the existing Stochastic RSI indicator.
Therefore, the interpretation is the same as the conventional stochastic RSI indicator. (K, D line -> R, S line)
** The OBV indicator was re-created by applying a formula to the DepthHouse Trading indicator, an indicator that oh92 disclosed. (Thank you for this.)
** Check support, resistance, and abbreviation points.
** Support or resistance is based on the closing price of the 1D chart.
** All explanations are for reference only and do not guarantee profit or loss on investment.
Explanation of abbreviations displayed on the chart
R: A point or section of resistance that requires a response to preserve profits
S-L: Stop Loss point or section
S: A point or segment that can be bought for profit generation as a support point or segment
(Short-term Stop Loss can be said to be a point where profits and losses can be preserved or additionally entered through installment transactions. It is a short-term investment perspective.)
GAP refers to the difference in prices that occurred when the stock market, CME, and BAKKT exchanges were closed because they do not trade 24 hours a day.
G1: Closing price when closed
G2: Cigar at the time of opening
(Example) Gap (G1-G2)

Synthetix Network Token (SNX) - March 18Hello?
Dear traders, nice to meet you.
By "following" you can always get new information quickly.
Please also click "Like".
Have a good day.
-------------------------------------------------- -----
You should watch for any movement that deviates from the 16.809-20.397 section.
It remains to be seen if the volatility around March 23rd (March 22-24) increases above 20.397 points and breaks the downtrend line.
If you go down at 16.809, you can touch 13.222, so you need a Stop Loss to preserve profit or loss.
In order to turn to an uptrend, it needs to be supported in the 20.397-21.592 range.
-----------------------------------------
(SNXBTC 1D chart)
You should see if you can climb along the uptrend line (1) and climb above the 0.0003403 point.
In particular, it remains to be seen if it can deviate from the downtrend lines (3) and (4).
-------------------------------------------------- -------------------------------------------
** All indicators are lagging indicators.
So, it's important to know that the indicator moves accordingly with the movement of price and volume.
Just for the sake of convenience, we are talking upside down for interpretation of the indicators.
** The wRSI_SR indicator is an indicator created by adding settings and options from the existing Stochastic RSI indicator.
Therefore, the interpretation is the same as the conventional stochastic RSI indicator. (K, D line -> R, S line)
** The OBV indicator was re-created by applying a formula to the DepthHouse Trading indicator, an indicator that oh92 disclosed. (Thank you for this.)
** Check support, resistance, and abbreviation points.
** Support or resistance is based on the closing price of the 1D chart.
** All explanations are for reference only and do not guarantee profit or loss on investment.
Explanation of abbreviations displayed on the chart
R: A point or section of resistance that requires a response to preserve profits
S-L: Stop Loss point or section
S: A point or segment that can be bought for profit generation as a support point or segment
(Short-term Stop Loss can be said to be a point where profits and losses can be preserved or additionally entered through installment transactions. It is a short-term investment perspective.)
GAP refers to the difference in prices that occurred when the stock market, CME, and BAKKT exchanges were closed because they do not trade 24 hours a day.
G1: Closing price when closed
G2: Cigar at the time of opening
(Example) Gap (G1-G2)
Synthetix Network Token (SNX) - March 6Hello?
Dear traders, nice to meet you.
"Like" is a huge force for me.
By "following" you can always get new information quickly.
Thank you for always supporting me.
-------------------------------------------------- -----
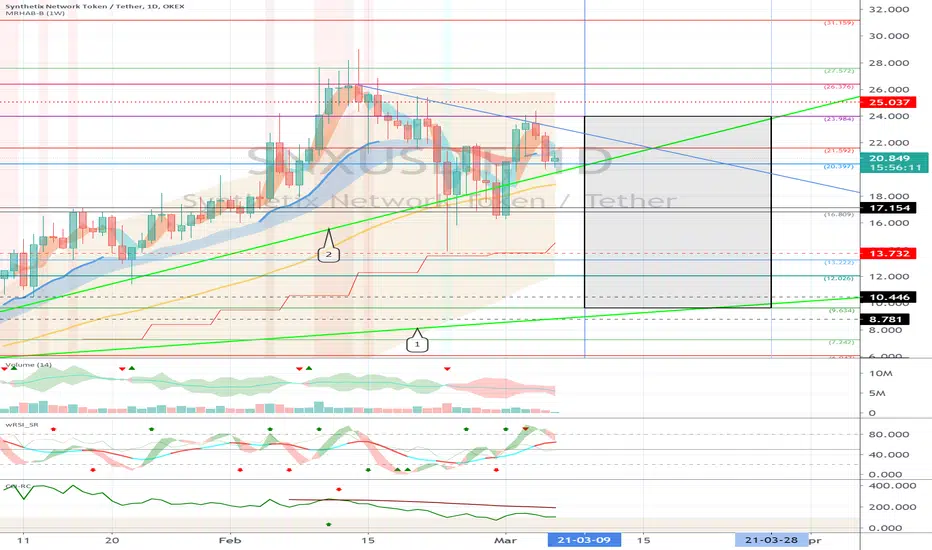
We need to see if we can get support from 20.397-21.592 and climb above 23.984 points.
In particular, it remains to be seen if it can rise along the uptrend line (2).
With the volatility period starting around March 9th, we have to see what's going on.
If you fall from the uptrend line (2), you need a short stop loss.
If it falls between 12.026-13.222, a Stop Loss is required to preserve profit and loss.
However, it may rise along the uptrend line (1), so careful trading is necessary.
-------------------------------------------------- -------------------------------------------
** All indicators are lagging indicators.
So, it's important to be aware that the indicator moves accordingly with the movement of price and volume.
Just for the sake of convenience, we are talking upside down for interpretation of the indicators.
** The wRSI_SR indicator is an indicator created by adding settings and options from the existing Stochastic RSI indicator.
Hence, the interpretation is the same as the traditional Stochastic RSI indicator. (K, D line -> R, S line)
** The OBV indicator was re-created by applying a formula to the DepthHouse Trading indicator, an indicator that oh92 disclosed. (Thank you for this.)
** Check support, resistance, and abbreviation points.
** Support or resistance is based on the closing price of the 1D chart.
** All explanations are for reference only and do not guarantee profit or loss on investment.
Explanation of abbreviations displayed on the chart
R: A point or section of resistance that requires a response to preserve profits
S-L: Stop Loss point or section
S: A point or segment that can be bought for profit generation as a support point or segment
(Short-term Stop Loss can be said to be a point where profits and losses can be preserved or additionally entered through installment transactions. It is a short-term investment perspective.)
GAP refers to the difference in prices that occurred when the stock market, CME, and BAKKT exchanges were closed because they do not trade 24 hours a day.
G1: Closing price when closed
G2: Cigar at the time of opening
(Example) Gap (G1-G2)