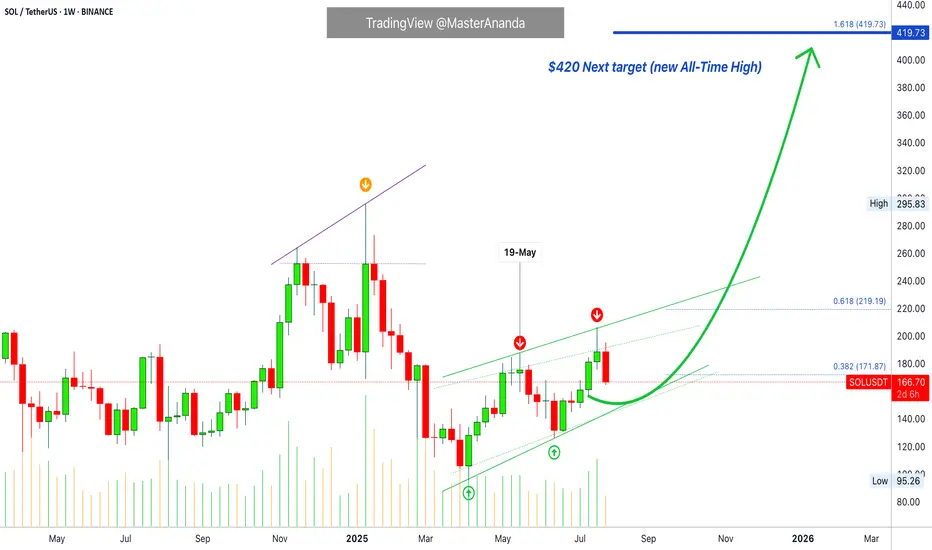
Solana Update · Retrace, Bears & The Bullish BiasSolana had a retrace in May. Notice the 19-May date on the chart. This retrace produced four weeks red. The bullish move that led to this retrace lasted 6 weeks. The last rise lasted five weeks and the current retrace might last only two weeks, can be less.
We are seeing Solana rising but this rise is not a one-time off event, this is a trend that is developing. An uptrend as a long-term phenomena is different to a short-term bullish moves. A short-term move tends to be really fast, one strong burst and that's it. A long-term move is different. Instead of seeing 2-3 candles and Solana trading at $1,000, we see dozens and dozens of candles with prices slowly rising. There are strong fluctuations but the end result is always up. And that's how you see the fluctuations on the chart.
Solana moved up and then immediately started to retrace. Then another rise and another retrace again. This retrace will end and prices will continue to grow long-term. The bulls are in. The bull market is on. Solana, Bitcoin, Crypto and the rest of the Altcoins market is going up.
Namaste.
SOL
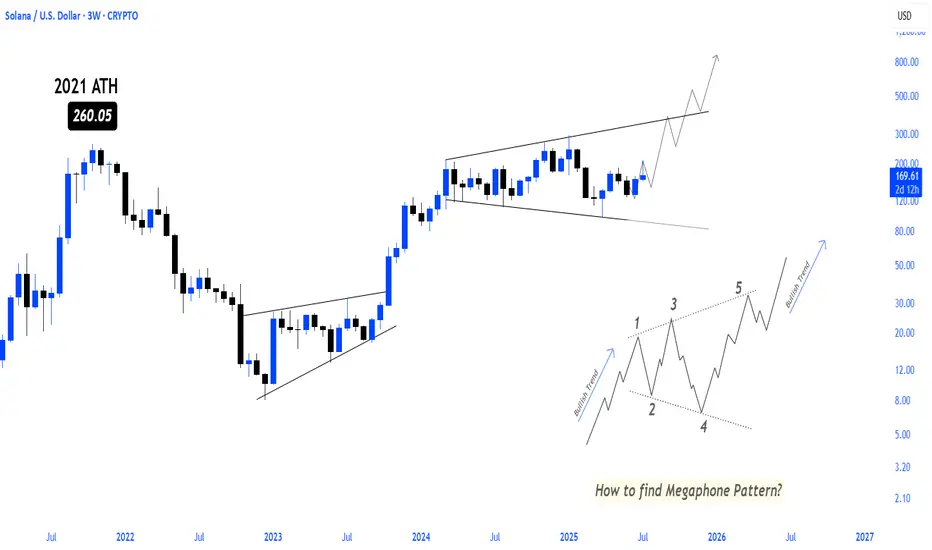
SOLANA BULLISH MEGAPHONE PATTERN LOADING! solana continues to move step by step towards higher levels within the bullish megaphone pattern, which will make movements towards ATH and more inevitable in the coming period
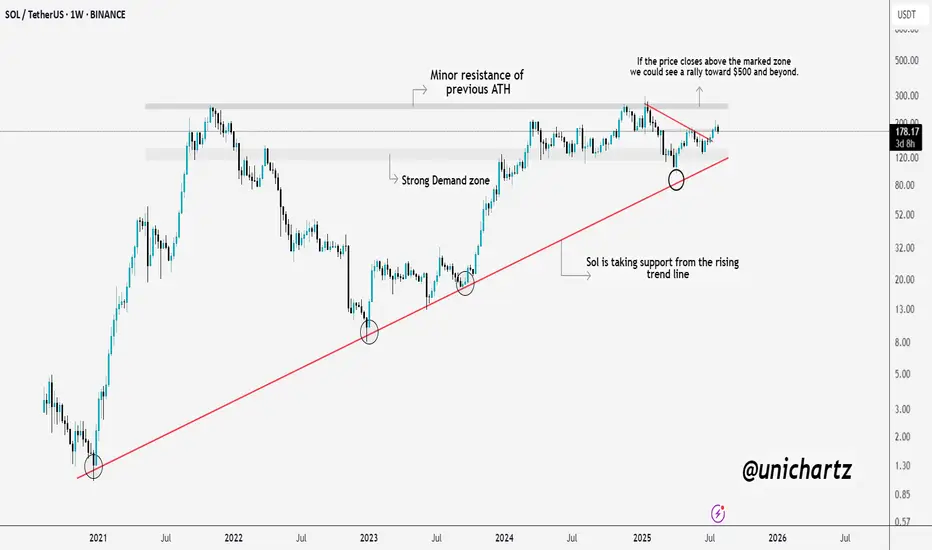
Massive Move Loading? $SOL Prepping for a BreakoutSolana is showing real strength here.
CRYPTOCAP:SOL consistently taking support from the long-term rising trendline, a sign that buyers are defending key levels. We're also approaching a critical resistance zone, which was the previous ATH area.
If SOL manages to close above this zone, we could witness a strong rally towards $500 and beyond. Until then, it’s a crucial level to watch, a breakout here could set the stage for the next leg up.
DYOR, NFA
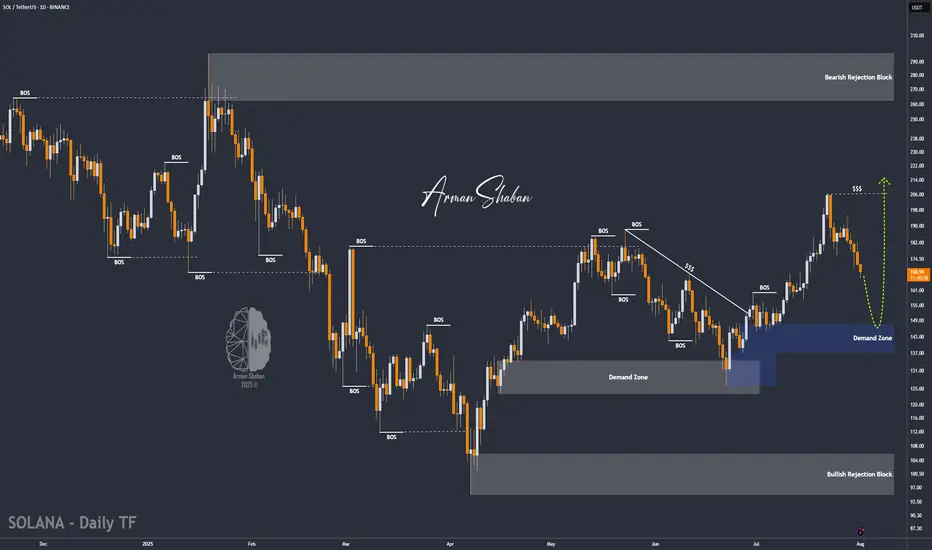
SOL/USDT | NFP Volatility Could Trigger Drop Toward $154!By analyzing the Solana chart on the daily timeframe, we can see that the price is currently trading around $169. If it fails to hold above the $168 level, a deeper drop could follow. With the upcoming NFP data release, increased volatility is expected across the markets. If Solana begins to decline, the potential correction targets are $163, $157, and $154. Watch the $145–$154 zone closely for a possible bullish reaction and buy opportunity.
Please support me with your likes and comments to motivate me to share more analysis with you and share your opinion about the possible trend of this chart with me !
Best Regards , Arman Shaban
#SOL Update #6 – Aug 01, 2025#SOL Update #6 – Aug 01, 2025
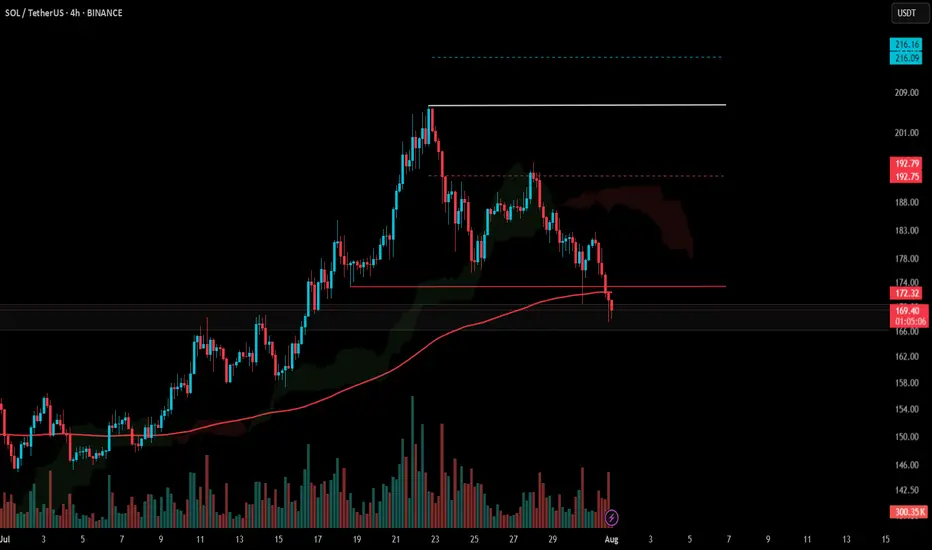
Unfortunately, Solana failed to hold the last low where its most recent impulsive move had started, and it closed below that level. This close also occurred below the MA200 band. In other words, Solana broke a very strong support on the 4-hour chart and moved downward, reaching the previous K-Level zone. It’s hard to say anything positive for Solana at this stage. If the current K-Level fails to hold, Solana may look for support around the $158 level. A long position on Solana is definitely not recommended. I also do not suggest a short position. However, unless there’s a strong reversal, it’s safe to say that Solana has entered a bearish phase on the 4-hour chart.
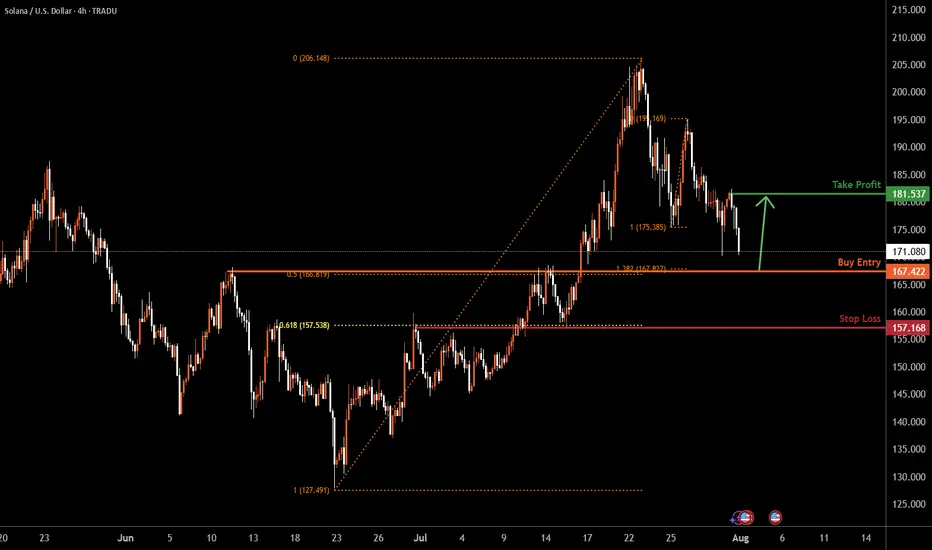
SOLUSD H4 | Bullish bounceBased on the H4 chart analysis, the price could fall to the buy entry, which acts as a pullback support that aligns with the 50% Fibonacci retracement and the 138.2% Fibonacci extension and could bounce to the upside.
Buy entry is at 167.42, which is a pullback support that aligns with the 50% Fibonacci retracement and the 138.2% Fibonacci extension.
Stop loss is at 157.16, which is an overlap support that aligns with the 61.8% Fibonacci retracement.
Take profit is at 181.53, which is a pullback resistance.
High Risk Investment Warning
Trading Forex/CFDs on margin carries a high level of risk and may not be suitable for all investors. Leverage can work against you.
Stratos Markets Limited (tradu.com ):
CFDs are complex instruments and come with a high risk of losing money rapidly due to leverage. 65% of retail investor accounts lose money when trading CFDs with this provider. You should consider whether you understand how CFDs work and whether you can afford to take the high risk of losing your money.
Stratos Europe Ltd (tradu.com ):
CFDs are complex instruments and come with a high risk of losing money rapidly due to leverage. 66% of retail investor accounts lose money when trading CFDs with this provider. You should consider whether you understand how CFDs work and whether you can afford to take the high risk of losing your money.
Stratos Global LLC (tradu.com ):
Losses can exceed deposits.
Please be advised that the information presented on TradingView is provided to Tradu (‘Company’, ‘we’) by a third-party provider (‘TFA Global Pte Ltd’). Please be reminded that you are solely responsible for the trading decisions on your account. There is a very high degree of risk involved in trading. Any information and/or content is intended entirely for research, educational and informational purposes only and does not constitute investment or consultation advice or investment strategy. The information is not tailored to the investment needs of any specific person and therefore does not involve a consideration of any of the investment objectives, financial situation or needs of any viewer that may receive it. Kindly also note that past performance is not a reliable indicator of future results. Actual results may differ materially from those anticipated in forward-looking or past performance statements. We assume no liability as to the accuracy or completeness of any of the information and/or content provided herein and the Company cannot be held responsible for any omission, mistake nor for any loss or damage including without limitation to any loss of profit which may arise from reliance on any information supplied by TFA Global Pte Ltd.
The speaker(s) is neither an employee, agent nor representative of Tradu and is therefore acting independently. The opinions given are their own, constitute general market commentary, and do not constitute the opinion or advice of Tradu or any form of personal or investment advice. Tradu neither endorses nor guarantees offerings of third-party speakers, nor is Tradu responsible for the content, veracity or opinions of third-party speakers, presenters or participants.
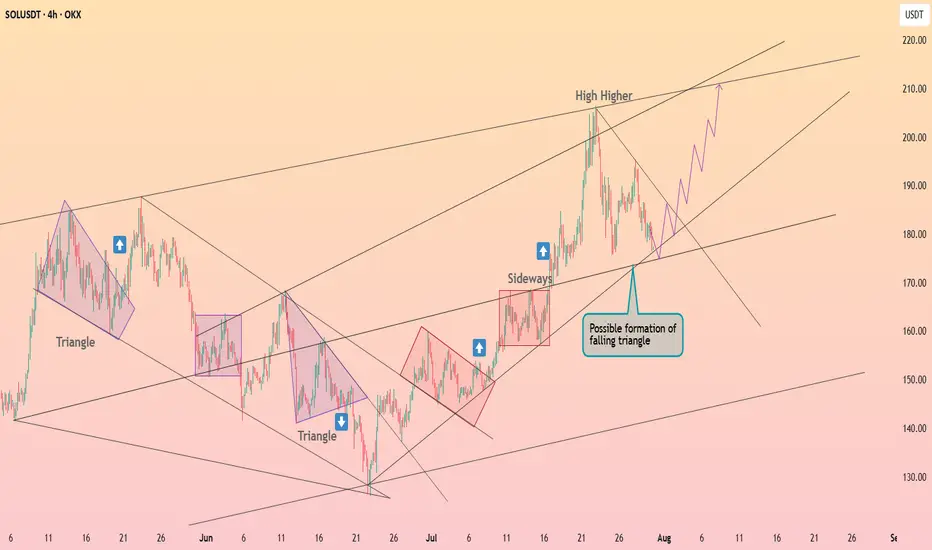
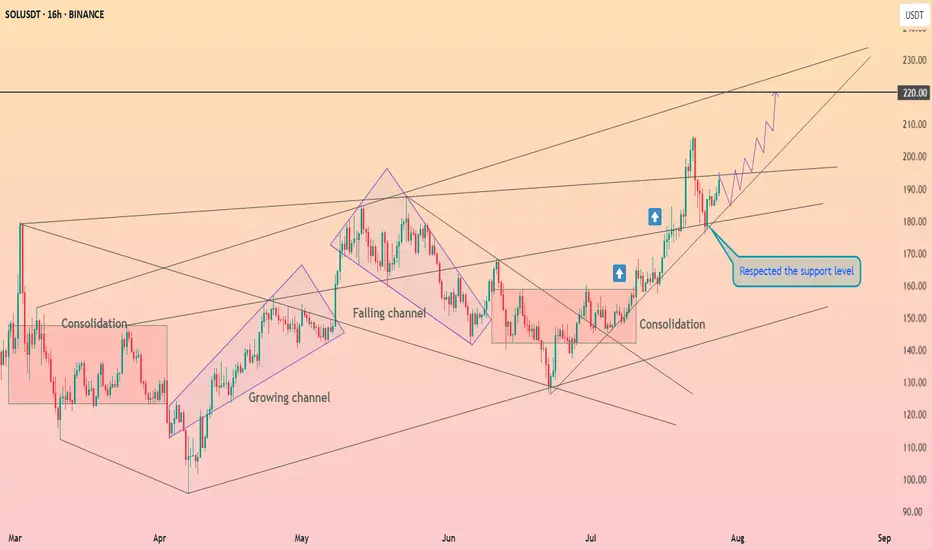
Solana is forming the falling triangle ┆ HolderStatOKX:SOLUSDT is compressing into a possible falling triangle, with support around 180–185 and upward projections pointing toward 210+. The chart has repeatedly shown triangle breakouts into strong rallies. As long as the lower trendline holds, the upside setup remains valid.
#SOL Update #7 – Aug 02, 2025#SOL Update #7 – Aug 02, 2025
Solana has broken below the low of its last impulsive move, forming a new, deeper bottom. The first area where it may find support is the $158 level. If this fails, the next support level lies at $147. At the moment, Solana is clearly in a downtrend on the 4-hour chart. For Solana to resume its upward movement and confirm a trend reversal, it needs to break above the $206 level with a strong, high-volume candle. Currently, Solana might be considered a cheap opportunity only for those looking to hold spot positions long-term. Otherwise, I don't see it as a suitable option for trading.

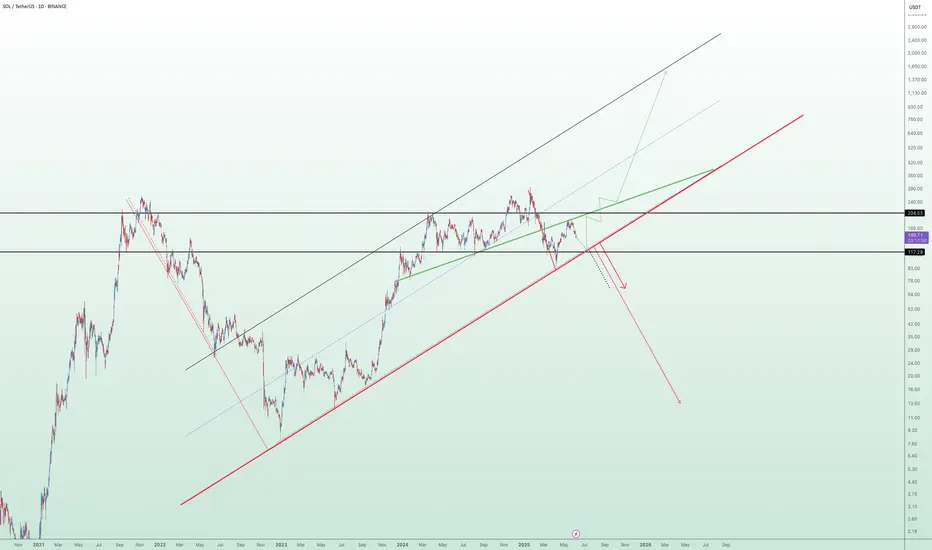
Long-Term Technical Outlook: Critical Decision Point Approaching
The chart illustrates a long-term technical structure where the price has been following an ascending channel after a prolonged bearish trend. However, recent price action indicates a breakdown below the green ascending trendline, raising concerns about a potential shift in market sentiment.
Currently, the $117 level is acting as a pivotal support zone. A sustained breakdown below this level — and more critically, below the red lower trendline — would validate the bearish scenario. This could trigger a deeper correction phase, with downside targets aligned along the red projection path. Such a move may lead to significantly lower price levels in the medium to long term.
🔽 Bearish Scenario:
If the price fails to hold above $117 and breaks below the red trendline, this would confirm the start of a bearish leg. Based on historical structure and projected trajectories, this could result in a descent toward the $93 level initially, with the possibility of extending further downward depending on market conditions.
🔼 Bullish Scenario:
On the other hand, if the price manages to reclaim the green trendline and more importantly, stabilize above the $204 resistance zone, it would signal renewed bullish strength. Such a move would open the path toward higher highs, potentially re-entering the previous upward channel and continuing the macro uptrend.
🧭 The price structure is now approaching a decisive zone, where either a confirmation of bearish continuation or a bullish recovery will likely unfold. Both scenarios have been visually outlined — green lines indicating bullish continuation, and red lines representing bearish momentum.
📌 Note: This analysis is for educational purposes only and should not be interpreted as financial advice.
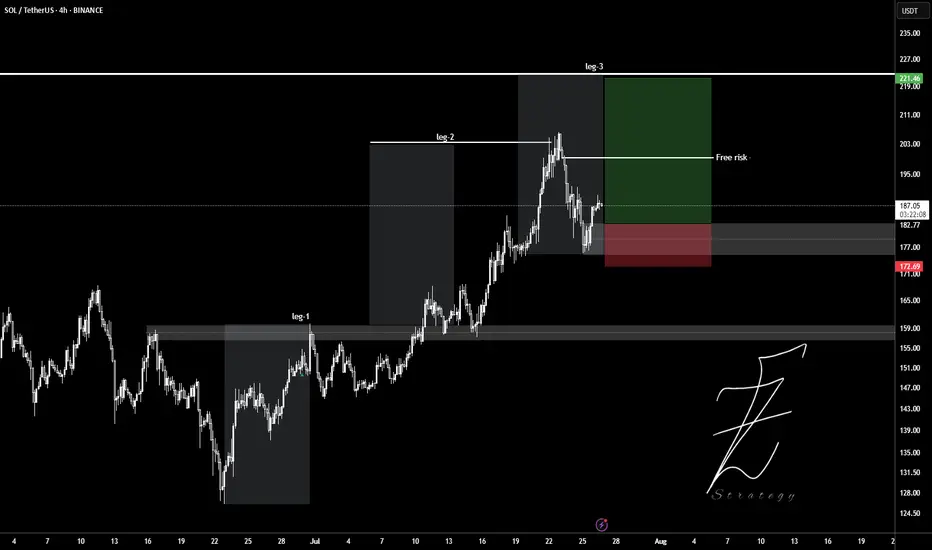
SOLUSDTWait for pollback to 180$ level and ready to get buy position.
Target set in leg2 and leg3.
Entry: 182
Stop: 177
Tp: 190 - 200 - 210 - 220
Please control Risk management.
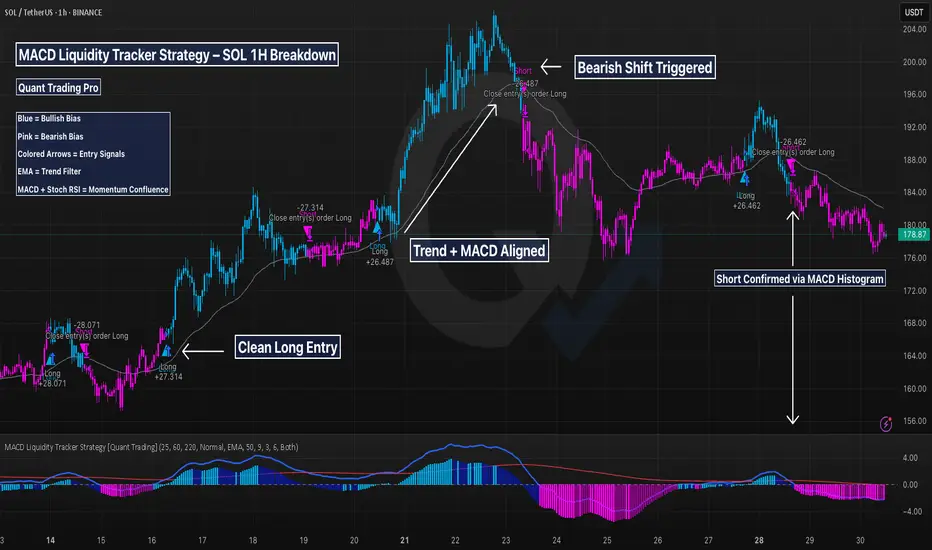
SOL 1H – How This MACD Strategy Filters Noise & Times SwingsThis chart showcases the MACD Liquidity Tracker Strategy applied to Solana’s 1H timeframe — designed to help traders capture clean trend moves while avoiding noisy whipsaws.
The system combines:
✅ MACD momentum filtering (25 / 60 / 220)
✅ 9 & 50-period moving average confirmation
✅ Stoch RSI confluence
✅ State memory logic to reduce false flips
🔍 Strategy Breakdown:
Entry Conditions:
Buys trigger when MACD histogram shifts bullish, the trend filter confirms, and momentum aligns with Stoch RSI. Shorts trigger on the inverse.
Visual Context:
Blue candles = Bullish state
Pink candles = Bearish state
Gray line = Confirmation filter (EMA)
Performance Example:
Caught two major long legs: +27.31 and +26.46
Avoided most chop through clear color-shifting logic
Recent short called the local top with MACD + trend confluence
📌 Why It Works:
The strategy focuses on structure first, signal second — letting trend context and MACD compression guide entries. Unlike traditional crossovers, this approach uses liquidity-aware thresholds to reduce noise and keep traders in the right trend longer.
🧠 Ideal For:
Swing traders on LTFs (15m–4H)
Crypto traders wanting cleaner confirmation
Anyone backtesting with QuantTradingPro or building a trend-following system
This chart shows how combining indicators into a rules-based system can help you trade with clarity — not emotion.
SOL gives a SOUL!SoL just has happened as I told and mentioned earlier, this range looks very lucrative as of now and can turn things in a good manner! Observe where it goes

Solana maintains its upward structure ┆ HolderStatBINANCE:SOLUSDT is bouncing from the $170–172 zone, building higher lows just below resistance at $180. The structure is shaping into a rounded bottom with signs of accumulation. If SOL clears $180 with volume, targets lie at $188 and beyond. Trend remains bullish as long as price stays above the local demand zone.
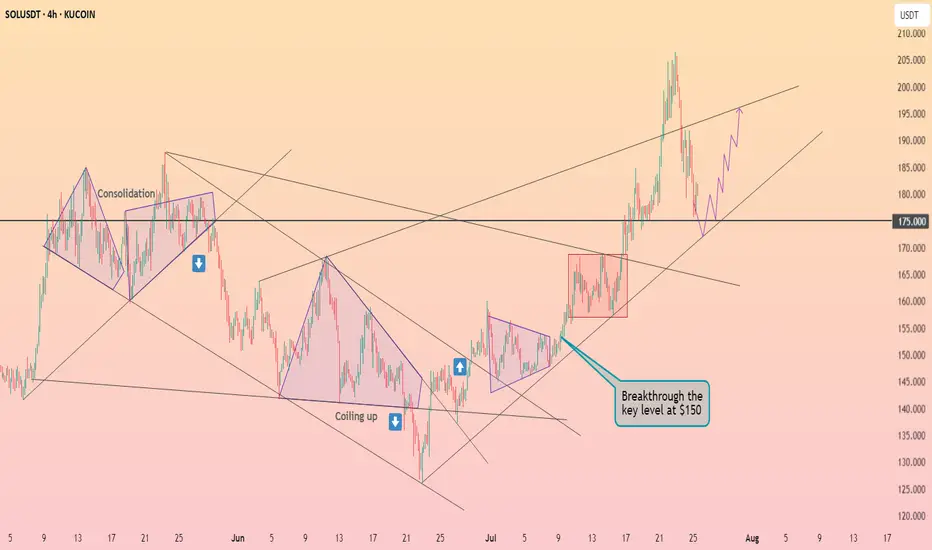
SOLUSD 4H — Holding the Line Before Altseason?Solana’s 4H chart presents a textbook continuation setup — a steady ascending trendline combined with well-defined resistance zones stacked overhead. This kind of compression within an uptrend often precedes explosive expansion, especially when aligned with broader altcoin market sentiment.
📊 Structural Breakdown:
Trendline Support:
Sol has maintained a rising trendline since early June, consistently bouncing off higher lows. This provides a dynamic support zone currently sitting around ~$175–180.
Horizontal Support:
The horizontal box at ~$175 represents prior structure highs turned into support — tested multiple times and aligning with the trendline. A breakdown here would be structurally significant.
Resistance Layers to Monitor:
$215 – Minor S/R flip and local liquidity cluster
$245 – Consolidation ceiling from Q1, where sellers previously took control
$270 – Clean weekly-level rejection from January
$300–310 – Final major resistance from the post-FTX crash range; breakout here signals full bullish expansion
Market Context:
The broader altcoin market is coiling, with majors like ETH and SOL holding structure while BTC ranges. If Bitcoin remains sideways or breaks slightly higher, capital rotation could drive a full “altseason” wave — with SOL as one of the first movers.
🔍 Key Conditions to Watch:
✅ Bullish Scenario:
Price holds ~$175 and breaks above $215 with strong volume
Clean retest of breakout zones confirms continuation
Targeting $245 → $270 → $300 in stages
❌ Bearish Invalidation:
Break and close below $175 trendline support
Would shift bias toward a wider range or even short-term downtrend
⚙️ Indicators to Watch:
4H RSI holding above midline (50) supports bullish continuation
MACD crossover + volume expansion = trigger confirmation
This chart is a reminder that you don’t need to chase green candles — spotting compression structures and planning for breakout zones is where the edge lies. Whether you’re positioning spot or looking for a leveraged entry, this structure rewards patience and timing.

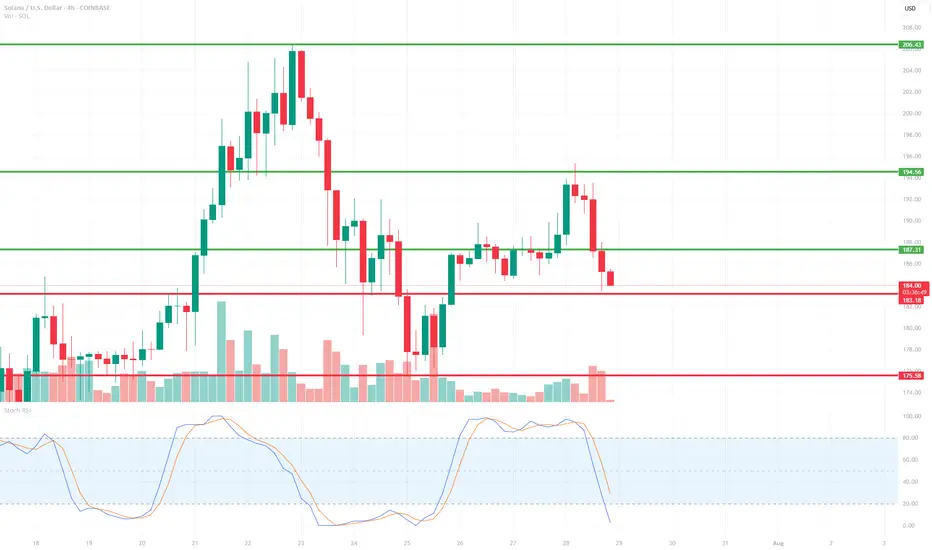
SOL/USD 4H📉 Price
Current price: approximately $183–$184
We see a decline from the resistance zone around $194.56. The price has broken through support at $187.31 and is heading towards lower support at:
🔴 $183.18 – local support (being tested now),
🔴 $175.58 – key support (potential target if current support breaks).
📊 Market structure
Short-term trend: Downtrend (lower highs and lower lows after a rebound from $194.56).
Volume: Increased volume on bearish candles – confirming supply pressure.
Previous trend: Uptrend with strong momentum from July 18th to July 21st.
🔁 Technical Levels
Resistance:
🟢 USD 187.31 – last broken support, now acting as resistance.
🟢 USD 194.56 – strong resistance (tested twice).
🟢 USD 206.43 – local high, strong resistance level from higher timeframes.
Support:
🔴 USD 183.18 – currently being tested.
🔴 USD 175.58 – stronger support from lower swing highs.
📉 Stochastic RSI
Located in the oversold zone (<20) and pointing down.
No upside crossover yet → no buy signal yet.
If a reversal occurs, a technical rebound is possible.
📌 Conclusions and Scenarios
🔻 Downside scenario (more likely currently):
Breakthrough of support at $183.18 ➜ further decline to $175.58.
Potential entry into a correction of the entire upward movement from July 18-21.
🔺 Upside scenario (alternative):
Support at $183.18 held + Stoch RSI signal ➜ rebound to $187.31.
If buying volume increases, a retest of resistance at $194.56 is possible.
SOL - YOUR Choice of SOUL! LOLSOL as usual, pretty straight forward, short on the red, buy on the green, lines abbreviated for you to understand where
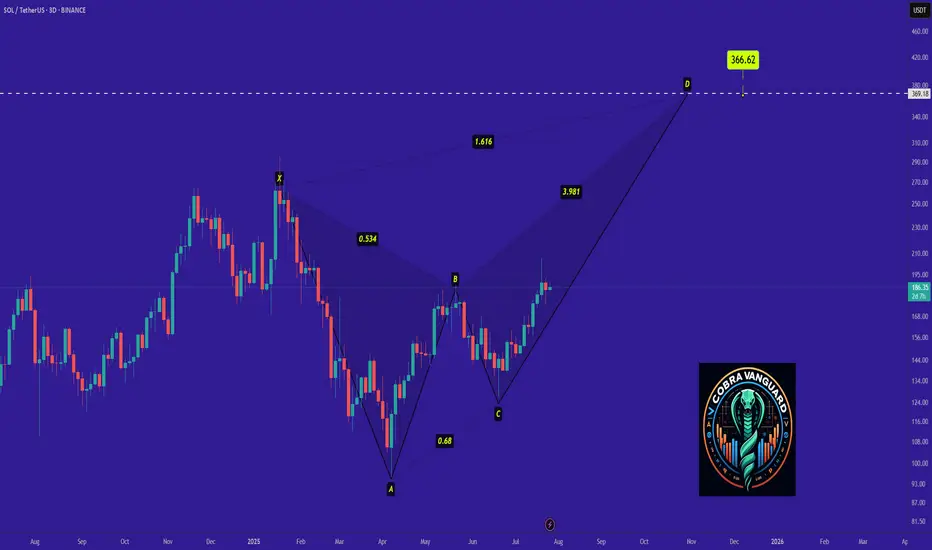
SOL - Time to buy again! (Update)Be careful with SOL !!!
we can hope that the price will act like a Crab pattern and the price will grow well.
I expect that the price will grow very quickly...
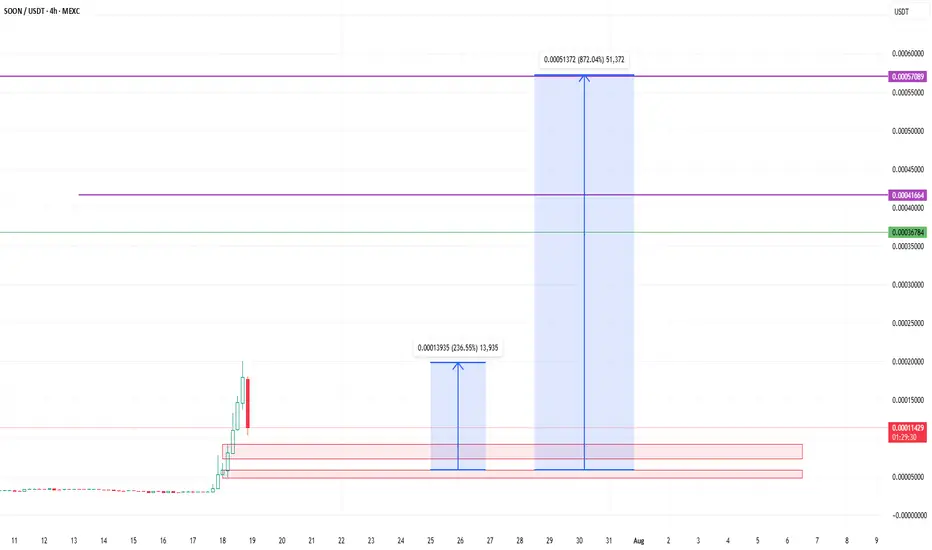
MR SOON GO TO THE MOON with huge commiunity and holder MR soon token is the Best meme for buy noow and a few wait foor a BIG pump so just buy and wait for pump and dont wory be happpy !
MR SOON GO TO THE MOON with huge commiunity and holder
now i am waiting for a very very very BIG PUMP my freind
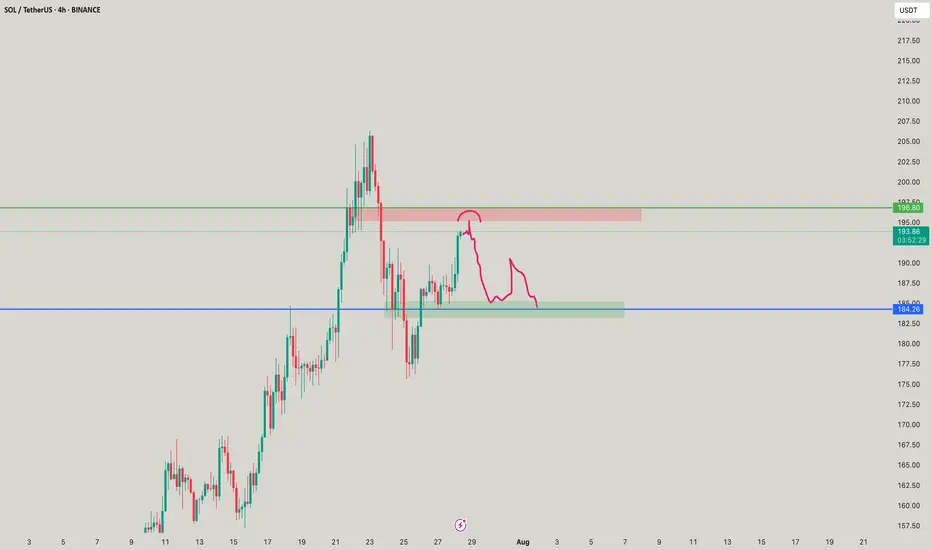
SOL/USDT Technical OutlookPrice may push higher towards the $194 resistance zone.
From there, a sharp rejection is expected, targeting the $171 support area.
If the market fails to hold $171, the next potential downside target lies around $140.
Key Levels:
Resistance: $194
Support: $171, then $140
Structure: Rising channel breakdown in play
📉 Bearish scenario activated if $171 fails to hold.

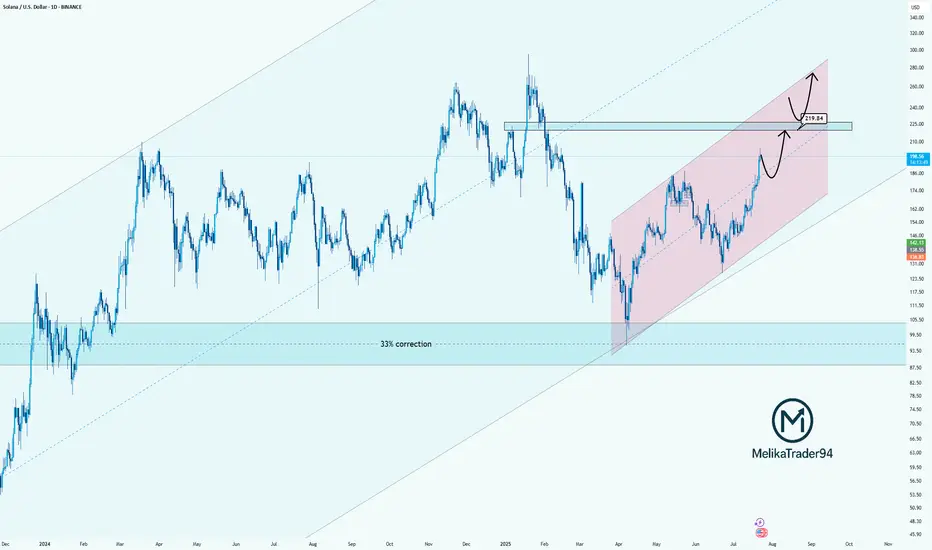
Solana Approaching Key Resistance: watch for $219Hello guys!
Solana has been trending strongly inside a rising parallel channel, recovering steadily after a significant 33% correction. The bullish momentum is clear, and the price is now approaching a key resistance zone near $219.84, which previously acted as a major turning point.
Here’s what I’m watching:
Strong uptrend within the pink channel shows controlled and healthy growth.
$219.84 is a critical decision zone. Price could:
React with a pullback before pushing higher,
Or break through it and flip the level into support for the next bullish leg.
The reaction in this zone will determine the next structure.
Whether we see a temporary correction or continuation to new highs.
Solana is bouncing back from $175 ┆ HolderStatOKX:SOLUSDT is testing the $180 barrier. Breakout could extend gains to $186. If rejected, $172–$173 may act as reentry zone. Market structure favors continuation.
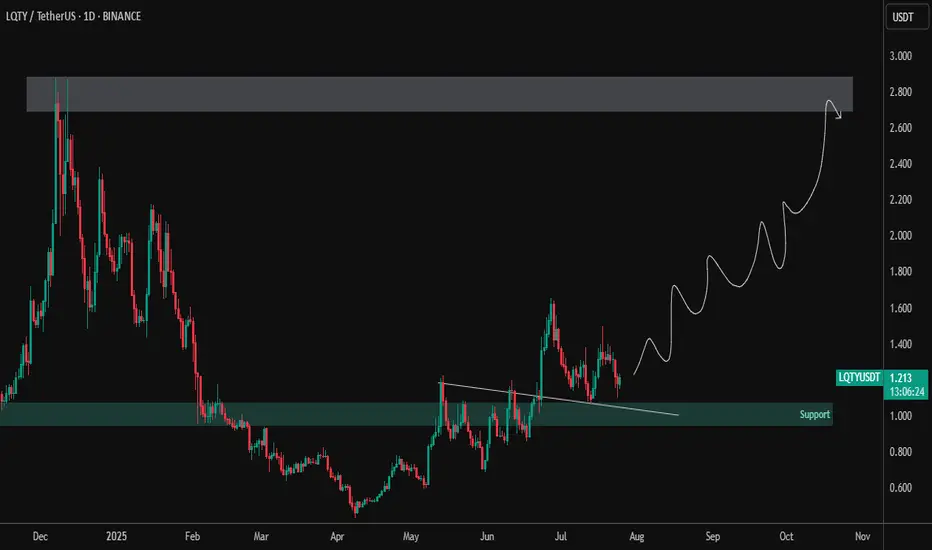
LQTY – Accumulation Completed | Preparing for Trend ReversalLQTY has broken out from a descending structure and reclaimed the key support zone around $1.00–$1.10, showing early signs of accumulation and bullish strength. Currently forming a higher low structure, suggesting a potential long-term uptrend is brewing.
🔹 Technical Highlights:
✅ Clean breakout from descending trendline
✅ Retest of breakout zone holding as support (~$1.10)
🔼 Price printing bullish higher lows on the daily timeframe
🎯 Target zone: $2.70–$2.90 (major resistance from previous highs)
📌 Technical View:
Strong structural base forming
Pullbacks into support area could offer high R/R entries
Break above $1.50 may ignite bullish continuation toward the upper target zone
LQTY appears to be transitioning from accumulation to markup phase. Monitor price action and volume for confirmation of the next leg.
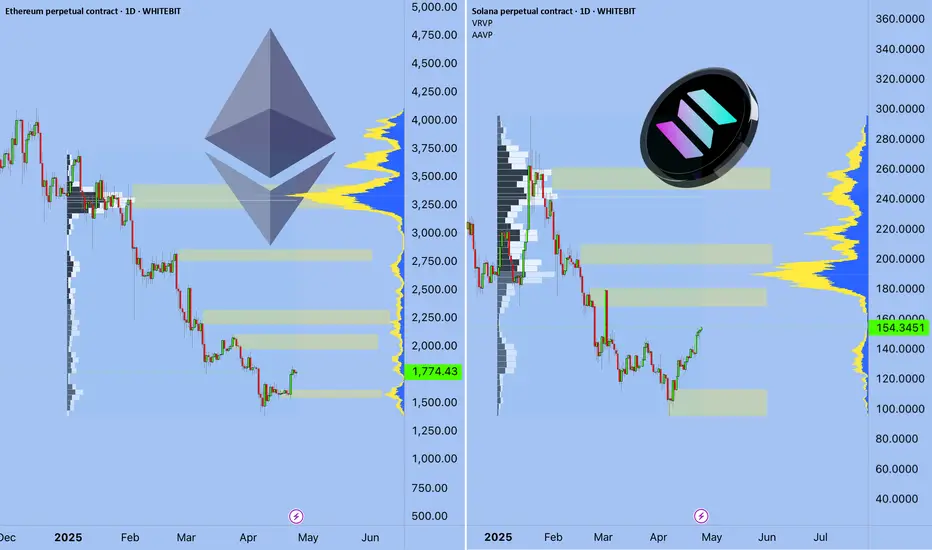
Ethereum vs SolanaIn 2025, the competition between Ethereum and Solana is no longer just a rivalry — it’s a pivotal chapter in blockchain evolution.
We are witnessing a clash of two philosophies:
Ethereum — maturity, security, and deep ecosystem
vs.
Solana — speed, efficiency, and adaptability.
📈 Price Resilience vs. Market Legacy
While Ethereum still holds the crown in market cap and institutional trust, Solana is rewriting the rules with superior transaction speed and cost-effectiveness.
The question is no longer "Who is better?"
It’s "Who is evolving faster?"
⚡ Key Drivers Shaping the Ethereum-Solana Rivalry
1️⃣ Scalability vs. Stability
Solana leads with up to 65,000 TPS, attracting high-frequency traders, NFT creators, and DeFi innovators.
Ethereum, relying on its Layer-2 solutions, tries to balance security with scalability.
2️⃣ Institutional Shifts
Funds like Galaxy Digital and Ark Invest are reallocating capital towards Solana, betting on efficiency and growth.
Ethereum, meanwhile, is waiting on ETF approvals to regain momentum.
3️⃣ Technological Innovation
Ethereum focuses on sharding and Layer-2 expansion.
Solana pushes aggressive ecosystem growth but pays the price with occasional network instability.
📊 Market Performance Snapshot — 2025
Ethereum: ▼ 56% YTD | ~$1,600
Solana: ▼ 40% YTD | ~$135
Solana’s DEX market share jumped to 39.6% in Q1, driven by meme coins and retail traders.
Ethereum’s dominance continues to erode under macro pressures and rising competition.
But don’t be fooled — Ethereum's foundation remains strong. Institutional adoption and infrastructure upgrades still offer potential for a rebound.
📉 ETH/BTC Looks Like a Meme
ETH/BTC:
SOL/BTC: Potential -50% in next 160 weeks ➡️
ETH/SOL:
⚡ Where Did the Liquidity Go?
The real question isn’t why ETH is dropping —
It’s why no one cares.
Layer 2 solutions — Arbitrum, Optimism, Base — have drained liquidity from Ethereum’s mainnet.
DeFi activity? → Migrated to L2
Users? → Choosing lower fees and speed
Ethereum L1? → A blockchain for whales and archives
No liquidity = No rally
No narrative = No attention
Funds are betting on Solana and L2, not Ethereum’s base layer.
🎯 When Could ETH Take Off?
Only if we see:
A strong “Liquidity Returns to L1” narrative (RWA could be a trigger)
Spot ETH ETFs launching with institutional accumulation
A new DeFi wave on L1 (unlikely with current gas fees)
Or simply — when the market decides to pump forgotten assets
For now, Ethereum is about patience.
Smart money is flowing into L2, Solana, and high-risk narratives.
🕒 But Time Will Tell...
Today, we debate ETH vs. SOL.
Tomorrow — the bull market ends, and we’ll be discussing entirely different narratives.
Are you SOL or ETH?
As always, stay one step ahead.
Best regards,
EXCAVO
______________________________
Disclosure: I am part of Trade Nation's Influencer program and receive a monthly fee for using their TradingView charts in my analysis.