SOLUSDT SOLUSDT Analysis 📊
🔹 Support Levels: 118, 112, and 107 USD
🔹 Resistance Levels: 130 and 150 USD
✅ The price has reacted positively after testing the 118-112 USD support zone, showing a short-term bullish move with increasing volume.
📉 If the price fails to break 130 USD, a pullback to 118 USD is possible.
📈 A breakout above 130 USD could pave the way for a move toward 150 USD.
🔍 Conclusion: The bullish trend remains unconfirmed until 130 USD is broken.
SOL

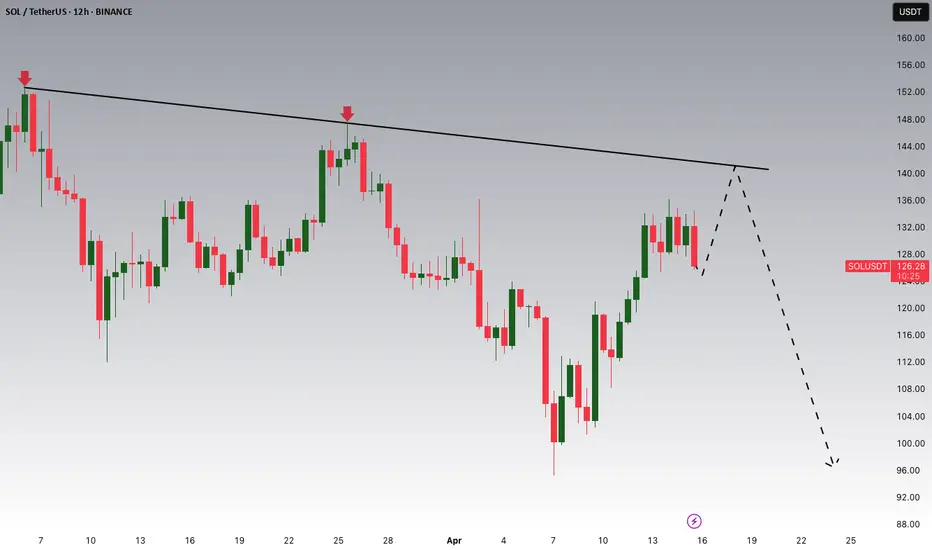
SOLUSDT Breakdown WarningYello Paradisers! Have you spotted what’s happening with SOLUSDT right now? A major breakdown just played out, and this could be the beginning of a much deeper bearish move that many are underestimating.
💎SOLUSDT has broken down from a rising wedge pattern—an important bearish structure that often signals upcoming downside pressure. Before the drop, it swept liquidity, a typical smart money move, and has now confirmed a bearish Change of Character (CHoCH). This combination significantly increases the probability of further decline.
💎If we see a pullback into the resistance zone—it could offer a strong short opportunity with good risk-to-reward ratio. That’s where professional traders start looking to position themselves carefully.
💎However, this bearish idea has a clear invalidation point. If price breaks out and closes a candle above that invalidation level, then the bearish outlook becomes void. In such a case, it’s wiser to stay patient and wait for more precise, high-probability setups to develop.
🎖Strive for consistency, not quick profits. Treat the market as a businessman, not as a gambler. Stay disciplined, Paradisers, and wait only for the cleanest, most reliable trading opportunities. That’s how you make it in this game.
MyCryptoParadise
iFeel the success🌴

$SOL - Pullback to $120 Likely?Solana recently rebounded from a key higher-timeframe support level. However, a short-term pullback to around $120 could be on the horizon before any significant upward move.
For a short-term outlook, check this video.

Sol Extremely Bullish FractalHi
Please click like
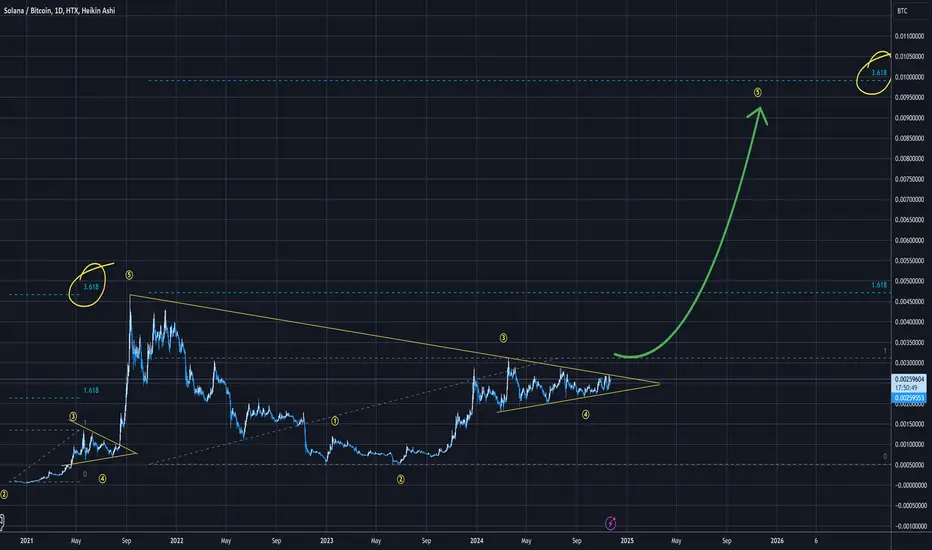
So this is as fractal from previous bull run in 2021, and used the same fibonacci targets for this bull run.
The chart here is SOLBTC, so if peak on this chart is 0.01BTC and BTC today is 100K =
SOL 1k.
If BTC peak is 200K -> Sol is 2K... etc.
----
This is a dreamy target, but it is in my opinion important to have some extreme targets.
I have been in crypto for 7 years, and havent we all seen extreme things happen ?
Perhaps this could be possible with SOL "eth killing" and taking the coin nr 2 place ?
Watch below some other SOL vs ETH ideas. It looks.. possible..
Or ? What do you think ?
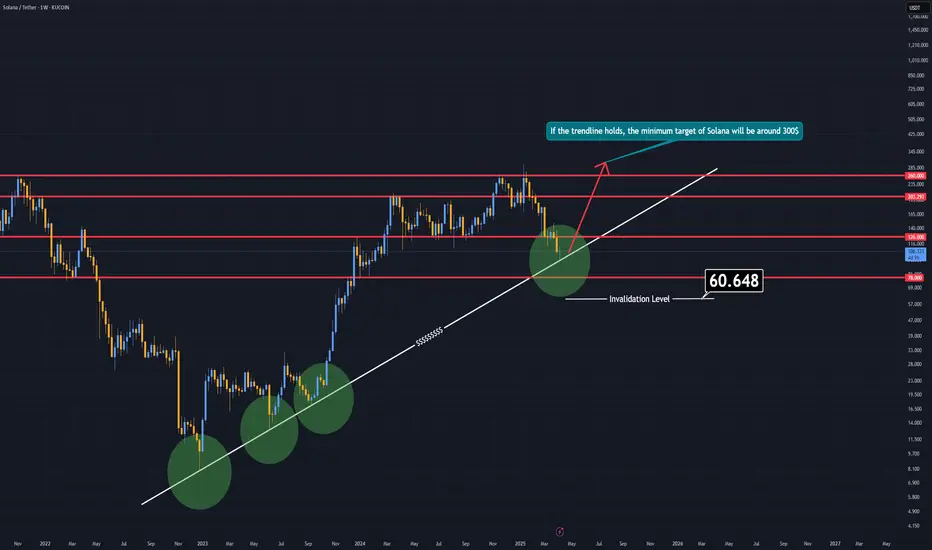
SOLANA WILL RETURNCurrently, SOL is moving in bottom sides of a trendline which is not broken yet.
Despite being full of liquidity, this trendline for SOL might be the best opportuinty to buy for long term.
As long as the level 60$ is not broken, SOL will rise for a new all time high.
Remember, The Ecosystem of Solana build on casino. Gambler always return.
If SOL closes below the level of 60$ in weekly timeframe, the analysis is invalid and you can assume that SOL is diving through a bearish season.
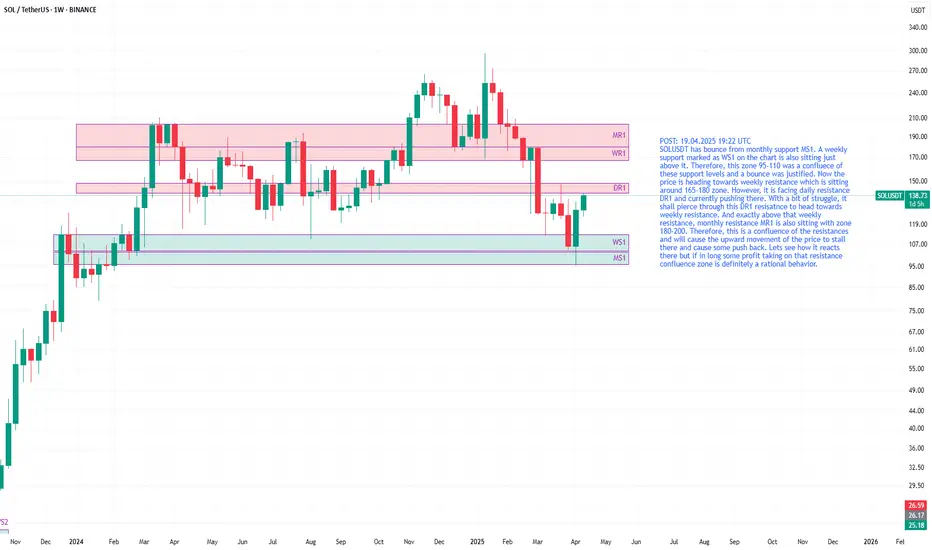
SOLUSDT heading towards resistance 180SOLUSDT has bounce from monthly support MS1. A weekly support marked as WS1 on the chart is also sitting just above it. Therefore, this zone 95-110 was a confluece of these support levels and a bounce was justified. Now the price is heading towards weekly resistance which is sitting around 165-180 zone. However, it is facing daily resistance DR1 and currently pushing there. With a bit of struggle, it shall pierce through this DR1 resisatnce to head towards weekly resistance. And exactly above that weekly resistance, monthly resistance MR1 is also sitting with zone 180-200. Therefore, this is a confluence of the resistances and will cause the upward movement of the price to stall there and cause some push back. Lets see how it reacts there but if in long some profit taking on that resistance confluence zone is definitely a rational behavior.
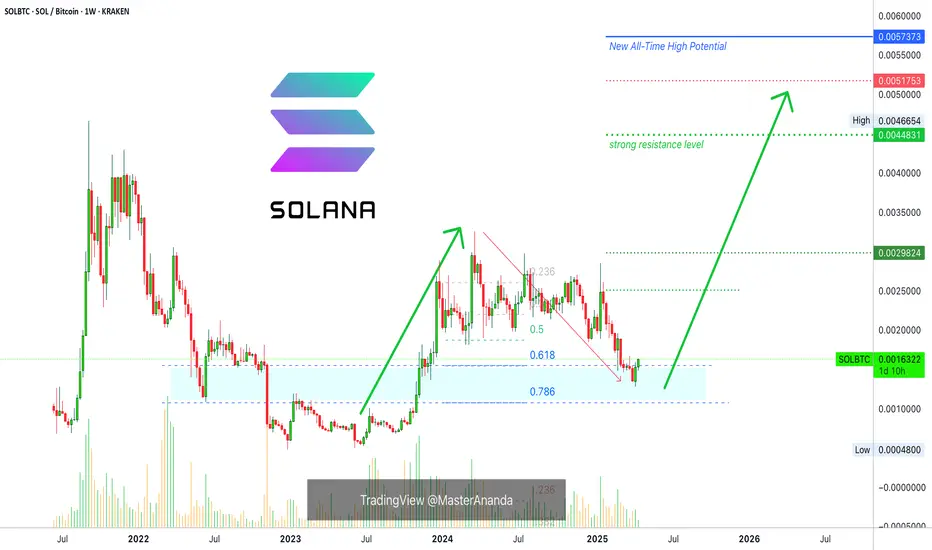
Solana Vs Bitcoin: New All-Time High In Late 2025Solana vs Bitcoin has not been bullish since March 2024 and is about to go bullish now after more than a year of no growth. It went sideways first and then it produced a crash but finally, the market found support.
What we have here is simply awesome because there is no better trade than to trade against Bitcoin when Bitcoin is going up. SOLBTC growing while Bitcoin also grows.
Support was already tested and confirmed. It is over. We are now green.
SOLBTC moved below 0.618 Fib. retracement but bounced before reaching 0.786. Support was found right at the middle. The action recovered back above 0.618 and this is super bullish. This is literally as bullish as it gets and prices are extremely good right now. Bottom prices. The lowest possible before the next bullish wave.
I mentioned with XRPBTC (visit my profile) that the project is developing nicely and a new All-Time High is very likely, high probability. The same is true for SOLBTC. This is another project that is growing very fast and there is strong support from the market and great adoption across the world. Solana is one of the top Altcoins, this we all know.
This week is the second green week with a full green candle. The action will be up, up, up, like late 2023 and early 2024. Something similar but the final swing will be much stronger, the bull market bull run.
It is likely that the end price, the new All-Time High, will go beyond what is shown on the chart.
Namaste.
Solana has just made an upward moveSolana has just made an upward move due to liquidation levels. At the $140 level, we will most likely see a brief downtrend again, after which we will set the price target at $174. Based on historical data, this timing would also make sense, and it aligns with the liquidation levels from futures positions.
SOL: The Leader#Solana is among the top 10 and stands as a key market mover.
It remains in a strong bullish trend, recently bouncing off the 111SMA. Three possible scenarios are presented, two bullish, and one more time-consuming.

Solana Bullish Based On Volume & Support, Or Crash?Solana is now bullish, I shall explain. Many signals are pointing to this fact, these are easy to see. Once I share them here, below, you will agree with me 100%. Correct?
Let's start with the easy part. Volume is rising and has been very strong lately. A significant rise in trading volume after a major drop and as prices grow is a signal that confirms any bullish development. The bullish development is the move and recovery above support.
Support is found as the 0.148 Fib. extension level, Solana trades above it. Support is the early August 2024 low. SOLUSDT trades above it. Support is EMA34, Solana closed daily above this level after resistance was met. Support found, bullish.
The RSI is bullish with a reading of 55. A bottom formation is present, v shaped pattern. Do you want more?
One signal is good but not enough. Two signals are good but we need more. Three signals can count toward reaching certain conclusions about what will happen next. When you have 5, 6, 7 strong signals all combined, it is hard to miss what the chart has to say. Too many signals now are pointing toward higher prices. Do you see any bearish signals?
You can say bearish only if you ignore the bullish signals.
Or you can say bearish if you don't have a chart.
If you are with me now —thanks for the support— you already know that Solana is set to grow.
Solana will soon trade above $400. Very easy, I know you agree with me because I showed you data to support my point of view. It is not done blindly. Everything I wrote can be confirmed by anyone, at any point in time. Now.
You can check each signal for yourself; what do you see?
I see a low 7-April followed by a quick recovery. I see the market now turning green.
Do you agree?
If you do, follow me.
Namaste.

Solana (SOL) Market Overview – April 17, 2025As of April 17, 2025, Solana (SOL) is trading at approximately $134.55 USD, reflecting a 5.48% increase from the previous close.
⸻
📈 Technical Analysis
Price Action & Momentum:
• Recent Performance: SOL has rebounded from lows near $120 to around $134.55, positioning itself as one of the top-performing altcoins recently.
• Support & Resistance Levels:
• Immediate Support: $120 – Crucial for sustaining the current bullish momentum.
• Resistance Zone: $133 – $135 – A breakout above this range could unlock further upside.
Key Indicators:
• RSI: 53.90 – Neutral momentum
• MACD: -3.01 – Slightly bearish
• Stochastic Oscillator: 92.14 – Overbought territory
• ADX: 19.10 – Weak trend strength
⸻
🧭 Fundamental Analysis
Network Strength:
• High Throughput & Low Fees: Solana continues to dominate with its scalable and low-cost blockchain infrastructure.
Institutional Interest:
• ETF Activity: Five ETF filings as of March 2025 highlight increased institutional trust in Solana.
Market Sentiment:
• Fear & Greed Index: 29 – Market is in “Fear” zone, potentially creating long-term buying opportunities.
⸻
🔍 Summary
Solana is showing bullish recovery signs driven by positive price action and ETF momentum. However, technicals suggest a cautious approach in the short term due to overbought signals and weak trend strength. Fundamentally, Solana’s powerful infrastructure and institutional support could fuel long-term growth.
SOL – Small pullback to then grab the liquidity?This 1H chart of SOLUSDT on Bybit showcases a clean bullish continuation setup after a strong impulsive move upward. The current price action suggests a strategic retracement into a high-probability zone of interest before a potential continuation toward buy-side liquidity.
---
1. Market Structure & Context:
- SOL has shifted market structure to the upside following a strong impulse that broke previous lower highs.
- The current pullback resembles a classic bullish retracement, aligning with smart money concepts where price revisits inefficiencies and discount zones before continuation.
- The low on the retracement appears to be forming a higher low relative to the previous structure.
---
2. Fair Value Gap (FVG) + Golden Pocket Zone:
- The blue box represents a clear Fair Value Gap created during the recent rally — a price imbalance often targeted for entries by institutions.
- Overlaying that zone is the Fibonacci golden pocket (0.618–0.65), a highly reactive retracement area in bullish moves.
- The confluence of FVG and the golden pocket makes this a powerful demand zone, supported by historical order flow behavior.
---
3. Fibonacci Levels & Price Action:
- 0.618–0.65 zone: Ideal entry region during bullish retracements. Price is currently reacting within this band.
- 0.786 level: A deeper retracement level that still supports bullish continuation if respected — though it marks the edge of the current FVG.
- The equilibrium between these levels represents a discount area for accumulation.
---
4. Liquidity Outlook – Buy-Side Liquidity (BSL):
- A clear BSL (Buy-Side Liquidity) sits above the previous local high.
- Price is likely to target this level as the next point of liquidity collection once the retracement completes.
- The green arrowed path shows the anticipated flow: a short-term dip into the FVG before a bullish move to sweep the BSL.
---
5. Trade Narrative:
- This setup reflects an entry based on optimal trade theory — retracement into a zone of inefficiency and discount (FVG + golden pocket).
- Bullish continuation is expected if this zone holds, especially with confluence from market structure and resting liquidity overhead.
- Ideal confirmation may involve lower timeframe bullish breaks of structure inside the FVG.
---
Summary:
SOL is offering a textbook retracement setup on the 1H, with price pulling back into a confluence of a Fair Value Gap and golden pocket (0.618–0.65). If the zone is respected, the next likely destination is the buy-side liquidity resting above previous highs. The reaction within this area will be key to validating the bullish scenario.

SOLANA back above support. SOL is back above horizontal support. After a stop hunt, the manipulation is likely over. If the price can make a higher high here we start to build a choch of the structure. Momentum and trend oscillators are also in confluence.
Full TA: Link in the BIO

SOL - Longs on the Horizon!Hello TradingView Family / Fellow Traders. This is Richard, also known as theSignalyst.
📈 Medium-Term : SOL has been overall bearish and it is currently trading within the flat wedge pattern marked in red.
📍 As it retests the lower bound of the wedge — which perfectly intersects with the $100 round number — I’ll be looking for short-term longs.
🚀 In parallel, for the bulls to take over in the long term and kick off the next bullish phase, a breakout above the $147 previous daily high is needed.
Which scenario do you think will happen first — and why?
📚 Always follow your trading plan regarding entry, risk management, and trade management.
Good luck!
All Strategies Are Good; If Managed Properly!
~Rich

Solana Potential DownsidesHey Traders, in today's trading session we are monitoring Solana for a selling opportunity around 140 zone, SOLUSDT is trading in a downtrend and currently is in a correction phase in which it is approaching the trend at 140 support and resistance area.
Trade safe, Joe.
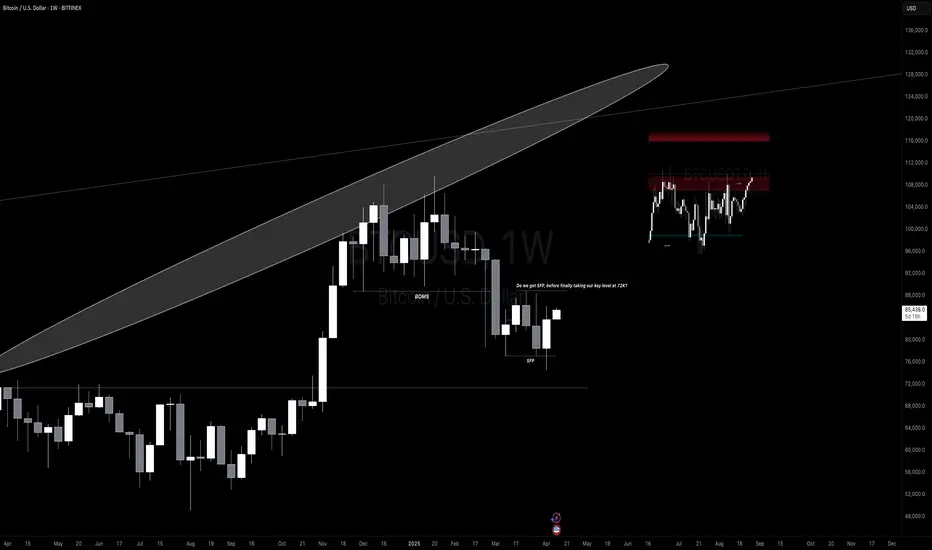
Is BTC set to hit 90K before dropping?#BTC has been range-bound on the weekly , recently forming an SFP below the range low but failing to close below the Feb and Mar 10th lows. Could we see an SFP above the RH ($90K) before moving lower, potentially toward the FWB:65K -$72K target? That remains to be seen. The HTF MS remains bearish, and until it shifts, the risk to the downside is high. For a bullish shift on the weekly, we need weekly closes above $94000. Until then, downside risk persists.
On LTF/MTF: I update my analysis regularly, but for now, I’m considering a few scenarios:
👉a. BTC could bounce from an 18H HOB if the 2H HOB breaks, potentially aligning with USDT.D hitting a 23H HOB at 5.62%. This might form a DB at a 22H PHOB at 5.35%, or USDT.D could target a 12D demand or a 22H HOB at 5.15%.
👉b. BTC might bounce, breaking the current 21H OB, and reach the HTF supply at $90K, while USDT.D takes the 23H PHOB and possibly the 22H HOB before rising to 5.77%-6.01%.
Also note, the daily close below the $84600 SH shows weakness on the chart. There’s little to do until we either reach $72K or see an MS shift, which could open risky upside trades. These are risky because we haven’t taken the liquidity needed for higher prices. MT also mentioned that higher prices without key level breaks are likely a bull trap. Avoid heavy trades until direction is clear.
Until then, we focus on taking LTF scalp trades 🤝
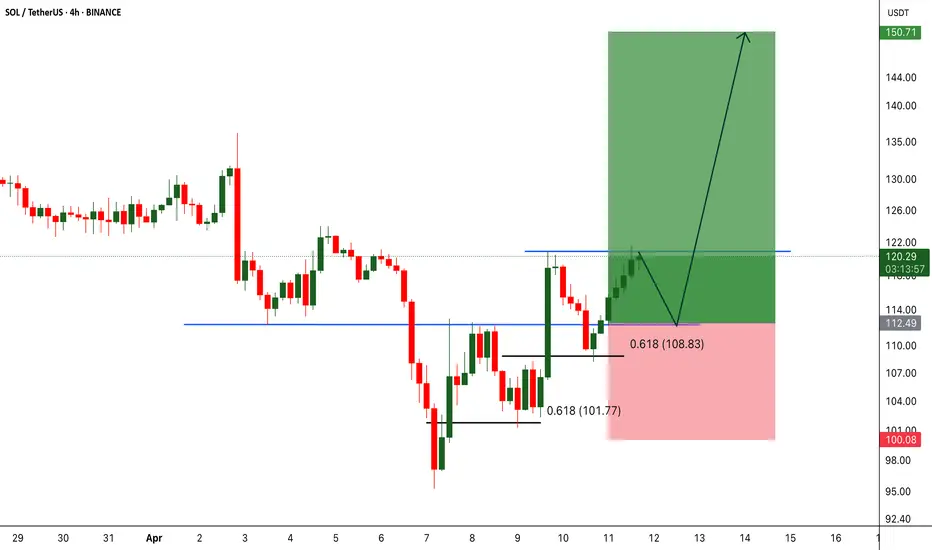
SOLUSDT Holding Support, Targeting $150BINANCE:SOLUSDT bounced perfectly from the 0.618 Fib level and is now testing resistance. A small dip back to support is possible, but if $110 holds, we could see a strong move toward $150. Compared to other altcoins, SOLUSDT is showing real strength. Once the tariff noise clears, this could be one of the top performers. Always manage risk and set your stop loss!
BINANCE:SOLUSDT Currently trading at $118
Buy level: Above $112.5
Stop loss: Below $100
Target : $150
Max Leverage 3x
Always keep Stop loss
Follow Our Tradingview Account for More Technical Analysis Updates, | Like, Share and Comment Your thoughts
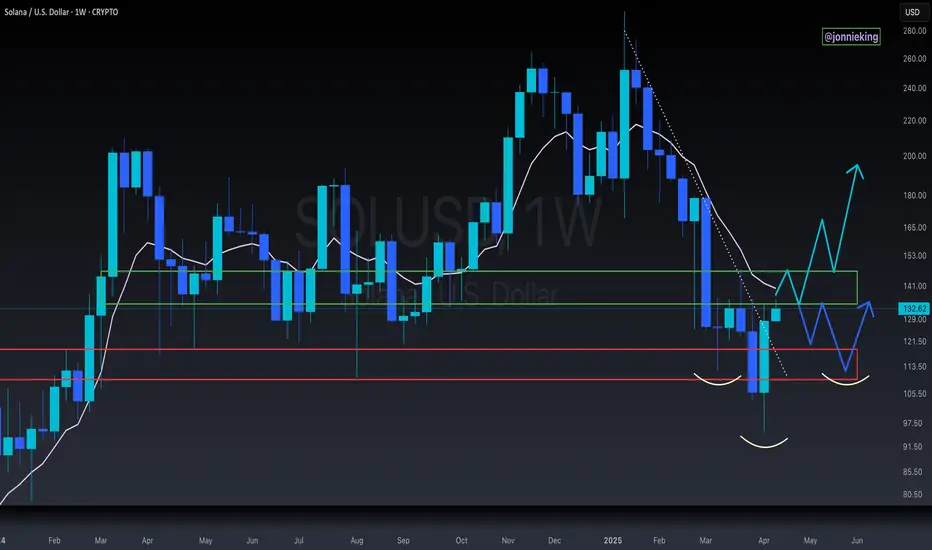
$SOL Bullish Engulfing Candle on Weekly CloseBig Bullish Engulfing candle for Solana on the weekly close.
Needs to breakthrough EMA9 and claim as support.
If not, we could see an inverse head and shoulders reversal pattern formed ~$112 before the next leg up.
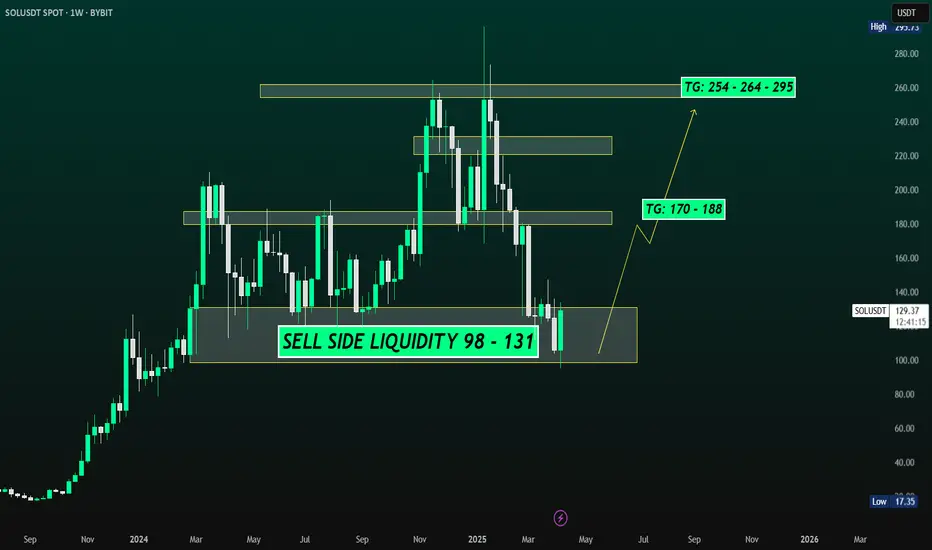
SOLANA (SOL/USDT) – TP: 170 - 252 & 295SOLANA (SOL/USDT) is currently trading at $130.17 after rebounding from a well-defined sell-side liquidity zone between $98 and $131. The recent weekly candle shows a strong bullish recovery (+22.93%), suggesting that liquidity has been swept and buyers are stepping in. This level has historically served as a key accumulation zone, and the bounce aligns with oversold conditions on the StochRSI, which is now curling upward — indicating growing bullish momentum. If price sustains above the $125–131 level, the next immediate upside target lies between $170 and $188, where prior supply and consolidation occurred. A confirmed breakout above this range opens the path toward a higher resistance zone between $254 and $295 — a region that aligns with unfilled inefficiencies and previous price distribution.
The ideal swing trade approach would be to enter on a pullback within the $110–125 range, set a stop loss below $98, and scale out at the $170 and $254 levels. This setup offers a favorable risk-to-reward ratio of approximately 1:3.5.
Trade Strategy Suggestion (Swing or Positional):
Entry: Ladder between $115–$125 on retrace
SL: $105–110 (below wick low)
TP1: $170–188
TP2: $254–295
Scaling Out: 50% at TG1, rest at TG2 or trail stops above $200
With macro tailwinds like renewed interest in Solana’s DeFi and meme coin ecosystems, institutional flow returning, and technical confirmation across multiple timeframes, this could be a high-conviction mid-term play for swing traders and positional investors alike.
🔮 Narrative & Fundamentals:
ETH L2 congestion → SOL gets transactional inflows
SOL’s DeFi, NFT, and memecoin activity resurging (e.g., SEED_WANDERIN_JIMZIP900:WIF , SEED_DONKEYDAN_MARKET_CAP:BONK ecosystem)
Institutional flow picking up (Grayscale SOL trust rallying)
SOL remains one of the fastest L1s with growing developer traction
CLAIM your SOUL for SOL!As analysed, the doodle says this, go for it? or let that short slowly chuck you to liquidation?

Janover Stock Spike 1100% After Completing First Solana PurchaseJanover (NASDAQ: NASDAQ:JNVR ) has invested over $9.6 million into Solana (83,000+ SOL) as part of a new digital asset treasury strategy, with plans to stake its holdings and run validators to generate onchain revenue.
The move follows a $42 million funding round and has triggered a 1,100% surge in Janover’s stock price as the company positions itself as a transparent, publicly traded vehicle for crypto exposure.
The company bought $4.6 million of Solana’s SOL token on Thursday. Earlier this week, Janover announced that it raised $42 million through the private offering of convertible notes and warrants, with plans to acquire SOL.
Janover shares were last higher by more than 64%, after skyrocketing more than 1,100% earlier in the day.
“Our aim is to be the most efficient and transparent vehicle for crypto accumulation in the public markets,” Janover CEO Joseph Onorati said in a statement Thursday. “Executing our first SOL purchase within days of completing our restructuring reflects that commitment.”
Janover, a software company founded in 2018, on Monday announced a new crypto-focused treasury management strategy after a team of former executives from the popular Kraken crypto exchange acquired majority ownership of the firm. It also plans to change its name to DeFi Development Corporation and revise its ticker symbol.
As of the time of writing, the stock is up 13.88% with the RSI at 58.77 there could be room for more bullish campaign. Similarly, the 45 -minute price chart depicts a cup formation with the handle still forming- this is typically identified as a bullish pattern.

Solana Surges Nearly 8% As Janover Pivots to Solana Treasury The price of Solana ( CRYPTOCAP:SOL ) famously known as the ethereum killer has surged nearly 8% today as Commercial property platform Janover pivots to Solana treasury strategy, stock surges 1,100% as investors rush in prior the news.
Janover has invested over $9.6 million into Solana (83,000+ SOL) as part of a new digital asset treasury strategy, with plans to stake its holdings and run validators to generate onchain revenue.
The move follows a $42 million funding round and has triggered a 1,100% surge in Janover’s stock price as the company positions itself as a transparent, publicly traded vehicle for crypto exposure.
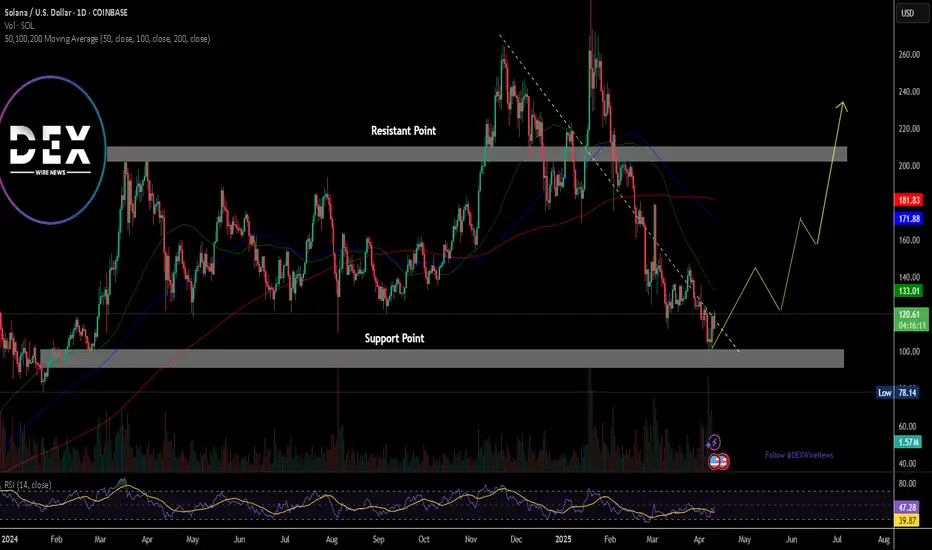
Solana has lost grip of the $120 pivot for the past 2 weeks, but reclaimed the zone today currently trading at $120.54 per $SOL.
The daily price chart shows Solana has been trading within an enclose rectangular zone with the Resistant and support points slightly above each other. For Solana, a break above the $170 zone could pave way for a move to the $200- $270 zone. Similarly, a break below the $100 zone could be catastrophic for Solana.
However, the RSI shades a bit of a light at the end of the tunnel as it stands at 47, which is prime for a reversal.